WSRC-TR-2002-00194
Comparison of Cross Flow Filtration Performance for Manganese
Oxide/Sludge Mixtures and Monosodium Titanate/Sludge Mixtures
Michael R. Poirier and Samuel D. Fink
Westinghouse Savannah River Company
Aiken, SC 29808
Vincent Van Brunt, Ralph Haggard, Travis Deal, and Carol Stork
University of South Carolina
Columbia, SC
This report was prepared as an account of work sponsored by an agency of the United States Government. Neither the United States Government nor any agency thereof, nor any of their employees, makes any warranty, express or implied, or assumes any legal liability or responsibility for the accuracy, completeness, or usefulness of any information, apparatus, product or process disclosed, or represents that its use would not infringe privately owned rights. Reference herein to any specific commercial product, process or service by trade name, trademark, manufacturer, or otherwise does not necessarily constitute or imply its endorsement, recommendation, or favoring by the United States Government or any agency thereof. The views and opinions of authors expressed herein do not necessarily state or reflect those of the United States Government or any agency thereof.
This report has been reproduced directly from the best available copy.
Available for sale to the public, in paper, from: U.S. Department of Commerce, National Technical Information Service, 5285 Port Royal Road, Springfield, VA 22161, phone: (800) 553-6847, fax: (703) 605-6900, email: orders@ntis.fedworld.gov online ordering: http://www.ntis.gov/support/index.html
Available electronically at http://www.osti.gov/bridge
Available for a processing fee to U.S. Department
of Energy and its contractors, in paper, from: U.S. Department of Energy, Office
of Scientific and Technical Information, P.O. Box 62, Oak Ridge, TN 37831-0062,
phone: (865 ) 576-8401, fax: (865) 576-5728, email: reports@adonis.osti.gov
Summary
Personnel performed engineering-scale tests at the Filtration Research Engineering Demonstration (FRED) to determine crossflow filter performance with a 5.6 M sodium solution containing varying concentrations of sludge and sodium permanganate. The work represents another in a series of collaborative efforts between the University of South Carolina and the Savannah River Technology Center in support of the process development efforts for the Savannah River Site. The current tests investigated filter performance with slurry containing simulated Tank 40H Sludge and sodium permanganate at concentrations between 0.070 wt % and 3.04 wt % insoluble solids.
The tests evaluated filter performance by varying the axial velocity and transmembrane pressure using an 11-point statistical matrix and measuring filter flux. Personnel collected and analyzed filtrate samples to determine whether any particle breakthrough occurred. The study used an online Lasentecâ analyzer to measure changes in particle size and number during the permanganate precipitation process, and to measure particle degradation during filtration.
The key findings of the investigation follow.
Keywords: Filtration, Permanganate, Pilot Scale
Introduction
The Department of Energy selected caustic side solvent extraction (CSSX) as a preferred cesium removal technology for Savannah River Site waste.1 A pretreatment step for the CSSX flowsheet contacts the incoming salt solution that contains entrained sludge with MST to adsorb strontium and select actinides. The process filters the resulting slurry to remove the sludge and MST. The filtrate receives further treatment in the solvent extraction system.
Testing performed by SRTC and the University of South Carolina with simulated waste and MST showed relatively low filtration rates of 0.03 – 0.08 gpm/ft2.2,3,4,5 Additional testing conducted with actual waste showed similar filtration rates.6,7 Testing to develop the design for the Hanford Waste Treatment Plant showed the addition of strontium nitrate and sodium permanganate improved filtration rates for their waste.8 In the Hanford process, addition of permanganate forms solids – as the permanganate gets reduced by the organic content of the waste – and these solids remove strontium and alpha-emitting radionuclides. Crossflow filtration tests performed by SRTC in 2001, using simulated wastes, also showed improved filtration rates upon addition of strontium nitrate plus sodium permanganate or sodium permanganate alone to the waste rather than MST.9 Because of these results, the DOE-SR through the Tanks Focus Area requested SRTC and the University of South Carolina to conduct engineering-scale crossflow filter tests with permanganate addition rather than MST.10
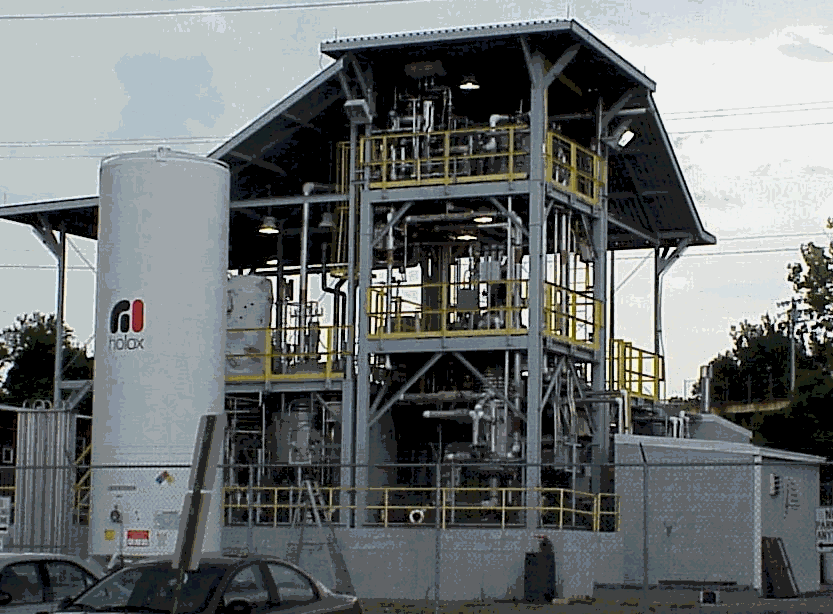
The testing occurred at the FRED facility shown in Figure 1. The FRED facility contains a filter element with seven Mott filter tubes. Each tube is made from sintered stainless steel, 0.75 inches OD, 0.625 inches ID, 10 feet long, and nominal 0.5 micron pore size.

Figure 1. Filtration Research Engineering Demonstration
Experimental Approach
Permanganate and Peroxide Addition
The USC Analytical lab performed work before starting the engineering scale testing to test the effectiveness of the hydrogen peroxide and sodium permanganate in forming MnO2 solids. Some of the key findings follow.
The addition of hydrogen peroxide to the surface of the slurry reduced the effectiveness and efficiency of the reaction, necessitating the use of 3 - 9X the stoichiometric amount of peroxide to complete the permanganate reduction. The amount of peroxide needed proved comparable using both 6 wt % and 30 wt % peroxide.
When personnel injected the peroxide below the surface of the slurry, the reaction proved more efficient. Figure 2 shows the method employed to add the permanganate and peroxide in the laboratory. Personnel added permanganate or peroxide with the syringe to provide pressure, while the air forced the fluid from the bottom of the tube into the slurry in the beaker. The beaker remained continuously stirred with a magnetic stir bar during this process. With this configuration, addition of 1 – 2X the stoichiometric amount of peroxide completed the reduction of permanganate.
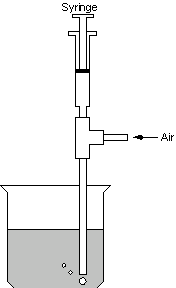
Figure 2. Apparatus Employed to Add Permanganate and Peroxide in Lab
The larger scale demonstration at FRED incorporated a similar design to introduce the peroxide and permanganate to the slurry tank. Figure 3 shows the apparatus. A peristaltic pump supplied the permanganate or peroxide (at 0.8 – 2.0 L/min) providing positive pressure to force the liquid into a dip tube located in the slurry tank. Pressure from nitrogen (40 psi, 5 SCFH) pushed the permanganate and peroxide down into the slurry. An agitator with three impellers of three blades each operating at 81 rpm provided mixing. The top two impellers included 45° pitched blades. The design used a radial flow impeller near the bottom of the tank. In addition, a 135 gpm pump circulated the contents of the tank through a flow loop and back into the tank. The slurry volume varied between 350 gal and 450 gal during chemical addition.

Figure 3. Apparatus Employed to Add Permanganate and Peroxide
at Filtration Research Engineering Demonstration
Filter System Preparation
Prior to performing filter tests, personnel cleaned the filter system. The cleaning process first washed the equipment by circulating deionized water for 20 minutes. Then personnel added oxalic acid, heated to 122° F, and circulated for 60 minutes. They next flushed using deionized water flowing from shell to tube side to remove the oxalic acid. Then they washed the filter system by circulating deionized water for 20 minutes. Personnel added caustic, heated to 122° F, and circulated for 60 minutes. They flushed from shell to tube side with deionized water to remove the caustic. Then they washed the filter system by circulating deionized water for 20 minutes.
Following cleaning, researchers measured the filter flux with deionized water. The water flux equaled 0.84 – 1.44 gpm/ft2 at 30 ° C, 15 - 45 psi transmembrane pressure (TMP), and 4 - 14 ft/s axial velocity. The measured clean water flux ranged between 0.83 and 1.56 gpm/ft2 at 50 ° C, 15 - 45 psi TMP, and 4 - 14 ft/s axial velocity. These measured values indicated an adequately cleaned filter, and agree with previous clean-water flux rates measured with the filter.
The simulated waste slurry contained nominally "average" Savannah River Site salt solution. Table 1 shows the concentrations of the soluble components in the feed solution. The actual initial slurry contained 5.9 M sodium. The water added with the sludge, sodium permanganate, and hydrogen peroxide subsequently diluted the feed. The target sodium concentration after all additions equaled 5.3 M. Table 2 shows the concentrations of materials added to the feed solution to produce the insoluble solids.
Personnel set the tank temperature to 35 ± 3 ° C, and added simulated Tank 40H sludge to reach a measured concentration of 0.031 wt %. Next, they added sufficient sodium permanganate to reach a solution concentration of 0.064 wt % NaMnO4. They circulated the feed solution through the system to mix it, and collected a filtrate sample to determine whether the permanganate reduction started. Although personnel had not added hydrogen peroxide, the filtrate sample proved clear indicating complete reduction of the permanganate (see Figure 4). Apparently, the sodium formate present in solution or a component of the sludge proved sufficient to reduce the added permanganate.
Table 1. 5.6 M Sodium Average Salt Solution
|
Species |
Concentration |
|
Na+ |
5.6 M |
|
K+ |
0.015 M |
|
Cs+ |
0.00014 M |
|
OH- |
1.91 M |
|
NO3- |
2.14 M |
|
NO2- |
0.52 M |
|
AlO2- |
0.31 M |
|
CO32- |
0.16 M |
|
SO42- |
0.15 M |
|
Cl- |
0.025 M |
|
F- |
0.032 M |
|
PO43- |
0.01 M |
|
C2O42- |
0.004 M |
|
SiO32- |
0.004 M |
|
MoO42- |
0.0002 M |
|
Tri-n-butyl phosphate (TBP) |
0.5 mg/L |
|
Di-n-butyl phosphate (DBP) |
25 mg/L |
|
Mono-n-butyl phosphate (MBP) |
25 mg/L |
|
n-butanol |
2 mg/L |
|
Sodium Formate |
1.5 g/L |
Table 2. Additives to Produce Insoluble Solids
|
Sludge |
NaMnO4 |
H2O2 |
MnO2* |
TIS* |
|
0.031 wt % |
0.064 wt % |
0.00 M |
0.039 wt % |
0.070 wt % |
|
0.15 wt % |
0.31 wt % |
0.041 M |
0.19 wt % |
0.34 wt % |
|
0.67 wt % |
1.40 wt % |
0.369 M |
0.85 wt % |
1.52 wt % |
|
1.34 wt % |
2.8 wt % |
0.369M |
1.70 wt % |
3.04 wt % |
The filter tests used the following protocol. Personnel set the feed solution temperature to 35 ± 3 ˚C. They adjusted the axial velocity and transmembrane pressure to the values listed in Table 3 and backpulsed the filter before the start of each test point. At each test condition, the data acquisition system measured the filter flux every second and recorded the two-minute average. When five consecutive flux readings did not vary more than 5% personnel declared the flux at steady state. Once the filter flux reached steady-state, personnel recorded the two-minute averaged axial velocity, transmembrane pressure, and filtrate flow rate over a 60-minute period. They backpulsed the filter system and then adjusted to the next test condition. They allowed the filter to reach a new steady state.
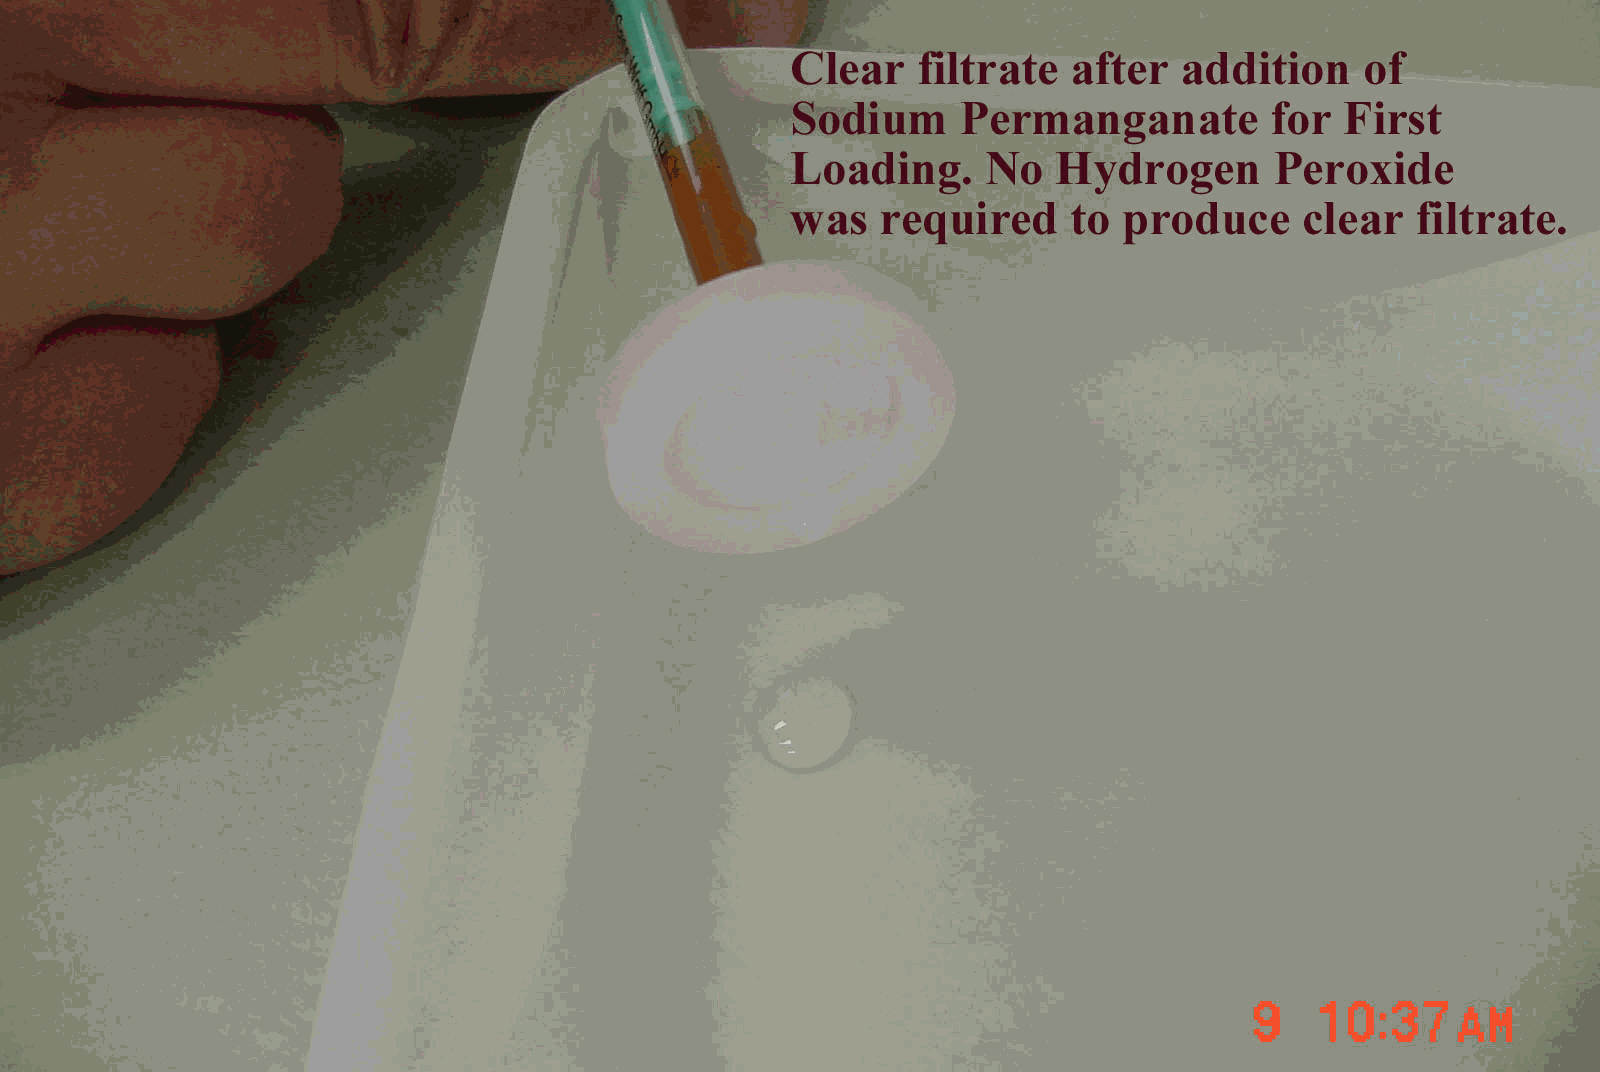
Figure 4. Filtrate Sample Following First Permanganate Addition
Table 3. Filter Test Conditions
|
Axial Velocity (ft/s) |
Transmembrane Pressure (psi) |
Test Sequence Number |
|
9 |
30 |
1 |
|
12 |
40 |
2 |
|
4 |
30 |
3 |
|
9 |
15 |
4 |
|
12 |
20 |
5 |
|
9 |
30 |
6 |
|
6 |
40 |
7 |
|
9 |
45 |
8 |
|
14 |
30 |
9 |
|
6 |
20 |
10 |
|
9 |
30 |
11 |
Following completion of these tests, personnel added more sludge to the feed tank to increase the sludge concentration to 0.15 wt %. They also added sodium permanganate to increase its cumulative added concentration to 0.31 wt %. They added 0.041 moles peroxide per liter of feed solution to reduce the permanganate. (The amount of hydrogen peroxide added equals the stoichiometric amount rather than 3X as used in previous tests.9) Personnel circulated the solution, sampled, and filtered. The filtrate became clear indicating complete reduction of the permanganate. They then backpulsed the filter before starting each test point. They set the axial velocities and transmembrane pressures to the values listed in Table 3. The temperature of the solution remained 35 ± 3˚C during chemical addition and filtration testing.
Following completion of this second set of tests, personnel added sludge to the feed tank to increase the sludge concentration to 0.67 wt %. They added sodium permanganate to reach a cumulative concentration of 1.40 wt % and added 0.185 moles peroxide per liter feed solution, or 1X stoichiometric, to reduce the permanganate. The collected filtrate sample appeared dark blue-green (see Figure 5). Personnel added another 0.185 moles peroxide per liter feed solution to reduce the permanganate. They circulated the solution, sampled, and filtered. The filtrate became clear indicating complete reduction of the permanganate. The total amount of hydrogen peroxide added equaled 2X the stoichiometric amount. Personnel then made the filter performance measurements at conditions listed in Table 3 following the same protocol used in the first two sets.
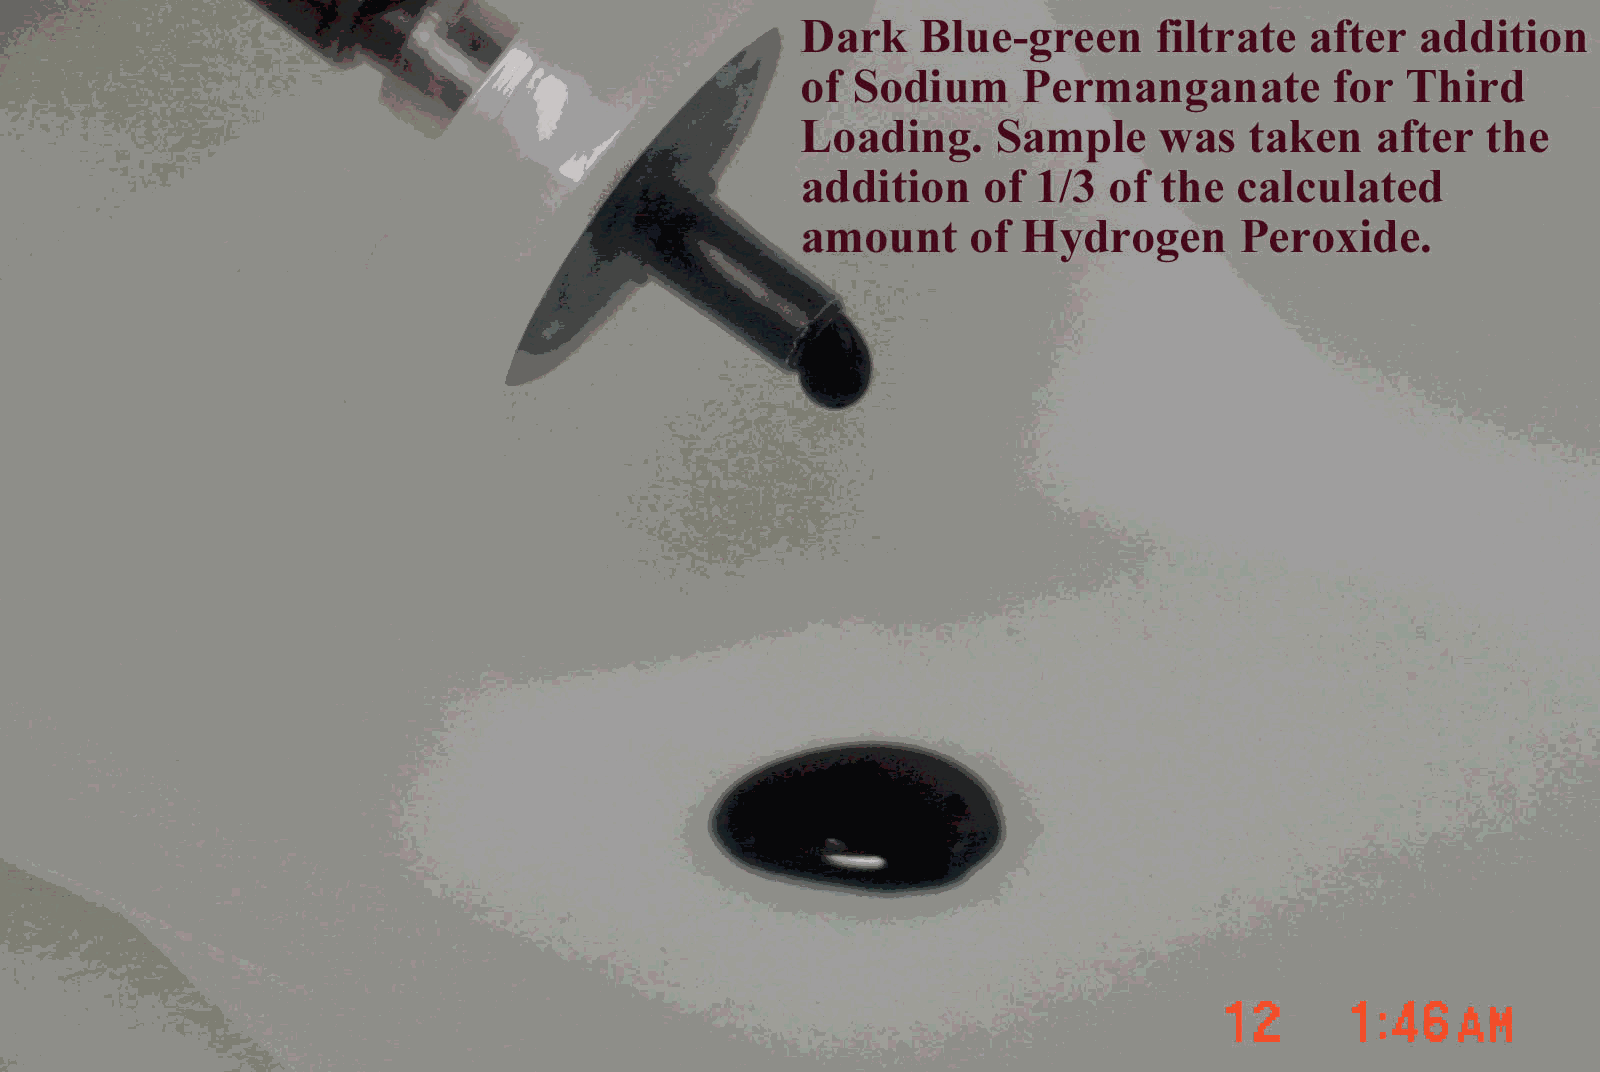
Figure 5. Filtrate Sample after First Hydrogen Peroxide Addition at Third Solids Loading
Following the third set of tests, personnel reduced the solution volume from 450 gallons to 225 gallons by filtering. This volume reduction increased the insoluble solids loading from 1.52 wt % to 3.04 wt %. They backpulsed the filter before starting each test point. They set the axial velocities and transmembrane pressures to the values listed in Table 3 maintaining the temperature of the solution at 35 ± 3˚C during these steps.
Results
Filter Flux
Table 4 shows the target and measured insoluble solids concentration measured during the test, as well as the insoluble solids concentrations measured during the 1998 and 2000 tests with MST.5 The 2000 test used much higher axial velocities (12 – 26 ft/s) than in the present test (4 – 14 ft/s). The 1998 test used the same axial velocity as the current test.
Table 4. Insoluble Solids Loading
|
Sludge and MST (2000)5 |
Sludge and MST (1998)4 |
Sludge and MnO2 |
||||
|
Target |
Actual |
Target |
Actual |
Target |
Actual |
|
|
1st Loading |
0.06 wt % |
0.0331 wt % |
0.04 wt % |
0.04 wt % |
0.070 wt % |
0.076 wt % |
|
2nd Loading |
0.28 wt % |
0.249 wt % |
0.20 wt % |
0.19 wt % |
0.34 wt % |
0.41 wt % |
|
3rd Loading |
1.29 wt % |
1.13 wt % |
N/A |
N/A |
1.52 wt % |
1.46 wt % |
|
4th Loading |
6.0 wt % |
4.19 wt % |
N/A |
N/A |
3.04 wt % |
2.66 wt % |
Figures 6 - 9 show the relationship between filtrate flux, and TMP during this test. The numbers next to the data from the current test show the sequence of the tests. We include the data from the 1998 and 2000 tests with sludge and MST for comparison.4,5 We also include data from the 2002 test with actual SRS waste and permanganate addition for comparison. This data comes from tests using the Cells Unit Filter (CUF). The letters next to these points indicate the sequence of the tests. The filter flux of feed solutions that included permanganate addition proves significant ly higher than the filter flux from MST-containing feeds. This finding agrees with results from filtration tests performed using simulated waste with the Parallel Rheology Experimental Filter (PREF).9 The plots also show good agreement between the current tests and the tests with actual waste. The improvement in filter flux from permanganate addition increases with increasing solids loading.
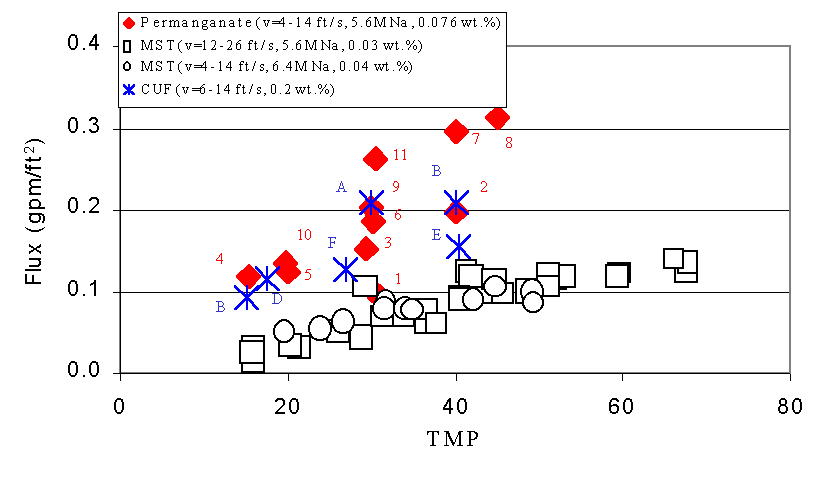
Figure 6. Flux versus Transmembrane Pressure (TMP) during Current
Test with
Slurry Containing Simulated Tank 40H Slurry Treated with Permanganate versus
Tests with Simulated Sludge and Monosodium Titanate (MST) and Actual
Waste Treated With Permanganate at 0.07 wt %
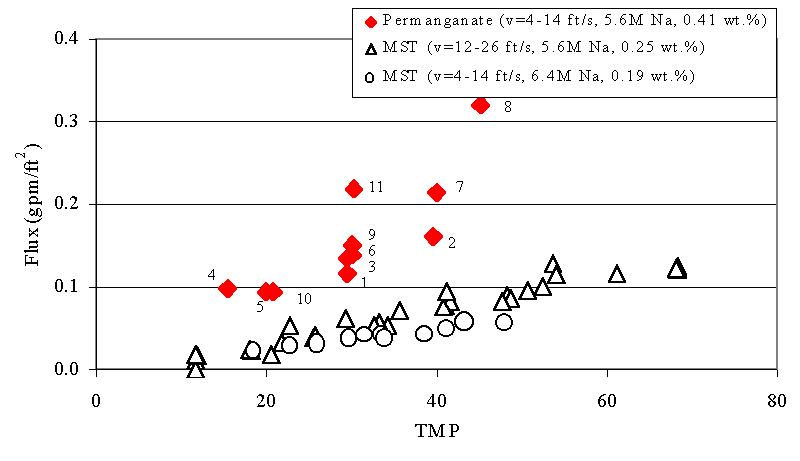
Figure 7. Flux versus Transmembrane Pressure (TMP) during Current
Test with
Slurry Containing Simulated Tank 40H Slurry Treated with Permanganate
versus Tests with Simulated Sludge and Monosodium Titanate (MST) at 0.34 wt
%
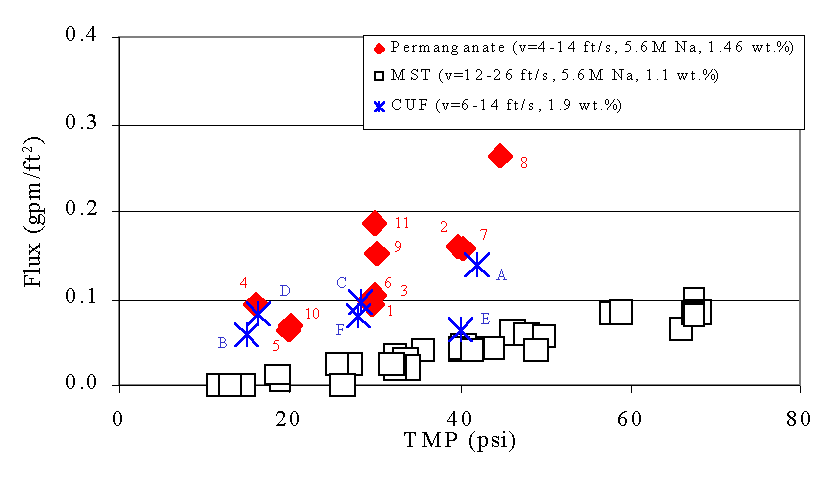
Figure 8. Flux versus Transmembrane Pressure (TMP) during Current
Test
with Slurry Containing Simulated Tank 40H Slurry Treated with Permanganate
versus Tests with Simulated Sludge and Monosodium Titanate (MST) and
Actual Waste Treated With Permanganate at 1.52 wt %
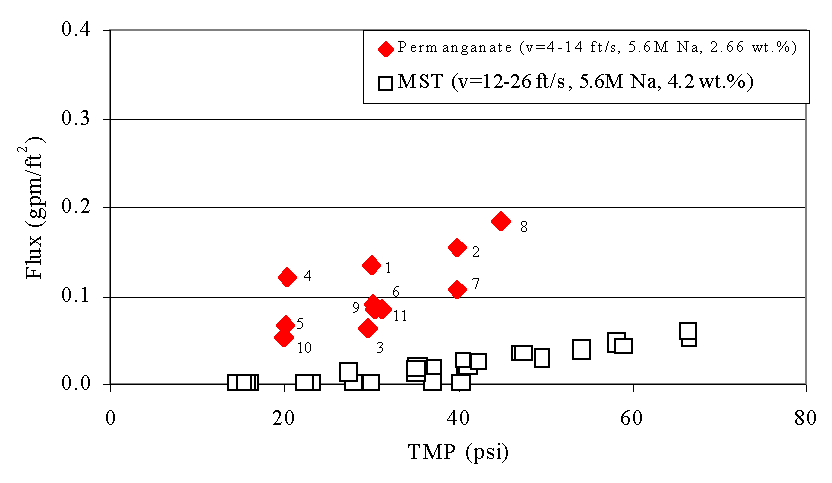
Figure 9. Flux versus Transmembrane Pressure (TMP) during Current
Test with
Slurry Containing Simulated Tank 40H Slurry Treated with Permanganate
versus Tests with Simulated Sludge and Monosodium Titanate (MST) at 3.04 wt
%
Note that as the duration of the filter operation increases in the current study the flux for a given TMP increases (e.g., compare 7 vs.2 and the sequence 1, 3, 6, 9, and 11). This behavior appears most pronounced for tests using lower concentrations of solids but largely persists through the entire demonstration. This behavior did not occur in the prior MST tests, or in the tests with actual waste and permanganate addition. Hence, the current data set does show a variance in performance time and previous operational history. Most likely, the variance with time also manifests itself in other changes in the properties of the solids. For instance, if the manganese particles experience Ostwald ripening over time, one might expect such temporal improvements in filtration. Similarly, if the particle size distribution narrows over time, filter cake packing may become more efficient resulting in similar improvement in filter performance with time. Analysis of the particle size data (see Preliminary Particle Size Data below) may provide some insight to the cause.
We performed statistic analyses of the data with the JMPâ software, and fit the data with a model describing filter flux as a function of axial velocity, transmembrane pressure and insoluble solids concentration (actually ln[concentration]). We also calculated variances for each of the parameters, as well as for the residual. The calculated variances equal 47% for transmembrane pressure, 23% for ln(concentration), 30% for residuals, and less than 1% for axial velocity. We used the variances to calculate F-ratios for each of the parameters. The F-ratio is the mean square of a parameter divided by the mean square of the residual.13 Given 40 degrees of freedom to calculate the residual and 1 degree of freedom to calculate the effect of each parameter, the critical F-ratio equals 4.08.13 If the calculated F-ratio for a parameter exceeds 4.08, the effect proves statistically significant. With a calculated F-ratio for a parameter less than 4.08, the effect does not prove statistically significant. Table 5 shows the results of the analysis. The filter flux has a statistically significant dependence on transmembrane pressure and insoluble solids concentration.
Table 5. Statistical Analysis of Data
|
Parameter |
Mean Square |
F-ratio |
|
Axial Velocity |
0.000763 |
0.51 |
|
TMP |
0.0923 |
62 |
|
ln(concentration) |
0.0458 |
31 |
|
Residual |
0.00149 |
Table 6 shows the average measured filter flux and filter permeance (i.e., flux/TMP) at each insoluble solids concentration during the permanganate filtration tests and previous tests in which the feed contained MST.4,5 The filter flux proves 2 – 4X higher with permanganate addition than with MST addition at similar solids content. The filter permeance proves 3 – 6X higher with permanganate addition than with MST addition at similar solids content.
Table 6. Average Filter Flux and Permeance
|
Permanganate Addition |
MST Addition5 |
MST Addition4 |
||||||
|
TIS (wt %) |
Flux (gpm/ft2) |
Permeance (gpm/ft2-psi) |
TIS (wt %) |
Flux (gpm/ft2) |
Permeance (gpm/ft2-psi) |
TIS (wt %) |
Flux (gpm/ft2) |
Permeance (gpm/ft2-psi) |
|
0.076 |
0.19 |
0.0063 |
0.03 |
0.086 |
0.0021 |
0.04 |
0.079 |
0.0022 |
|
0.41 |
0.16 |
0.0052 |
0.25 |
0.068 |
0.0017 |
0.19 |
0.041 |
0.0012 |
|
1.46 |
0.13 |
0.0043 |
1.13 |
0.040 |
0.0010 |
N/A |
N/A |
N/A |
|
2.66 |
0.10 |
0.0034 |
4.19 |
0.022 |
0.0006 |
N/A |
N/A |
N/A |
The 2000 filter tests used a higher axial velocity (12 – 26 ft/s) than the 1998 tests (4 – 14 ft/s) and the present tests (4 – 14 ft/s). Classical crossflow filtration theories predict filter flux to increase with increasing axial velocity.14,15,16 If the filtration tests with permanganate addition had been performed at a higher axial velocity, the filter flux may have increased.
Figure 10 compares data from this test with data from the 2001 permanganate filtration test performed with the PREF.8 The 2001 test involved continuous concentration of the feed from 0.09 wt % to approximately 6.0 wt %. The axial velocity equaled 6 ft/s, with a TMP of 34.5 psi. We used the data collected at 30 psi in this test for comparison. We used the data from the 2001 test to calculate the insoluble solids content as a function of time. Figure 10 displays the data from the current test at the time corresponding to the insoluble solids content in the 2001 test. At low concentrations, the filter flux in the engineering-scale test remains less than the flux in the smaller scale test. The discrepancy likely reflects the different process history of the filter in each test. In the current test, the data points at the lowest solids concentration came from ~ 20 hours of operation. In the PREF test, the data at the lowest concentration represent measurements immediately after startup. The data from the PREF filter experienced less cumulative fouling than the current test. At high concentrations, the filter fluxes for the two experiments prove comparable.
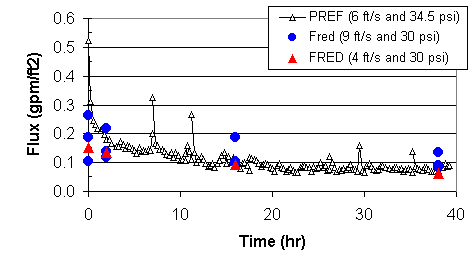
Figure 10. Comparison of filter flow data for comparable tests
using slurry containing
simulated sludge and permanganate using Filtration Research Engineering
Demonstration and Parallel Rheology Experimental Filter
Filtrate Quality
Personnel collected filtrate samples during each test and analyzed them for turbidity. Nine of the 51 samples had a measured turbidity greater than 5 NTU. A previous effort estimated that filtrate containing in excess of 5-10 NTU of sludge solids may exceed the process requirement for removing alpha-emitting radionuclides.11 The maximum measured turbidity equaled 83 NTU. The estimated insoluble solids concentration at 83 NTU equals 41.5 mg/L insoluble solids.12 Figure 11 shows pictures of the filtrate samples with highest solids turbidity.
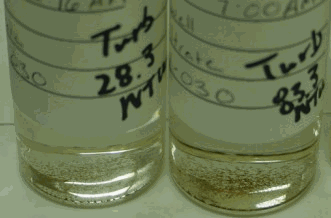
Figure 11. Filtrate Samples with High Turbidity
Table 7 shows the operating conditions (i.e., insoluble solids concentration, TMP, axial velocity, and time since the most recent backpulse) that correspond to the filtrate samples with turbidity greater than 5 NTU. We analyzed the data using the JMPâ software to determine if any correlation exists between the high filtrate turbidity and one of the operating parameters. Table 8 shows the results. The time since most recent backpulse contributes 28% of the variance. However, the residual contributes 57% of the variance. All other parameters contribute less than 2% of the variance. The F-ratio for the time since the most recent backpulse equals 1.45. Since one degree of freedom exists for the parameter and three degrees of freedom remain for the residual, the critical F-ratio equals 10.13. Since the F-ratio for the backpulse parameter remains less than 10.13, it does not prove statistically significant.
Table 7. Operating Condition when High Turbidity Filtrate Observed
|
Sample Turbidity (NTU) |
Conditions for Sample |
Time Since Most Recent Backpulse (min) |
Volume Averaged Mean Particle Size (micron) |
||
|
Slurry (wt %) |
TMP (psi) |
Axial Velocity (ft/s) |
|||
|
83.3 |
0.34 |
30 |
9 |
6 |
15 |
|
28.3 |
0.34 |
40 |
12 |
98 |
* |
|
23.7 |
1.53 |
30 |
9 |
6 |
* |
|
14.7 |
0.34 |
30 |
9 |
5 |
* |
|
10.2 |
0.34 |
40 |
6 |
83 |
* |
|
7.17 |
0.34 |
30 |
9 |
89 |
* |
|
6.94 |
0.34 |
30 |
14 |
86 |
* |
|
5.35 |
0.34 |
45 |
9 |
85 |
* |
|
5.01 |
2.56 |
30 |
9 |
10 |
* |
Table 8. Statistical Analysis of Filtrate Turbidity Data
|
Parameter |
Mean Square |
F-ratio |
|
Insoluble Solids Concentration |
16.6 |
0.02 |
|
TMP |
41.0 |
0.04 |
|
Axial Velocity |
81.9 |
0.09 |
|
Time Since Last Backpulse |
1384 |
1.45 |
|
Residual |
2855 |
During the test with a filtrate turbidity of 83.3 NTU described in Table 7, personnel collected and analyzed another filtrate sample for turbidity at the completion of the test (87 minutes after backpulsing). The turbidity of that sample equaled 4.68 NTU. If one assumes the turbidity decreases exponentially with time, one can estimate the filtrate turbidity can as a function of time. Equation [1] describes the filtrate turbidity for that test as a function of time.
Turbidity (NTU) = 103 exp[-0.0355 Time(min)] [1]
One determines the average turbidity by integrating and dividing by time. The estimated worst case average turbidity for one hour after the backpulse equals 43 NTU, much larger than the goal of 5 – 10 NTU. The estimated worst case average turbidity for 24 hours after the backpulse equals 2.0 NTU, less than the goal of 5 – 10 NTU.
Personnel measured the concentration of iron and manganese in the filtrate samples with the highest turbidity values. Table 9 shows the results, as well as the iron and manganese concentrations in the corresponding feed solutions and the estimated amount of plutonium that would sorb to the manganese solids passing through the filter.
Table 9. Iron and Manganese Concentration in High Turbidity Filtrate Samples
|
Turbidity (NTU) |
Fefiltrate (mg/L) |
Mnfiltrate (mg/L) |
Pufiltrate-calc |
Fefeed (mg/L) |
Mnfeed (mg/L) |
|
83.3 |
0.90 |
4.46 |
49.8 |
510 |
1513 |
|
28.3 |
0.30 |
1.76 |
19.7 |
510 |
1513 |
|
23.7 |
0.94 |
1.38 |
15.4 |
2278 |
6810 |
|
0.031 wt % sludge and 0.039 wt % MnO4 |
105 |
311 |
|||
According to previous analysis, the estimated sludge removal efficiency required to meet the Saltstone waste acceptance criteria equals 99.5%.11 If the feed solution contains 600 mg/L sludge and the sludge contains 27 wt % iron (solids basis), the filtrate needs to contain less than 0.82 mg/L iron. The maximum iron concentration measured 0.94 mg/L, slightly higher than the goal of 0.82 mg/L.
We estimate the amount of plutonium sorbed to the manganese solids passing through the filter by the following method. The plutonium sorption onto manganese solids measured by SRTC equals 20 mg Pu/0.2 g MnO2.18 If the plutonium comes from weapons grade waste, the radioactivity is 0.0706 Ci/g. Therefore, the estimated radioactivity for actual waste equals 11,200 nCi Pu per gram manganese. Using the measured manganese concentration in the filtrate, the authors estimated the amount of plutonium that would have passed through the filter (see Table 9). The Saltstone limit is 20 nCi alpha per gram feed. Some of the filtrate samples would have approached or exceeded the Saltstone limit for alpha activity.
One of the high turbidity samples contained sufficient solids to perform particle size analysis (see Table 7). The volume averaged mean particle size in that sample measured 15 m. This result appears very surprising given that the filter is a 0.5 m filter. According to Mott, a 0.5 m filter should reject 99.9% of particles greater than 2.2 m. A 0.5 m filter should not pass particles that are larger than 15 m. Since a time lag occurred between taking the filtrate samples and performing the particle size analysis, some particle agglomeration likely occurred.
The high turbidity measured in some of the filtrate samples contrasts with results from the PREF.9 One possibility is that the filter system at FRED has a small crack that allows some solid particles to pass at elevated pressures. Another possible cause is a flaw in the O-ring or the seal, despite efforts by the manufacturer to address this problem. As solids accumulate near the crack or O-ring, they may plug it and prevent other particles from passing through. When the system is backpulsed, these solid particles may move allowing other particles to pass through the filter. Another possible cause is that the filter as supplied by the vendor is not able to remove all of the particles in this feed stream. Since a 0.5 m Mott filter rejects 99.9% of particles greater than 2.2 m, it will pass some particles larger than 2.2 m. If enough of these particles passed through the filter, they would lead to the high turbidity observed. SRTC and USC are currently investigating the cause of solid particles passing through the filter.17
Preliminary Particle Size Data
Personnel collected particle measurements with a Focused Beam Reflectance Measurement (FBRM) probe (Lasentecâ ). The probe works in the following manner. Personnel installed the probe in the slurry-side piping of the filter loop between the feed pump and the filter. The laser beam projects through the window of the FBRM probe and focuses just outside the window surface. This focused beam follows a path around the circumference of the probe window. As particles pass by the window surface, the focused beam will intersect the edge of a particle. The particle will backscatter laser light. The particle will continue to backscatter the light until the focused beam reaches the opposite edge of the particle. The instrument collects the backscattered light and converts it into an electronic signal.
The FBRM isolates the time period of backscatter from one edge of an individual particle to its opposite edge. The time period multiplied by the scan speed is recorded as a chord length. A chord length is a straight line between any two points on the edge of a particle or particle structure (agglomerate). FBRM typically measures tens of thousands of chords per second, resulting in a robust number-by-chord-length distribution.
The chord-length distribution provides a means of tracking changes in both particle dimension and particle population. The calculations do not assume a particle shape. The chord-length distribution is essentially unique for any given particle size and shape distribution. Assuming the average particle shape remains constant over millions of particles, changes to the chord-length distribution reflect solely a function of the change in particle dimension and particle number.
Figures 12 – 14 show preliminary data collected from the FBRM. Figure 12 shows particle count data collected during solids addition and precipitation at the lowest total solids concentration (i.e., 0.07 wt %). The initial increase in particle counts corresponds to the addition of sludge. The increase in particle counts at approximately 190 minutes corresponds to the addition of sodium permanganate with concurrent reduction due to the formate or sludge.
Figure 13 shows particle count data collected during solids addition and precipitation at the second concentration (i.e., 0.34 wt % total solids). The initial increase in particle counts corresponds to the addition of sludge. The increase in particle counts at approximately 150 minutes corresponds to the addition of sodium permanganate. Apparently some permanganate reduced to form solids upon addition, possibly suggesting remaining formate in solution. The change in particle counts at approximately 250 minutes corresponds to the addition of hydrogen peroxide.
Figure 14 shows the particle size distribution (i.e., chord length distribution) during various parts of the testing. The particle size distribution at the end of the 1st solids loading, the 2nd solids loading, and the 4th solids loading appear approximately the same. The particle size distribution at the end of the 3rd solids loading proves somewhat different. The cause of this difference remains unknown. The particles in the sludge only feed have a slightly larger size than the particles in the permanganate-containing feeds.
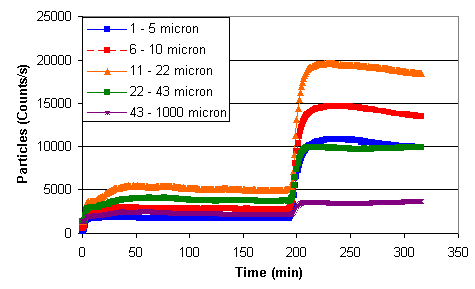
Figure 12. Particle Count during Solids Addition and Precipitation at 0.07 wt %
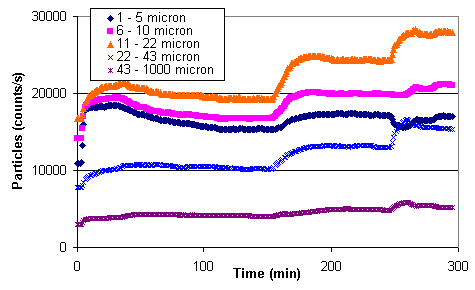
Figure 13. Particle Count during Solids Addition and Precipitation at 0.34 wt %
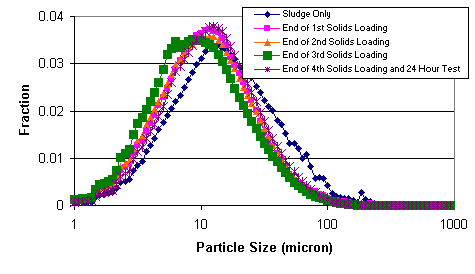
Figure 14. Chord Length Distribution during Filter Test
Conclusions
The key findings of the investigation follow.
Recommendations
The authors recommend that the following additional work.
References