WSRC-TR-2002-00168
Assay of Drums with Unknown Content Stored in 247-41F
Raymond A. Dewberry and Saleem R. Salaymeh
Westinghouse Savannah River Company
Aiken, SC 29808
Publication Date: June 12, 2002
Abstract
The Analytical Development Section of Savannah River Technology Center (SRTC) was requested by the Facilities Decontamination and Decommissioning Program (FDD) to determine the radionuclide content in two drums that were stored in an inactive warehouse of the Naval Fuels facility. The drums were labeled as containing fissile material and were placed in a critically safe arrangement, but it was not known whether they still contained the fissile material. Our g-PHA assay results indicate that the unknown highly enriched uranium (HEU) content of the two drums is one and 0.5 grams of surface contamination. Our neutron measurements confirmed that there are no significant lumps of 235U present in these drums and that only surface contamination is present. The results confirmed that the facility was in compliance with administrative controls for fissile materials and that it is safe to open the drums for visual inspection.
Keywords: Deactivation, NDA, Multichannel, Transmission, Segmented, AWCC
1. Introduction
In January 1981, the Schenectady Naval Reactor Office of the Department of Energy (DOE) requested that the Savannah River Operations (SR) Office consider construction and operation of a fuel material facility at DOEs Savannah River Plant, now referred to as the Savannah River Site. After appropriate scoping and preliminary estimating, the project was approved, and in June 1981 the DuPont Engineering Department began final design for the Fuel Manufacturing Facility. Construction of the facility began in September 1982, and the facility was operational in the mid 1980s.
The systems and equipment in this facility operated until a decision was made by DOE in September of 1989 to place the Naval Fuels Facility in "reserve" status. Reserve was defined as "an unmanned facility which is not an environmental liability". This transition to reserve status was accomplished by the implementation of a shutdown plan that directed work activities to reach this prescribed status. Monthly updates from November 1989 through August 1990 were given to DOE, SR-Office. The final plan update memorandum presented the state of the facility as it was turned over to F-Area operations for reduced Surveillance and Maintenance (S&M) of the following active systems: Heating, Ventilation, and Air Conditioning (HVAC) System; Instrument Air (IA) System, Emergency Diesel Generator, utilities, and selected monitoring systems.
The area was further deactivated per the "Naval Fuels Manufacturing Facility Deactivation Plan" in 1997 by shutting down the HVAC system, the Instrument Air system, the operating monitors, and the emergency diesel generator. Once these systems were shut down, the utilities to the buildings and systems in the area were isolated. These activities resulted in significant cost savings in yearly S&M activities. The facility is currently in this deactivated state.
As a result of the May 1997 explosion at the Hanford Plutonium Reclamation Facility, the Secretary of Energy directed that all "DOE field offices must reassess known vulnerabilities (chemical and radiological) at facilities that have been shut down, are in standby, are being deactivated, or have otherwise changed their conventional mode of operation". At the Savannah River Site (SRS), the Facilities Disposition Department (FDD, currently Facilities Decontamination and Decommissioning Program) developed a list of 130 Inactive Facilities and had the list verified by the respective facility custodians. A walkdown of each of these facilities was conducted to identify hazards and to ensure systems are in place to manage them.1 In addition to this, FDD implemented a Risk Ranking and Prioritization of Disposition Activities program at SRS. As a result of this program, hazards in inactive facilities were ranked to assist in prioritizing corrective actions to deal with ranked inactive facility hazards.2
One of these inactive facilities reviewed is the 247-41F warehouse. This building is approximately 20 x 50 located east of the main building. It was used to store shipping drums, packing materials, and equipment for 247-F operations.3 In this building, drums labeled calibration drums were found, two of which appear to have been placed in nuclear criticality spacing. It is not known whether the drums still contain the indicated material. One drum indicates on labeling "Fissile Unit/MT". It was determined that if the drums do contain fissile materials, improper handling could result in personnel injury. Not knowing what is in these drums could be a hazard potential that needs to be controlled. Thus the FDD requested the Analytical Development Section (ADS) of the Savannah River Technology Center (SRTC) to conduct a nondestructive assay to determine if these drums contained fissile materials and in what quantity.
This report discusses the methodology used for the assay of these two drums and presents the results of this investigation. We have conducted g-PHA assays of the two drums using a portable high purity germanium detection (HPGe) system.4 The g-ray measurements include views of three separate segments of each drum and include transmission corrections based on theoretical calculations. From these g-PHA measurements we were able to determine upper limits of content of one gram and 0.5 grams of 235U surface contamination in the two drums.
In addition to the g-PHA measurements that we describe in this report, we have conducted passive and active neutron acquisitions on these two drums. The neutron measurements were conducted to eliminate the possibility that chunks of HEU might be present in the two drums that would not be observable by the g-ray acquisitions. The passive and active neutron measurements both yielded null results, which indicates qualitatively that no chunks of HEU are present in either drum and that no criticality hazard exists from possible crosstalk between the two drums or between either of these drums and an external source of neutron activation.
We describe the instruments and measurements in the Experimental section, and we describe the limitations of the measurements in the Results and Discussion section. Our results demonstrate that no gross quantities of HEU surface contamination are present in either drum, and further indicate that no chunks of fissile material are likely to exist in either drum. However we recommend that both drums be opened so that the contents can be visually observed to confirm the assumptions we made in both of the techniques of analysis. Our results indicate there is little surface contamination or passive neutron activity that could cause a personnel radiation or contamination hazard.
2. Experimental
Two measurement systems were used for determining the HEU content in the two drums. The first is a portable gamma PHA system consisting of a HPGe detector and EG&G DartÔ system that contains the high voltage power supply and signal processing electronics. A personal computer with Gamma-Vision software was used to control the DartÔ MCA and to provide space to store and manipulate multiple 4096-channel g-ray spectra.4 A drum turntable was designed and used to rotate the drums during the measurements. Figure 1 shows a photograph of the system with one of the drums placed on the drum turntable. To conduct the measurements, the drums were moved to an isolated portion of warehouse 247-41F using a hand truck and were loaded onto the g-PHA turntable with good Behavior Based Safety practices. The isolated portion of the warehouse was selected based upon the posted placards and upon our familiarity with the facility Nuclear Criticality Safety Evaluation.5
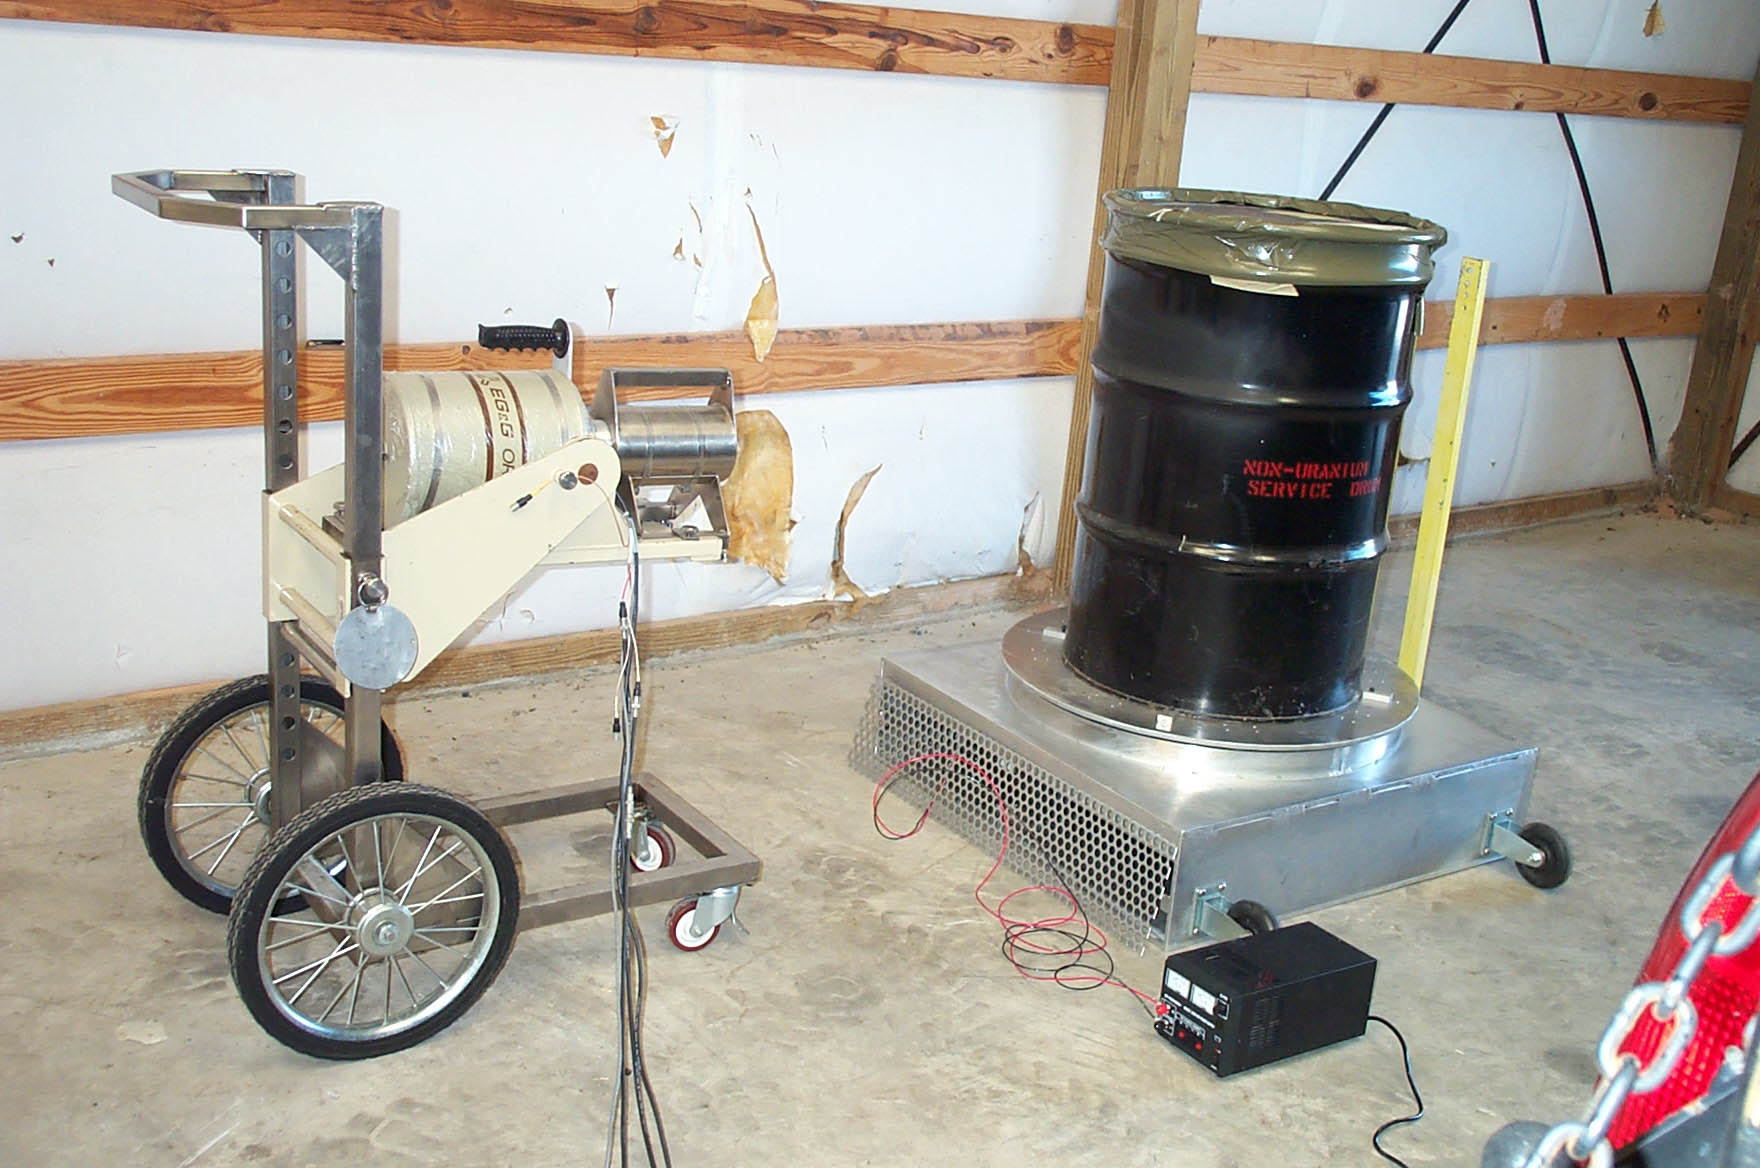
Figure 1. Photograph of the gamma PHA setup.
The second measurement system is an active well coincidence counter (AWCC). We used the AWCC in the passive mode to search for evidence of spontaneous fission or (a,n) neutron events and in the active mode with a 252Cf source placed on the top of the drums to search for induced fission events. Active well coincidence neutron counting is a well known technique for assay of 235U content in solid samples and has been described previously.6-8 The instrument used in the work described here is the extended cavity Aquila Technologies serial number KCC-51-DEV well counter. Details for this instrument are described in references 9 and 10. It contains an assembly of 42 3He-detector tubes mounted in two concentric circles in polyethylene moderator blocks. The neutron signals are summed using a PSR-B shift register coincidence counting circuit with the detector parameters shown in Table 1. The instrument was operated with the Los Alamos National Laboratory INCC 5.0 neutron coincidence software program.7 This program is used for set up, operation, data acquisition, and data analysis to relate detected coincidence events to 235U mass. Two neutron reflector sheets were placed around the drum and 252Cf to optimize the efficiency of the AWCC in this configuration.
Table 1. AWCC Detector parameters and timing characteristics used for this work.
|
Parameter |
Setting |
|
Gate width |
64.0 msec |
|
Predelay time |
4.5 msec |
|
High voltage |
1680 V |
|
Die-away time |
52.36 msec |
|
Efficiency |
0.25 |
|
Deadtime coefficient A |
0.893x10⁻⁶ |
|
Deadtime coefficient B |
0.201x10⁻¹² |
2.1 Gamma PHA
We obtained fourteen high-purity-germanium g-PHA spectra of the two drums in order to attempt to assay for 235U content in each. The spectra are listed in Table 2, where we tabulated the observed area under the 185 keV peak from 235U, the area under the 661 keV peak from 137Cs, and the area under the 1001 keV peak from 238U. The data of Table 2 are grouped into three sections. The top section contains data from the measurements of the drum we have designated as drum 1, the middle section contains data from the measurements on drum 2, and the third section contains data from the background spectra, the quality control (QC) spectra, and the transmission source spectra.
Spectrum Bg247 is shown in Figure 2. It is the background spectrum acquired in the 247-41F warehouse. Spectra qc225, Qc226, and Qc2262 are the QC check spectra acquired on the two assay dates on which we counted the drums. These three spectra were acquired from a 137Cs source in a fixed geometry in order to QC check our HPGe instrument, as prescribed in reference 11. Each of the three QC spectra passed the prescribed test limits. Figure 3 shows one of those QC spectra.
Spectrum Nusd1 and spectrum Nusd2 are the two spectra we acquired at a distance of 31 inches from the individual drums. Figure 4 shows the spectrum of Nusd1. The drums are cylindrical 205-L items with a radius of 11.5 inches. Thus the two measurements were obtained at a source to detector distance of 42.5 inches. Note in Table 2 that no measurable activity was observed in the 185 keV peak or in the 1001 keV peak of these two spectra. Thus no measurable 235U or 238U was observed in either drum by g-PHA assay. The remainder of this section is devoted to a determination of the absorption characteristics of each drum in order to set quantitative upper limits of HEU content on the two drums.
Figure 2. Background Spectrum Acquired in Building 247-41F.
Figure 3. QC Check Spectrum Acquired in Building 247-41F.
Figure 4. Nusd1 Spectrum Acquired in Building 247-41F.
Table 2. Gamma PHA Data acquired in 247-41F.
|
Spectrum Name |
Count Time (s) |
185 keV Area |
185 cps |
662 keV Area |
662 cps |
1001 keV Area |
|
Nusd1 |
1798.8 |
5± 10 |
0.008 |
67± 13 |
0.03725 |
-6± 11 |
|
NusdTtop |
300 |
4± 9 |
0.013 |
79± 12 |
0.2633 |
0± 5 |
|
NusdT1 |
299.78 |
-4± 8 |
-0.013 |
62± 12 |
0.2068 |
-4± 4 |
|
NusdTbottom |
299.76 |
9± 8 |
0.030 |
100± 12 |
0.3336 |
-5± 4 |
|
Nusd2 |
903.76 |
6± 8 |
0.0066 |
24± 9 |
0.02656 |
-7± 7 |
|
Nusd2Ttop |
299.72 |
13± 12 |
0.044 |
594± 26 |
1.982 |
4± 3 |
|
NusdT2 |
299.76 |
4± 13 |
0.013 |
251± 17 |
0.8373 |
-3± 4 |
|
Nusd2Tbottom |
299.76 |
22± 7 |
0.073 |
100± 12 |
0.3336 |
9± 3 |
|
Bg247 |
522.72 |
13± 26 |
2± 10 |
0.00383 |
13± 5 |
|
|
qc225 |
59.6 |
30± 25 |
2575± 53 |
43.20 |
-3± 3 |
|
|
Qc226 |
59.6 |
52± 22 |
2551± 54 |
42.80 |
2± 1 |
|
|
Qc2262 |
60.64 |
-1± 23 |
2715± 54 |
44.77 |
1± 1 |
|
|
T0 |
299.7 |
-5± 13 |
607± 27 |
2.025 |
-1± 3 |
|
|
T0bottom |
59.94 |
-7± 8 |
162± 12 |
2.703 |
-1± 3 |
The spectra labeled NusdTtop, NusdT1, NusdTbottom, Nusd2Ttop, NusdT2, and Nusd2Tbottom are transmission spectra obtained at the same sample to detector distances from the top, middle, and bottom segments of the two drums. We expect that the notation is evident to the reader. Spectrum NusdT1 is shown in Figure 5. The transmission spectra were obtained using a 1 mCi point source of 137Cs. The source was placed on a stand 56 inches from the detector and on the opposite side of the drum, so that the 661 keV photon had to shine through the drum in order to interact with the detector. For each transmission spectrum, the transmission source and detector were adjusted in height so that the 661 keV photons were passing selectively through the segment of the drum of interest. We then obtained a source-only T0 spectrum with the source to detector distance of 56 inches but with no drum. The measured data of each acquisition were then compared to the no-sample data to obtain an absorption characteristic of each segment.
Clearly it would have been preferential to measure the absorption characteristics using an actual source of 235U, since that would then represent exactly the transmission features of the 185 keV photon we wished to measure. Then our transmission characteristics could be calculated exactly as they are in the technique used to assay for 235U content in the high density drums obtained in the decontamination of Building 321-M.12 However, since the goal of the measurement on these two drums in 247-41F was to eliminate criticality concerns, bringing a source of 235U there would have been both very difficult and unwise. Further, since the two drums are very massive, it seemed likely that we might observe null transmission of the 185 keV photon from a 235U transmission source, thus yielding absolutely no information from the measurements.
Figure 5. NusdT1 Spectrum Acquired in Building 247-41F Using 137Cs Source.
Using the 137Cs source eliminated all of the problems of the preceding paragraph. The higher energy transition assured us that we would observe a measurable transmission in each acquisition. The negative benefit was that it became necessary to transform the absorption characteristics measured at 661 keV to the 235U energy of 185 keV. We describe that transformation below.
2.1.1 Gamma PHA Calculations
The absorption of the 661 keV photon by each segment was calculated in the traditional method by equation (1).8 We use the middle segment of drum 1 in our example.
![]()
= {0.2068 0.0372}/(2.0254) = 0.0837. (1)
This absorption is tabulated in column two of Table 3 for each of the six segments in the two drums. To transform the measured absorption to absorption of the 185 keV photon we determined an equivalent thickness (areal density) of iron through which the 661 keV photon was apparently passing. We chose iron because we reasoned the contents of the drum and the drum itself were composed of mostly steel. The areal density of iron was determined in Table 3 using equation (2) for each segment and using the mass attenuation coefficients of Table II.4 on page 648 of reference 13. We interpolated the mass attenuation coefficient from Table II.4 of reference 13 to be 0.0732 cm2/g for the 661 keV photon. The areal density is calculated for the example segment by
Absorption(NusdT1)661 = exp[(-0.0732)(density)]. Thus,
Density = ln[Absorption]/-0.0732
= ln[0.0837]/-0.0732 = 33.88 cm2/g. (2)
The calculated areal density for each segment is listed in column three of Table 3. We determine the absorption of the 185 keV photon by the calculated areal density of iron in column four using equation (3) and the 185 keV mass attenuation coefficient of 0.151 cm2/g.
Absorption(NusdT1)185 = exp[(-0.151)(33.88)] = 0.00600. (3)
In column four of Table 3 we have actually tabulated the absorption factor for the 185 keV photon, which is the reciprocal of equation (3). The mass attenuation coefficient of equation (3) was also interpolated from Table II.4 of reference 13.
In column five of Table 3 we have listed the transmission correction factor for the 235U g-ray. The correction factor is taken to be the square root of the absorption factor, because on average the 185 keV g-ray from a source inside the drum has to pass through only one drum radius instead of one drum diameter. In column six we have tabulated the corrected cps for the 185 keV photon, which is just the measured cps of Table 2 times the correction factor of column five of Table 3. From the corrected count rate we determine the 235U content using the point source configuration of equation (4).4
[235U](NusdT1) = 2.36x10⁻⁵(corrected cps)(d)2
= 2.36x10⁻⁵(-0.172)(42.5x2.54)2 = -0.047 g, (4)
where the first term in (4) is the point source calibration constant in units of g-sec/cm2, and d is the sample to detector distance in units of cm. We have tabulated the measured 235U content in each segment in column seven of Table 3.
Since all of the measured count rates in the 185 keV peak of all eight measurements have very large uncertainty (in our example the area was even negative), it is more reasonable to calculate an upper limit of content based on the uncertainty of the count rate of the 185 keV peak. This upper limit of content, or lower limit of detection (LLD), is determined in column nine from
[235U] = 2.36x10⁻⁵(corrected LLD of cps)(d)2
= 2.36x10⁻⁵(1.602)(42.5x2.54)2 = 0.462 g. (5)
The corrected LLD of cps comes from 4.65 times the uncertainty in the detection rate, which is shown in column three of Table 2.
Table 3. Gamma PHA Calculations for the two Unknown Drums.
|
Spectrum Name |
Abs |
Areal Density of Fe (g/cm2) |
185 KeV Abs Drum |
185 KeV Corr Factor |
Corred |
235U |
Corred LLD of cps |
235U |
235U |
|
Nusd1 |
10.52 |
0.029 |
0.008 |
0.272 |
0.078 |
||||
|
NusdTtop |
0.1116 |
29.95 |
92.11 |
9.60 |
0.128 |
0.037 |
1.339 |
0.386 |
|
|
NusdT1 |
0.0837 |
33.88 |
166.72 |
12.91 |
-0.172 |
-0.050 |
1.602 |
0.462 |
1.107 |
|
NusdTbottom |
0.1463 |
26.26 |
52.70 |
7.26 |
0.218 |
0.063 |
0.901 |
0.260 |
|
|
Nusd2 |
2.49 |
0.017 |
0.005 |
0.102 |
0.029 |
||||
|
Nusd2Ttop |
0.9654 |
0.48 |
1.08 |
1.04 |
0.045 |
0.013 |
0.193 |
0.056 |
|
|
NusdT2 |
0.4003 |
12.51 |
6.61 |
2.57 |
0.034 |
0.010 |
0.518 |
0.149 |
0.424 |
|
Nusd2Tbottom |
0.1516 |
25.77 |
48.99 |
7.00 |
0.514 |
0.148 |
0.760 |
0.219 |
Finally we obtain a summed LLD for the 235U content by adding the individual LLDs for each segment. Alternately we have an LLD for each drum that comes from the long count obtained assuming the entire drum is within view as a point source of activity. The summed, segment LLD for drum 1 is 1.1 g, while the measured LLD from spectrum Nusd1 is 0.08 g. The summed, segment LLD for drum 2 is 0.42 g, while the individual LLD from Nusd2 is 0.03 g. We have adopted the summed, segment LLDs as more realistic, since the assumption of a point source view in acquisitions Nusd1 and Nusd2 is difficult to justify. The efficiency for viewing the upper and lower segments is clearly not as good as that of the middle segment in those two acquisitions. This would tend to introduce a negative bias in the calculations for spectra Nusd1 and Nusd2.
We have tested an alternate method to estimate the 185 keV absorption factors based on the measured 661 keV absorption values. This method is based on the empirical equation from reference 14. The technique of that reference uses an empirical fit of measured 185 keV absorption values relative to a function of the measured 661 keV absorption factors. The technique was developed for measuring 235U content in 235-F Pu Fuel Fabrication waste cans. Using that technique doubles our limit of detection in drum 1 and triples our limit of detection in drum 2. We have not selected that technique in our calculations.
As a check on our method to estimate the areal density of the two drums, we were interested in estimating the mass of each drum that would be obtained from the areal densities that we calculated. The areal density was calculated assuming absorption of the 137Cs g-ray passing through an entire diameter of each drum. For drum 1 the average areal density is a fairly uniform 30 g/cm2. With a path length of 23 inches (one diameter) this yields an equivalent density of iron of 30g/58cm3. We determined that by visualizing a column of one cm2 area and 23 inches long. Thus this hypothetical column has a total volume of 58 cm3, and we have already determined an equivalent mass of 30 g.
The drum has a total volume of 205 liters, and thus a total estimated mass of (30/58)205000, or 106 kilograms. While we did not measure the total mass of the drum, we believe this is a very good estimation of its total mass. The 106 kg mass is in very good agreement with the masses of the high density drums of 313-M, with which we have a lot of experience.12 Using similar reasoning we calculate the total mass of the second drum to be about 48 kg. It is much lighter than drum one, and we again believe from our experience that this is a good estimate. We believe these two calculations of total mass represent a good independent check of the transmission correction factors we employ in this report.
2.2 Active Well Coincidence Counting
The g-PHA measurements obtained with the HPGe detection system were very valuable to obtain an upper limit of content for uniformly distributed 235U content. However, those measurements would not detect HEU in the form of chunks of material or that is specifically shielded by g-ray absorbing material. In order to eliminate the probability of a massive slug of HEU material in either drum, we conducted a sequence of neutron activation measurements.
Using the Aquila active well neutron coincidence counter (AWCC), we observed the neutron singles and doubles rates coming from each drum in Building 247-41F by both the passive and activated counting techniques. The use of neutron activation followed by counting the resulting fission neutrons is a widely accepted method to determine 235U content of solid samples that strongly absorb the 235U passive g-ray at 185 keV,8 and we have used the Aquila AWCC to determine total 235U content in multiple chemical forms and configurations.15
We have also used the AWCC in passive and active measurements to search for transuranic neutron producing species from sources external to the AWCC.16 We used the AWCC in a similar manner to search for any indication of a chunk of HEU in the two drums in 247-41F. But it was first necessary to demonstrate that the instrument would be sensitive to that type of measurement.
To demonstrate that we could use the AWCC to search for HEU external to it, we moved the AWCC to the 313-M loading dock and performed several experiments with it using a 252Cf activation source and using fourteen standards of HEU. Our proof of principle experiment is depicted in the photograph of Figure 6. The data of the proof of principle and instrument calibration are shown in Table 4.
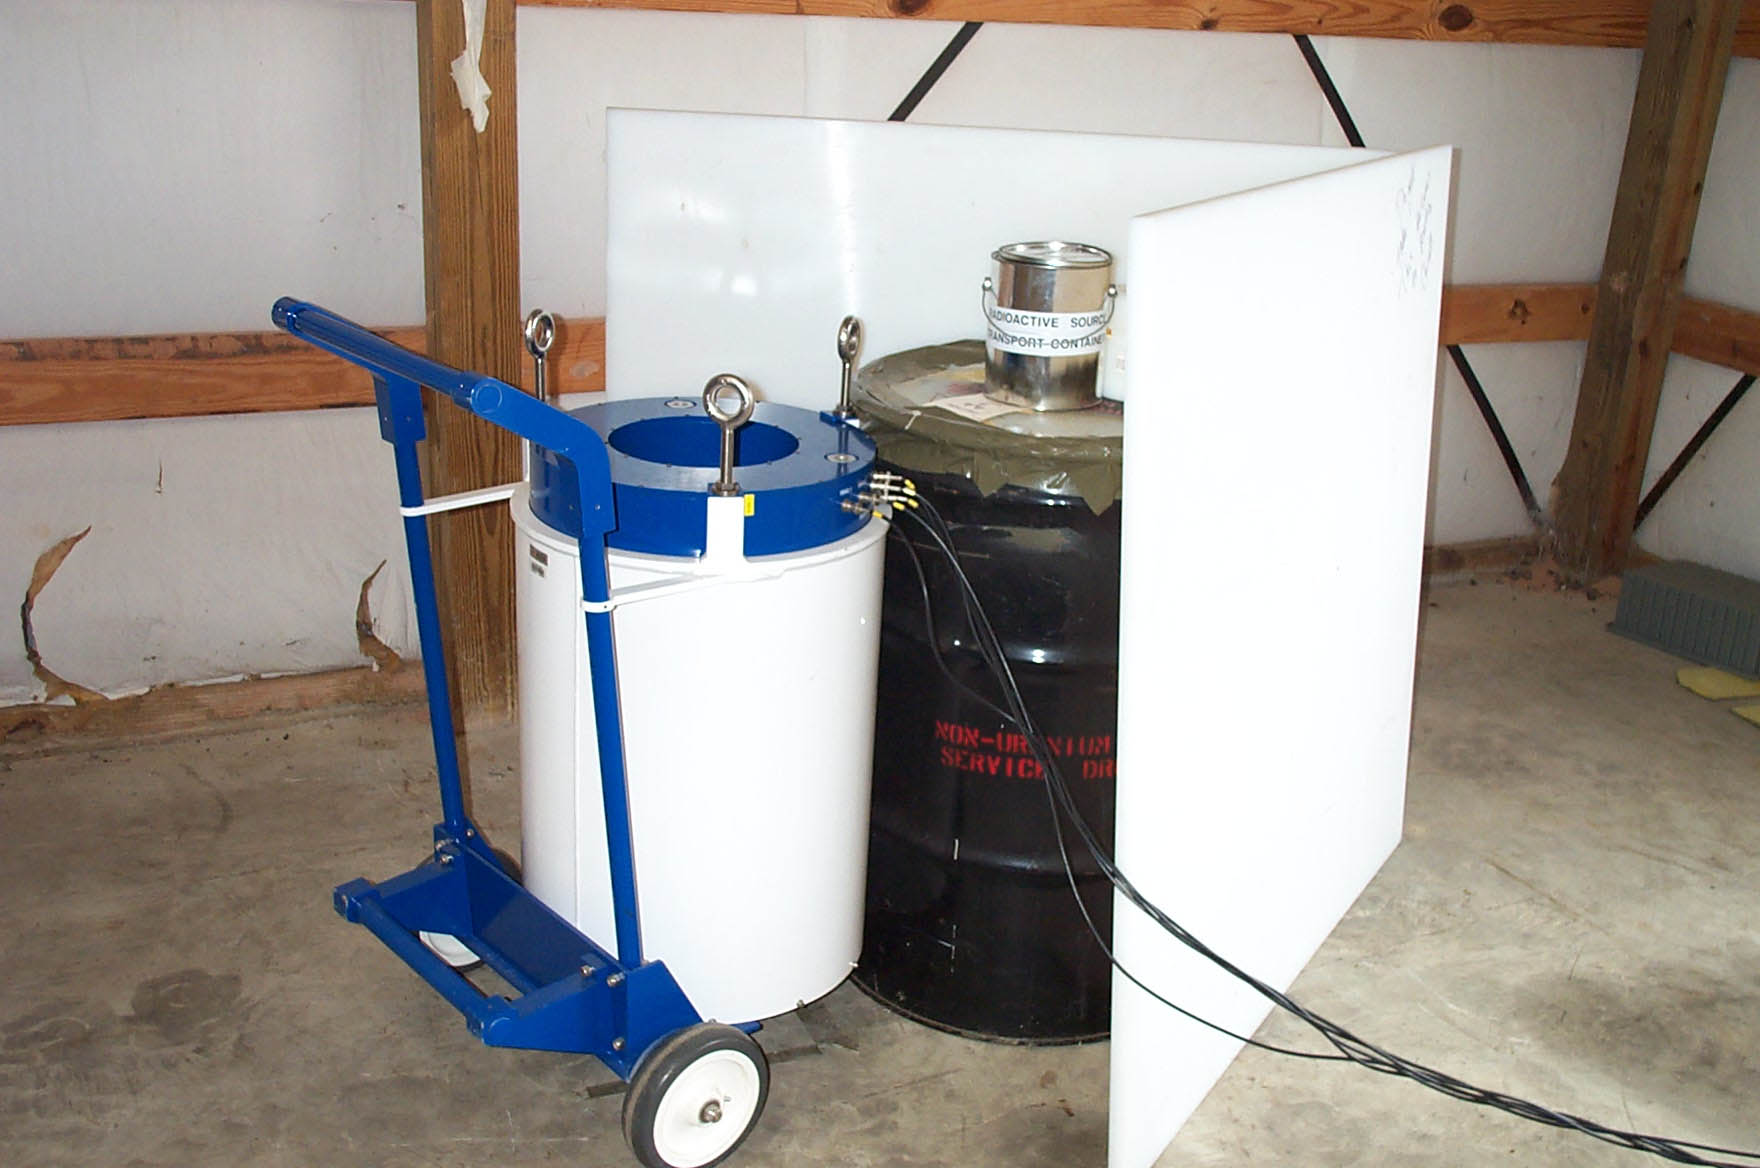
Figure 6. Photograph of the AWCC setup.
Table 4. AWCC Calibration Data.
|
File Name |
Item ID |
Comments |
Singles |
sigma singles |
Doubles |
sigma Doubles |
|
bkg cf in can.00 |
Background |
source backg 3/11 on top of drum |
354.12 |
1.22 |
1.28 |
0.27 |
|
cf in poly |
Background |
cf in poly |
450.81 |
1.38 |
1.8 |
0.35 |
|
cf in canno poly |
Background |
cf only no poly |
935.55 |
2 |
8.7 |
0.73 |
|
cf in canno poly |
Background |
cf only reflected |
980.13 |
2.05 |
9.52 |
0.76 |
|
q2active |
q2 source |
cf only no poly |
3.79 |
2.84 |
-0.39 |
1.03 |
|
300g u activated |
all u 300 g |
reflected activation |
110.6 |
2.99 |
4.07 |
1.15 |
|
allminus100 |
u 200 g |
reflected activation |
31.21 |
3.28 |
0.96 |
1.23 |
|
allbut150g |
uallbut150g |
reflected activation |
19.78 |
3.27 |
1.54 |
1.23 |
|
allbut200 |
uallbut200g |
reflected activation |
20.3 |
3.27 |
2.01 |
1.22 |
|
50gram |
app50g |
reflected activation |
24.74 |
3.27 |
-0.17 |
1.23 |
In the calibration experiment we obtained a passive neutron background with the AWCC placed next to an empty 55-gallon drum on the 313-M loading dock. The singles rate in the passive background was 165.21 cps, and the passive doubles rate was zero. We then placed a 0.0458 mg source of 252Cf on top of the drum and added two 1" x 4 x 4 high-density sheets of reflecting polyethylene to optimize the efficiency of the AWCC in this configuration. The polyethelene sheets and 252Cf source are shown in Figure 6. The measured passive rates with the source and reflectors were 980± 2 singles and 9.517± 0.763 doubles. The 252Cf source yields approximately 100,000 neutrons per second from spontaneous fission.17 We used these reflected neutrons to activate the 235U standards that we placed in the otherwise empty drum. Note the singles and doubles rates listed in columns four and six are with the source plus reflector backgrounds subtracted.
From the fourteen 235U standards we were able to successively assemble masses of 50-, 100-, 150-, 200-, and 300 g of 235U. Using the 252Cf source, these assembled masses were activated by 235U(n,fission), and the subsequent neutron singles and doubles rates were measured by the AWCC. The data are listed in Table 4. While the activated doubles rates are not conclusive, it is clear that the measured singles rates correlate with 235U mass in the range 150 g 300 g. Using this technique of neutron activation, we believe that our measurement system should be sensitive to HEU masses down to 150 g 235U.
We took the complete assembly and repeated the background, reflected source only, and sample measurements on the two drums in 247-41F. The data are tabulated in Table 5. The values for the two drums listed in columns four and six in Table 5 are with the reflected-source background subtracted. Note for each of the drums we observe negative singles and doubles rates even with activation by 252Cf. Our neutron activation experiments yield null results for the two drums. The activation source data were acquired very carefully after approaching the drum incrementally with the 252Cf activation source. With each increment of approach we obtained a short count to be certain the singles rate did not rise suddenly. Using this technique in accordance with our criticality training,18 we could be certain that the 252Cf source was not introducing a criticality event.
Table 5. 247-41F AWCC Data.
|
File Name |
Item ID |
Comments |
Singles |
sigma singles |
Doubles |
sigma Doubles |
|
BKG no source |
Reflected Background |
BKG in 247-41F no source |
5.12 |
0.18 |
0.031 |
0.014 |
|
Drum1 |
Passive |
Passive count BG subtracted |
-4.36 |
0.28 |
0.00 |
0.02 |
|
Drum2 |
Passive |
Passive count BG subtracted |
-4.59 |
0.28 |
0.00 |
0.02 |
|
BKG with source |
Reflected Background |
247-41F BKG cf source 3-13-02 |
1190.67 |
2.27 |
15.10 |
0.93 |
|
Drum 1 |
Drum 1 |
Drum 1 cf source on top 3-13-02 |
-253.22 |
4.21 |
-7.69 |
1.62 |
|
Drum 2 |
Drum 2 |
Drum 2 cf source on top 3-13-02 |
-118.22 |
4.35 |
-5.32 |
1.71 |
3. Results and Discussion
The g-ray measurements allow us to set limits of content of HEU based on the assumption that the activity comes from small particles of 235U that are not strongly self-absorbing. Our g-ray absorption calculations assume absorption by the sample matrix and not by the sample. This is a general assumption of all g-ray non-destructive assay measurements, which leads to the limitations listed immediately following.
- The system is optimized for the assay of small, evenly distributed quantities of gamma emitting radionuclides. The system will not be sensitive to chunks of HEU material.
- The system yields the most accurate results when measuring lightly packaged, hydrocarbon-type material such as paper, plastics, and cardboard.
- The 185 keV g-ray will not be detected through 1.5 inch of steel. Thus if one of the drums has 235U specifically shielded on all sides by heavy tools that form a thickness greater than about 1 inch of steel, our g-PHA assays would not be sensitive to it. (The average areal density of 30 g/cm2 that we calculated in four of the segments of these two drums is approximately equivalent to ¾ inch of steel including the outside of the drum.)
The AWCC measurements allowed us to qualitatively search for chunks of material. The AWCC is designed to use observed neutron coincidence rates to measure HEU content of samples that are placed inside the well of the instrument. For those samples it has a sensitivity of approximately 100 g.15 In this work we have utilized the instrument to count neutrons from samples that have been activated external to the instrument. This greatly reduces our detection efficiency, so that measuring coincidence events is not practical. We have attempted to measure neutron singles rates to search for evidence of activated 235U. This leads to the limitations listed immediately following.
- Neutron singles events are strongly influenced by the presence of chlorides and oxides that generate neutrons by (a,n) reactions. Observed singles rates are not good quantitative indicators of any neutron generating species.
- Neutron absorbers in the sample matrix can reduce the singles rates significantly.
- Neutron moderators in the sample matrix can influence the singles rates in either direction.
While the AWCC results we obtained do not allow us to set limits of HEU chunks inside the drums, we can at least state that we have negative qualitative evidence of any such chunks being inside the drums. The negative singles and doubles rates can be definitively attributed to moderation and absorption of the activation neutrons by the material in the two sample drums. That is, note that the passive background and reflected source rates with no samples were both non-zero. Only upon introduction of the drums did the singles and doubles rates go negative.
The AWCC counter is surrounded on the outside by a Cd shell that absorbs thermal neutrons. This design is intended to make certain that a sample inside the AWCC is activated only by neutrons from the internal activation sources. In this way external sources of neutrons would not interfere with the measurements of an internal sample. For our purposes the Cd liner added only a little value, but we were unable to remove it. In the case of our experiment, when the sample drums were brought close to the AWCC and 252Cf activation source, clearly material inside the drums served to moderate the activation source neutrons. These moderated thermal neutrons were then absorbed by the Cd liner and yielded negative singles and doubles rates upon subtraction of the background that included the 252Cf activation source.
4. Conclusion
Upon request from FDD we acquired g-PHA assay measurements and active neutron counts of two 55-gallon drums of material to determine their radionuclide content and to determine compliance with administrative controls for fissile materials. The two drums with unknown content were located in Building 247-41F. We have used g-PHA and active well neutron counting to characterize the contents of the drums. Our g-PHA assay results indicate that the HEU content of the two drums was one gram and 0.5 grams of surface contamination. Our active neutron measurements indicate that there were no significant lumps of 235U present in these drums and that only surface contamination is present. The results indicate that the facility was in compliance with administrative controls for fissile materials and that it is safe to open the drums for visual inspection.
Criticality safety requirements constrained the experimental work to be performed with a choice of transmission standards and activation standards that were not ideal for the nondestructive assay (NDA) techniques used. The use of a 137Cs transmission source required transformation of g-ray absorption characteristics between disparate energies. Additional obstacles involved use of remote electrical power, work in an isolated warehouse placed in a deactivated status, and transport of the AWCC and exempt Cf-252 between areas on site. We believe our solutions to the problems presented by these obstacles represent commendable demonstration of the Conduct of Operations approach.
The g-ray transmission correction values used for the 185 keV g-ray in this report were obtained by two distinct techniques. One technique was a theoretical calculation based on the assumption that the drums and their contents are predominantly iron and steel. The thickness of each drum segment was determined by measured transmission of the 661 keV g-ray from 137Cs. The other technique used an empirical determination of absorption of the 185 keV g-ray versus a function of the absorption of the 661 keV g-ray that we measured experimentally in this work. Both techniques yielded results that were in fairly good agreement. We checked the theoretical calculation technique using an independent measure of overall drum density.
The active well neutron measurements represent a unique and creative use of the commercial Aquila well counter paired with an external activation source. We believe Salaymehs novel approach demonstrates a significant contribution to the NDA community that will be a useful tool in future holdup assays in process equipment.
5. Acknowledgements
The authors would like to thank Jerry McCarty for the many discussions and for taking the lead role in constructing the g-PHA turntable. The authors would like to extend their thanks to Gary Rose for scheduling and providing the operations support that made it possible for us to conduct this work.
6. References
- G. R. Rose, et al, "Risk Identification Report for Inactive Facilities in F-Area", WSRC-RP-2001-00399, April 2001.
- Risk Ranking and Prioritization of Disposition Activities, Westinghouse Savannah River Company, Procedure Manual 1C, Procedure 103, January 2001.
- Safety Analysis Report: Naval Fuel Material Facility 200-F Area, Savannah River Plant, DPSTSA-200-16, Volume 1, August 1985.
- S. R. Salaymeh and R. A. Dewberry, "Efficiency Calibration of the Portable High Purity Germanium Detection System for use in the M-Area Deactivation Assays", WSRC-TR-2000-00317, September 2000.
- 5. N-NCS-F-00007, "Nuclear Criticality Safety Evaluation: 247-F NIM Removal", August, 1996.
- M-S. Lu, T. Teichman, R. N. Ceo, and L. L. Collins, Nuclear Inst. and Methods, A313;471(1992).
- B. Harker and M. Krick, INCC 5.0 software, USDOE Office of Safeguards and Security, (1997).
- D. Reilly, N. Ensslin, H. Smith, and S. Kreiner, ed., Passive Nondestructive Assay of Nuclear Materials, (National Technical Information Service, Springfield, VA, 1991)
- M. G. Cowgill and M-S. Lu, "Testing and Calibration of the BNL Aquila Active Well Coincidence Counter", Department of Advanced Technology report SSN 97-26, June 1997.
- M-S. Lu, T. Teichman, R. N. Ceo, and L. L. Collins, J. Nuclear Materials Management, April 1994, 32.
- R. A. Dewberry and S. R. Salaymeh to Danny Smith, "Method Development Report For Use of the Portable Hpge Detection System For Assay Of Highly Enriched Uranium", SRT-ADS-2001-0388, September 2001.
- S R. Salaymeh and R A. Dewberry, "Adapting The CANBERRA Q2 to Assay High-Density Solid Waste from 321-M", WSRC-TR-2001-00004, January 2001.
- John R. LaMarsh, Introduction to Nuclear Engineering, Addison-Wesley, Reading MA., 1983 (Table II-4).
- R. A. Dewberry and J. C. George, "Experimental Development Work for PuFF Facility SNM g-PHA Waste Assay Instrument", WSRC-RP-89-621, October 1989.
- R. A. Dewberry and S. R. Salaymeh, "Efficiency Calibration and Testing of a Commercial Active Well Coincidence Neutron Counter to Inventory U-Al Reactor Fuel and Target Elements at the Savannah River Site", WSRC-MS-2001-00914, July 2001.
- S. R. Salaymeh and R A. Dewberry, "Characterization of Legacy Materials at SRS Using a HPGe Detector and an AWCC", WSRC-MS-2001-00109, July 2001.
- Certificate of Calibration IPL 680-44, Isotope Products Laboratories, September 1999.
- T. P. McLaughlin, "Los Alamos National Laboratory 5-Day Nuclear Criticality Safety Training Program", May 1989.