WSRC-TR-2001-00611
Results of the Tank 40H Sludge Batch 2 Final Wash
(Post-Decant)
Sample HTF-E-133
R. F. Swingle, II
Westinghouse Savannah River Company
Aiken, SC 29808
This report was prepared as an account of work sponsored by an agency of the United States Government. Neither the United States Government nor any agency thereof, nor any of their employees, makes any warranty, express or implied, or assumes any legal liability or responsibility for the accuracy, completeness, or usefulness of any information, apparatus, product or process disclosed, or represents that its use would not infringe privately owned rights. Reference herein to any specific commercial product, process or service by trade name, trademark, manufacturer, or otherwise does not necessarily constitute or imply its endorsement, recommendation, or favoring by the United States Government or any agency thereof. The views and opinions of authors expressed herein do not necessarily state or reflect those of the United States Government or any agency thereof.
This report has been reproduced directly from the best available copy.
Available for sale to the public, in paper, from: U.S. Department of Commerce, National Technical Information Service, 5285 Port Royal Road, Springfield, VA 22161, phone: (800) 553-6847, fax: (703) 605-6900, email: orders@ntis.fedworld.gov online ordering: http://www.ntis.gov/support/index.html
Available electronically at http://www.osti.gov/bridge
Available for a processing fee to U.S. Department
of Energy and its contractors, in paper, from: U.S. Department of Energy, Office
of Scientific and Technical Information, P.O. Box 62, Oak Ridge, TN 37831-0062,
phone: (865 ) 576-8401, fax: (865) 576-5728, email: reports@adonis.osti.gov
Summary
Results from Sample HTF-E-133 pulled from Tank 40H after the fifth wash (post-decant) indicate that the supernate sodium concentration is 0.53 M versus a goal concentration of 0.50 M. This sodium concentration is also below the 0.56 M Na+ supernate concentration obtained in the Savannah River Technology Center’s (SRTC) wash of the Sludge Batch 2 qualification sample. This assures that the product slurry is within the bounds SRTC used in qualifying Sludge Batch 2.
Weight percent solids and density results are also presented herein. This will allow verification that the solids fraction is within the acceptable range for Defense Waste Processing Facility (DWPF) productivity and for transfer of the slurry to the DWPF.
Keywords: Tank Farm, ESP, DWPF
Introduction
The washing of Sludge Batch 2 (Macro Batch 3) has been completed and the slurry is ready for transfer to the Defense Waste Processing Facility (DWPF) for immobilization in glass. Sludge Batch 2 is a blend of sludge slurries from Tanks 8F and 40H. To qualify the batch for transfer to DWPF, samples of the sludge slurry were analyzed at various stages to verify that washing is proceeding as desired. Final samples were analyzed after washing was completed to verify that washed sludge is within parameters to allow safe processing in the DWPF and to produce acceptable glass. A Technical Task Request and a Task Technical and Quality Assurance (QA) Plan have been issued to cover these analyses.1,2 The results of the analyses of the post-decant fifth wash sample are included herein.
Discussion
Experimental
A sample of sludge slurry was pulled from Tank 40H in December 2001 after addition of the inhibited water for the fifth wash of Sludge Batch 2 and final decant. The sample was transported to SRTC on December 6, 2001.
After placing the sample into the Shielded Cells, a portion of the sample was filtered to produce a clear supernate. A portion of the supernate was diluted to allow removal from the Cells for analysis. This analysis was completed using Inductively Coupled Plasma – Emission Spectrometry (ICP-ES).
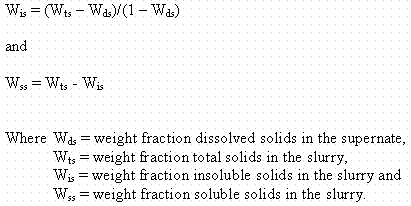
Weight percent solids measurements and density measurements were conducted on the remaining slurry and supernate. The weight percent total solids in the slurry and the weight percent dissolved solids in the supernate were measured directly by placing a measured quantity (by weight) of sample into a beaker and drying it in an oven at ~115 ° C to a constant weight. The insoluble solids and soluble solids were calculated from the total solids and dissolved solids using the following equations.

The density was measured by filling a volumetrically calibrated vessel with sample and weighing.
Results and Discussion
The results of the analyses are given in Table 1. All direct results given are the average of three determinations. The one-sigma standard deviation is also given. Values for the weight percent insoluble solids and the weight percent soluble solids in the slurry are calculated from the average values from the weight percent total solids in the slurry and the weight percent dissolved solids in the supernate. No standard deviation values are given for calculated results.
The supernate sodium result is consistent with the goal for the final supernate concentration for Sludge Batch 2 and with the result of the previous sample taken before the final decant.3 The weight percent solids and density results checked against goals designed to maximize DWPF productivity and ensure the transferability of the slurry to DWPF. The density measurement for the slurry is slightly higher than measured for Sample HTF-E-126, as would be expected. The density measurement for the supernate is very close to that for HTF-E-126, also as would be expected. The weight fraction dissolved solids in the supernate is similar to that measured in the previous sample. The weight fraction total solids and insoluble solids has increased as expected.
Table 1. Results of Analyses of Tank 40H Sample HTF-E-133
|
Analysis |
Average Value |
1-Sigma Standard Deviation |
|
Na (M) |
0.534 |
0.005 |
|
Density of Slurry (g/mL) |
1.12 |
0.03 |
|
Density of Supernate (g/mL) |
1.03 |
0.01 |
|
Weight Fraction Total Solids in Slurry (%) |
20.5 |
0.02 |
|
Weight Fraction Dissolved Solids in Supernate (%) |
3.10 |
0.09 |
|
Weight Fraction Insoluble Solids in Slurry (%) |
17.9 |
-
|
|
Weight Fraction Soluble Solids in Slurry (%) |
2.55 |
- |
Results of the analyses described in this report are documented in WSRC-NB-2000-00201.
References