WSRC-TR-2001-00554
Impact of Strontium Nitrate and Sodium Permanganate Addition
on Solid-Liquid Separation of SRS High Level Waste
M. R. Poirier, T. M. Jones, and S. D. Fink
Westinghouse Savannah River Site
Aiken, SC 29808
This report was prepared as an account of work sponsored by an agency of the United States Government. Neither the United States Government nor any agency thereof, nor any of their employees, makes any warranty, express or implied, or assumes any legal liability or responsibility for the accuracy, completeness, or usefulness of any information, apparatus, product or process disclosed, or represents that its use would not infringe privately owned rights. Reference herein to any specific commercial product, process or service by trade name, trademark, manufacturer, or otherwise does not necessarily constitute or imply its endorsement, recommendation, or favoring by the United States Government or any agency thereof. The views and opinions of authors expressed herein do not necessarily state or reflect those of the United States Government or any agency thereof.
This report has been reproduced directly from the best available copy.
Available for sale to the public, in paper, from: U.S. Department of Commerce, National Technical Information Service, 5285 Port Royal Road, Springfield, VA 22161, phone: (800) 553-6847, fax: (703) 605-6900, email: orders@ntis.fedworld.gov online ordering: http://www.ntis.gov/support/index.html
Available electronically at http://www.osti.gov/bridge
Available for a processing fee to U.S. Department of Energy and its contractors, in paper, from: U.S. Department of Energy, Office of Scientific and Technical Information, P.O. Box 62, Oak Ridge, TN 37831-0062, phone: (865 ) 576-8401, fax: (865) 576-5728, email: reports@adonis.osti.gov
Summary
As a pretreatment step for the caustic side solvent extraction (CSSX) flowsheet, the process contacts the incoming salt solution containing entrained sludge with monosodium titanate (MST) to adsorb strontium and actinides. An operation filters the resulting slurry to remove the sludge and MST. Previous work for the River Protection Program at Hanford suggests that addition of strontium nitrate and sodium permanganate for strontium and actinide removal, rather than MST, improves the filtration rate for comparable waste streams.
The authors performed crossflow filtration tests using a 0.5 m pore size Mott crossflow filter. The feed for the tests included combinations of simulated SRS High Level Waste average supernate, simulated SRS High Level Waste Tank 40H sludge, MST, strontium nitrate, and sodium permanganate. The initial sludge loading equaled 0.6 g/L. Personnel added MST (0.55 g/L), strontium nitrate (0.01 M), or sodium permanganate (0.01 M) to the feed. The filtration concentrated the insoluble solids approximately 50-fold.
The results of this work as compared to the reference MST process are as follows.
Keywords: filtration, Alt Salt, solid-liquid separation, sludge
Introduction
The Department of Energy selected caustic side solvent extraction (CSSX) as a preferred cesium removal technology for Savannah River Site waste.
As a pretreatment step for the CSSX flowsheet, the process contacts incoming salt solution containing entrained sludge with monosodium titanate (MST) to adsorb strontium and plutonium. An operation filters the resulting slurry to remove the sludge and MST. The filtrate receives subsequent treatment through the solvent extraction system to remove cesium. Testing performed by SRTC and the University of South Carolina with simulated waste showed filtration rates of 0.03 – 0.08 gpm/ft2.1,2,3 Testing to design the Hanford Waste Treatment Plant showed that addition of strontium nitrate and sodium permanganate improved filtration rates for their waste.4,5 The strontium nitrate removes radioactive strontium (Sr-90) by isotopic dilution. The sodium permanganate precipitates as manganese dioxide and removes actinides, presumably by co-precipitation. Because of this result, DOE-SR requested SRTC to conduct crossflow filter tests with strontium and permanganate addition rather than MST.6
Experiments
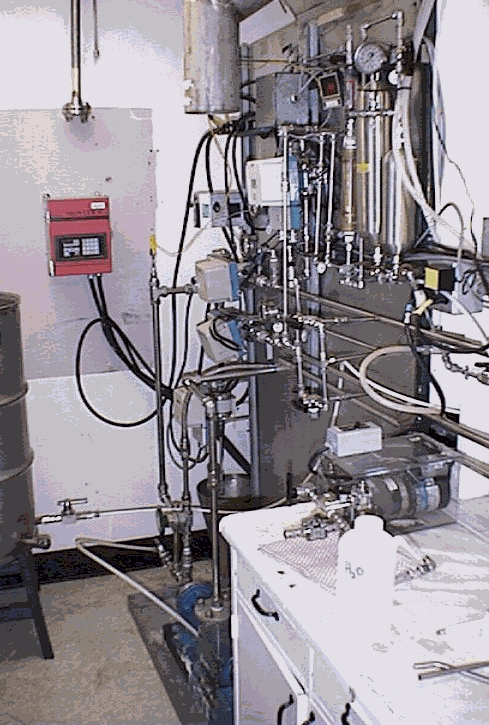
Personnel conducted crossflow filtration tests using a 0.5 m pore size, 1/2" ID Mott crossflow filter at TNX. Figure 1 shows this filter, referred to as the Parallel Rheology Experimental Filter (PREF). The feed for the tests included combinations of simulated SRS High Level Waste average supernate (5.6 M sodium), simulated SRS High Level Waste Tank 40H sludge, and MST or strontium nitrate and sodium permanganate. Personnel targeted an initial insoluble solids concentration of 1.15 g/L (approximately 0.09 wt %) for the baseline sludge/MST feed. For the permanganate tests, researchers maintained the sludge concentration at the baseline flowsheet value (0.6 g/L). Personnel concentrated the insoluble solids approximately 50:1. The axial velocity and transmembrane pressure matched values used in the 1999 testing with the PREF.1,2

Figure 1. Experimental Crossflow Filter Unit
Table 1 shows the composition of the feed solution for these tests. One test added simulated sludge, Sr(NO3)2, and NaMnO4. A second test combined simulated sludge and NaMnO4, but without Sr(NO3)2. A third test examined the addition of simulated sludge and MST for comparison.
Personnel prepared approximately 100 gallons of each feed solution. They added approximately 5 gallons of feed to the PREF feed tank. Operators started the filter feed pump and the feed solution circulated with an axial velocity of 6 ft/s and a transmembrane pressure of approxim-ately 30 psi. These conditions match those from the 1999 test.1,2 Personnel periodically back-pulsed the filter (6 – 8 times per day during the tests with MST and 1 – 3 times per day in the tests with strontium nitrate and sodium permanganate). Testing removed the filtrate and the concentrate recycled to the filter feed tank. Personnel added additional feed solution to the filter feed tank to replace the material removed.
Table 1. Feed Composition
|
Component |
Test 1 |
Test 2 |
Test 3 |
|
OH |
1.91 M |
1.91 M |
1.91 M |
|
NO3 |
2.14 M |
2.14 M |
2.14 M |
|
NO2 |
0.52 M |
0.52 M |
0.52 M |
|
AlO2 |
0.31 M |
0.31 M |
0.31 M |
|
CO3 |
0.16 M |
0.16 M |
0.16 M |
|
SO4 |
0.15 M |
0.15 M |
0.15 M |
|
Cl |
0.025 M |
0.025 M |
0.025 M |
|
F |
0.032 M |
0.032 M |
0.032 M |
|
PO4 |
0.01 M |
0.01 M |
0.01 M |
|
C2O4 |
0.004 M |
0.004 M |
0.004 M |
|
SiO3 |
0.004 M |
0.004 M |
0.004 M |
|
MoO4 |
0.0002 M |
0.0002 M |
0.0002 M |
|
Na |
5.6 M |
5.6 M |
5.6 M |
|
K |
0.015 M |
0.015 M |
0.015 M |
|
Cs |
0.00014 M |
0.00014 M |
0.00014 M |
|
tri-n-butyl phosphate |
0.5 mg/L |
0.5 mg/L |
0.5 mg/L |
|
di-n-butyl phosphate |
25 mg/L |
25 mg/L |
25 mg/L |
|
mono-n-butyl phosphate |
25 mg/L |
25 mg/L |
25 mg/L |
|
n-butanol |
2 mg/L |
2 mg/L |
2 mg/L |
|
Formate |
1500 mg/L |
0.045 M |
0.045 M |
|
Sr(NO3)2 |
- |
0.01 M |
- |
|
NaMnO4 |
- |
0.01 M |
0.01 M |
|
MST |
0.55 g/L |
- |
- |
|
Tank 40H Simulated Sludge |
0.6 g/L |
0.6 g/L |
0.6 g/L |
Personnel collected filtrate samples during each test and analyzed the samples for turbidity. The turbidity, or cloudiness of the solution, is commonly used for comparison purposes. We used an Orbeco-Hellige Model 965-10A turbidity meter to evaluate the turbidity of the filtrate samples. This turbidity meter shines visible light through the side of a cylindrical sample vial and detects the light scattered through the side of the vial 90° from the source. The turbidity, measured in nephelometric turbidity units (NTU), provides a quantitative comparison tool between samples with different amounts of solids.7 The turbidity correlates with the solids content for a given solution composition, but the correlation degrades when large amounts of solids cause the solution to become opaque.
Following the filtration tests, personnel cleaned the filters to compare any differences in ease of cleaning between the different feed solutions. Cleaning occurred by draining the filter system, circulating several batches of 0.02 wt % oxalic acid, and circulating several batches of 0.01 M sodium hydroxide. During the cleaning process, personnel measured the filter throughput as a function of TMP to evaluate cleaning effectiveness.
Results
Filter Flux
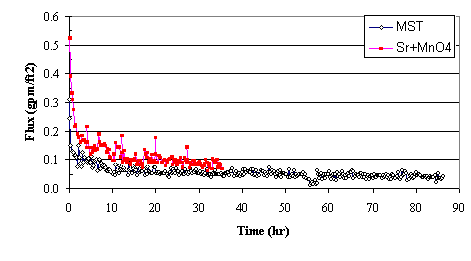
Figure 2 shows the filter flux as a function of time during the baseline test (with sludge and MST) and during the test with strontium and permanganate addition. During the baseline test with MST, the slurry required 86 hours to concentrate the insoluble solids 50X. The average flux equaled 0.059 gpm/ft2 and the average flux over the last 8 hours equaled 0.043 gpm/ft2. Given that the initial feed solution contained 0.09 wt % insoluble solids and operations concentrated the slurry 50:1, the calculated solids loading at the end of the test equaled 4.5 wt %.

Figure 2. Comparing Filter Flux from MST Addition to Filter
Flux from Strontium
Nitrate and Sodium Permanganate Addition
During the test with strontium nitrate and sodium permanganate addition, the slurry required only 35 hours to concentrate the insoluble solids 50X. The average flux measured 0.123 gpm/ft2 and the average flux over the last 8 hours equaled 0.086 gpm/ft2. The filter flux following stron-tium and permanganate addition proved twice the filter flux measured following MST addition. Given that the initial feed solution contained 0.23 wt % insoluble solids and operations concen-trated the slurry 50:1, the calculated solids loading at the end of the test reached 11.5 wt % (with a measured insoluble solids concentration of 17.6 wt %).
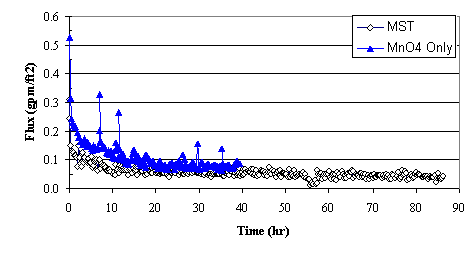
Figure 3 shows the filter flux as a function of time during the baseline test (with sludge and MST) and during the test with sodium permanganate addition. During the test with sodium permanganate addition, only 42 hours were needed to concentrate the insoluble solids 50X. The average flux equaled 0.113 gpm/ft2 and the average flux over the last 8 hours equaled 0.081 gpm/ft2. The filter flux following permanganate addition proved approximately twice the filter flux measured following MST addition. Given that the initial feed solution contained 0.12 wt % insoluble solids and operations concentrated the slurry 50:1, the calculated solids loading at the end of the test reached 6.0 wt % (with a measured insoluble solids concentration of 6.3 wt %).

Figure 3. Comparing Filter Flux from MST Addition to Filter Flux from Sodium
Permanganate Addition
Figure 4 shows the filter flux as a function of time during the strontium nitrate and sodium permanganate addition test and during the test with sodium permanganate addition. The data suggests no significant difference in the filter flux during these two tests.
Table 2 summarizes the results from the tests. The table shows the addition of strontium nitrate and sodium permanganate or the addition of only sodium permanganate significantly increased the filter flux relative to the baseline process using MST, while still removing the insoluble solids in the feed solution. The filtrate turbidity remained less than 0.6 NTU for each of the tests. The filter flux proved slightly higher when adding both strontium nitrate and sodium permanganate to the feed rather than when adding only sodium permanganate, but the difference of less than 10% likely falls within the statistical accuracy of the data.
Table 2. Test Results
|
Feed |
Test Time (h) |
Average Flux (gpm/ft2) |
Flux Final 8 Hours (gpm/ft2) |
Filtrate Turbidity (NTU) |
|
Sludge + MST |
86.25 |
0.059 |
0.043 |
0.44 – 0.45 |
|
Sludge + Sr + MnO4 |
35.25 |
0.123 |
0.086 |
0.38 – 0.51 |
|
Sludge + MnO4 |
41.75 |
0.113 |
0.081 |
0.39 – 0.59 |
|
Sludge + MST (1999)1 |
73.50 |
0.041 |
0.035 |
N/A |

Figure 4. Comparing Filter Flux from Strontium Nitrate and Sodium Permanganate
Addition to Filter Flux from Sodium Permanganate Addition
Table 2 also contains data from a test conducted in 1999.1 During that test, the feed solution contained 6.4 M sodium, average salt solution with 0.6 g/L Purex sludge and 0.55 g/L MST. The feed volume equaled 100 gallons, and testing concentrated the slurry approximately 50:1. The filter flux during the final 8 hours equaled 0.035 gpm/ft2 versus 0.043 gpm/ft2 in the current test (i.e., a reduction of 17%).
Previous SRTC testing measured the viscosity and density of SRS average salt solution as a function of sodium concentration between 2 M sodium and 6 M sodium.8 Using this data, one calculates a viscosity of 2.85 cp. at 6.4 M sodium (30 ° C), and 2.43 cp. at 5.6 M sodium (30 ° C). Since filter flux varies inversely with viscosity9, increasing the sodium concentration from 5.6M to 6.4 M would decrease the filter flux by 17%, as observed in the testing.
Particle Size
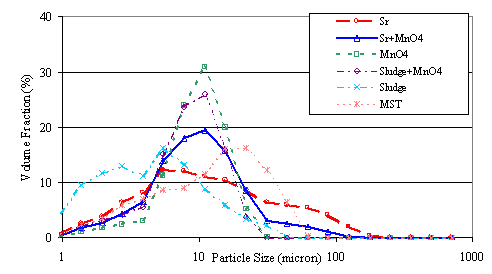
Following the third test (with only sodium permanganate added to the sludge), personnel collected six samples of the filtrate and added the following chemicals to the samples: strontium nitrate (0.05 M), strontium nitrate (0.05 M) plus sodium permanganate (0.05 M), sodium permanganate (0.05 M), Tank 40H simulated sludge (3.0 g/L) plus sodium permanganate (0.05 M), Tank 40H simulated sludge (3.0 g/L), and MST (2.75 g/L). They submitted the samples for particle size using a Microtrac X-100.10
Figure 5 and Table 3 show the results from the particle size analysis. The Kozeny-Carman model provides a simple description of colloidal fouling of microfilters.11,12 The model is described by equation [1]
J = (-DP/L)[dp2 e3/150 m(1-e)2] [1]
where J is the filter flux, DP is the transmembrane pressure, L is the cake thickness plus the filter thickness, dp is the particle diameter, e is the filter cake porosity, and m is viscosity. According to equation [1], if all other parameters remain constant, an increase in particle diameter or filter cake porosity will increase the filter flux.
Table 3. Particle Size Data
|
Solid |
Volumetric Mean (m ) |
Standard Deviation (m )* |
Percentage < 1 m |
Percentage > 44 m |
|
MST |
11.4 |
10.2 |
0.6 |
0.4 |
|
Solids from addition of sodium permanganate |
8.3 |
3.8 |
0.2 |
0 |
|
Solids from strontium nitrate + sodium permanganate treatment |
8.1 |
6.1 |
0.4 |
3.2 |
|
Sludge + solids from sodium permanganate treatment |
7.3 |
3.9 |
0.6 |
0 |
|
Sludge |
3.9 |
3.9 |
4.3 |
0 |
|
Solids from addition of strontium nitrate |
8.6 |
14.9 |
0.8 |
11.1 |
* Standard deviation defined as (84th percentile – 16th percentile)/2
The mean particle sizes for the solids from treatment with strontium nitrate, sodium permanganate, and strontium nitrate plus sodium permanganate appear approximately equal. The sludge particles have a smaller mean diameter than the particles from the solutions treated with either strontium nitrate or sodium permanganate. The particles in the slurries with MST have a slightly larger mean diameter than particles from the other slurries. Therefore, differences in particle diameter seem unlikely to cause the higher filter flux observed from the addition of strontium nitrate or sodium permanganate.
The particles in the solution with MST have a wider size distribution, as reflected in the standard deviation, than the particles in the solutions prepared with strontium nitrate or strontium nitrate plus sodium permanganate. The wider size distribution may allow the MST particles to pack more tightly than the particles from the strontium nitrate or sodium permanganate treatments of the waste (i.e., the small particles could accumulate in the gaps between the large particles). This tighter packing could increase the filter cake resistance and decrease filter flux.
In addition, the solid particles formed from the addition of strontium nitrate and sodium permanganate contained less fine (< 1 m) particles than the solids formed by the addition of MST. The fine particles could become trapped in the filter pores or filter cake and reduce the filter flux.

Figure 5. Particle Size Analysis
Cleaning
Following the baseline test with MST and the test with strontium nitrate plus sodium perman-ganate addition, personnel cleaned the filter. Personnel did not clean the filter following the test with sodium permanganate alone, because of closure of the laboratory. We did not observe any significant difference in the ability to clean the filter following the test with strontium nitrate and sodium permanganate addition compared to the baseline test with MST addition.
Conclusions
The results of this work as compared to the reference MST process follow.
Recommendations
Based upon the results from these tests, the authors make the following recommendations:
References