Figure 1. A Photograph of a Side of a Furnace.
WSRC-TR-2001-00535
HEU Holdup Measurements in 321-M
B and Spare U-Al Casting Furnaces
Saleem R. Salaymeh, Raymond A. Dewberry, and Frank S. Moore
Westinghouse Savannah River Company
Aiken, SC 29808
This report was prepared as an account of work sponsored by an agency of the United States Government. Neither the United States Government nor any agency thereof, nor any of their employees, makes any warranty, express or implied, or assumes any legal liability or responsibility for the accuracy, completeness, or usefulness of any information, apparatus, product or process disclosed, or represents that its use would not infringe privately owned rights. Reference herein to any specific commercial product, process or service by trade name, trademark, manufacturer, or otherwise does not necessarily constitute or imply its endorsement, recommendation, or favoring by the United States Government or any agency thereof. The views and opinions of authors expressed herein do not necessarily state or reflect those of the United States Government or any agency thereof.
This report has been reproduced directly from the best available copy.
Available for sale to the public, in paper, from: U.S. Department of Commerce, National Technical Information Service, 5285 Port Royal Road, Springfield, VA 22161, phone: (800) 553-6847, fax: (703) 605-6900, email: orders@ntis.fedworld.gov online ordering: http://www.ntis.gov/support/index.html
Available electronically at http://www.osti.gov/bridge
Available for a processing fee to U.S. Department of Energy and its contractors, in paper, from: U.S. Department of Energy, Office of Scientific and Technical Information, P.O. Box 62, Oak Ridge, TN 37831-0062, phone: (865 ) 576-8401, fax: (865) 576-5728, email: reports@adonis.osti.gov
Keywords: NDA, Multichannel, Far field, Assay, Holdup
Abstract
The Analytical Development Section of Savannah River Technology Center (SRTC) was requested by the Facilities Decontamination Division (FDD) to determine the holdup of enriched uranium in the 321-M facility as part of an overall deactivation project of the facility. The 321-M facility was used to fabricate enriched uranium fuel assemblies, lithium-aluminum target tubes, neptunium assemblies, and miscellaneous components for the production reactors. The facility also includes the 324-M storage building and the passageway connecting it to 321-M. The results of the holdup assays are essential for determining compliance with the Waste Acceptance Criteria, Material Control & Accountability, and to meet criticality safety controls. Two measurement systems are used to determine highly enriched uranium (HEU) holdup. One is a portable HPGe detector and EG&G DartÔ system that contains the high voltage power supply and signal processing electronics. A personal computer with Gamma-Vision software is used to control the DartÔ MCA and provide space to store and manipulate multiple 4096-channel g-ray spectra. The other is a 2" x 2" NaI crystal with an MCA that uses a portable computer with a Canberra NaI+ card installed. This card converts the PC to a full function MCA and contains the ancillary electronics, high voltage power supply, and amplifier required for data acquisition. This report covers holdup measurements in two uranium aluminum alloy (U-Al) casting furnaces. Our results indicate an upper limit of 235U content for the B and Spare furnaces of 51 and 67 g respectively. This report discusses the methodology, non-destructive assay (NDA) measurements, and results of the uranium holdup on the two furnaces.
1. Introduction
The 321-M facility was used to fabricate enriched uranium fuel assemblies, lithium-aluminum target tubes, neptunium assemblies, and miscellaneous components for the production reactors. The facility also includes the 324-M storage building and the passageway connecting it to 321-M. The facility operated for 25 years. During this time, thousands of uranium-aluminum-alloy (U-Al) fuel tubes were produced. After the facility ceased operations in 1995, all of the easily accessible U-Al was removed from the building and only residual amounts remained. The bulk of this residue is located in the equipment that generated and handled small U-Al particles and the exhaust systems for this equipment (e.g., Chip compactor, four casting furnaces, log saw, lathes A & B, cyclone separator, Freonä cart, riser crusher, …etc). 1 Two of the four U-Al casting furnaces were assayed earlier.2 This report describes g-PHA assay of the remaining two furnaces.
235U holdup measurements were performed in 1995 and documented in technical report WSRC-TR-95-0492.3 The holdup values reported in WSRC-TR-95-0492 were only best estimates, due to lack of time for conducting the measurements and analysis. Therefore Facility Disposition Division (FDD) has requested technical assistance from the Analytical Development Section (ADS) of the Savannah River Technology Center (SRTC) to determine the holdup of enriched uranium in the 321-M facility, as part of an overall deactivation project of the facility.4 This project includes the dismantling and removal of all held-up highly enriched uranium (HEU) to the extent practical. ADS was tasked to conduct holdup assays to quantify the amount of HEU on all components removed from the facility prior to placement in B-25 containers. The 235U holdup in any single component of process equipment must not exceed 50 g in order to meet the B-25 limit.5 This limit was imposed to meet criticality requirements of the E-Area Low Level Vaults. Thus the holdup measurements are used as guidance to determine if further decontamination of equipment is needed to ensure that the quantity of 235U does not exceed the 50 g limit. In summary, the results of the holdup assays are essential for determining compliance with the Waste Acceptance Criteria, Material Control & Accountability, and to ensure that criticality safety controls are not exceeded.
This report covers holdup measurements in two (B & Spare) uranium aluminum alloy (U-Al) casting furnaces. Our results indicate total amounts of approximately (25.7 g +100% and -50%) and (33.5 g +100% and -50%) of enriched uranium on the B and Spare furnaces. This report will discuss the methodology, non-destructive assay (NDA) measurements, assumptions, and results of the U holdup in these components.
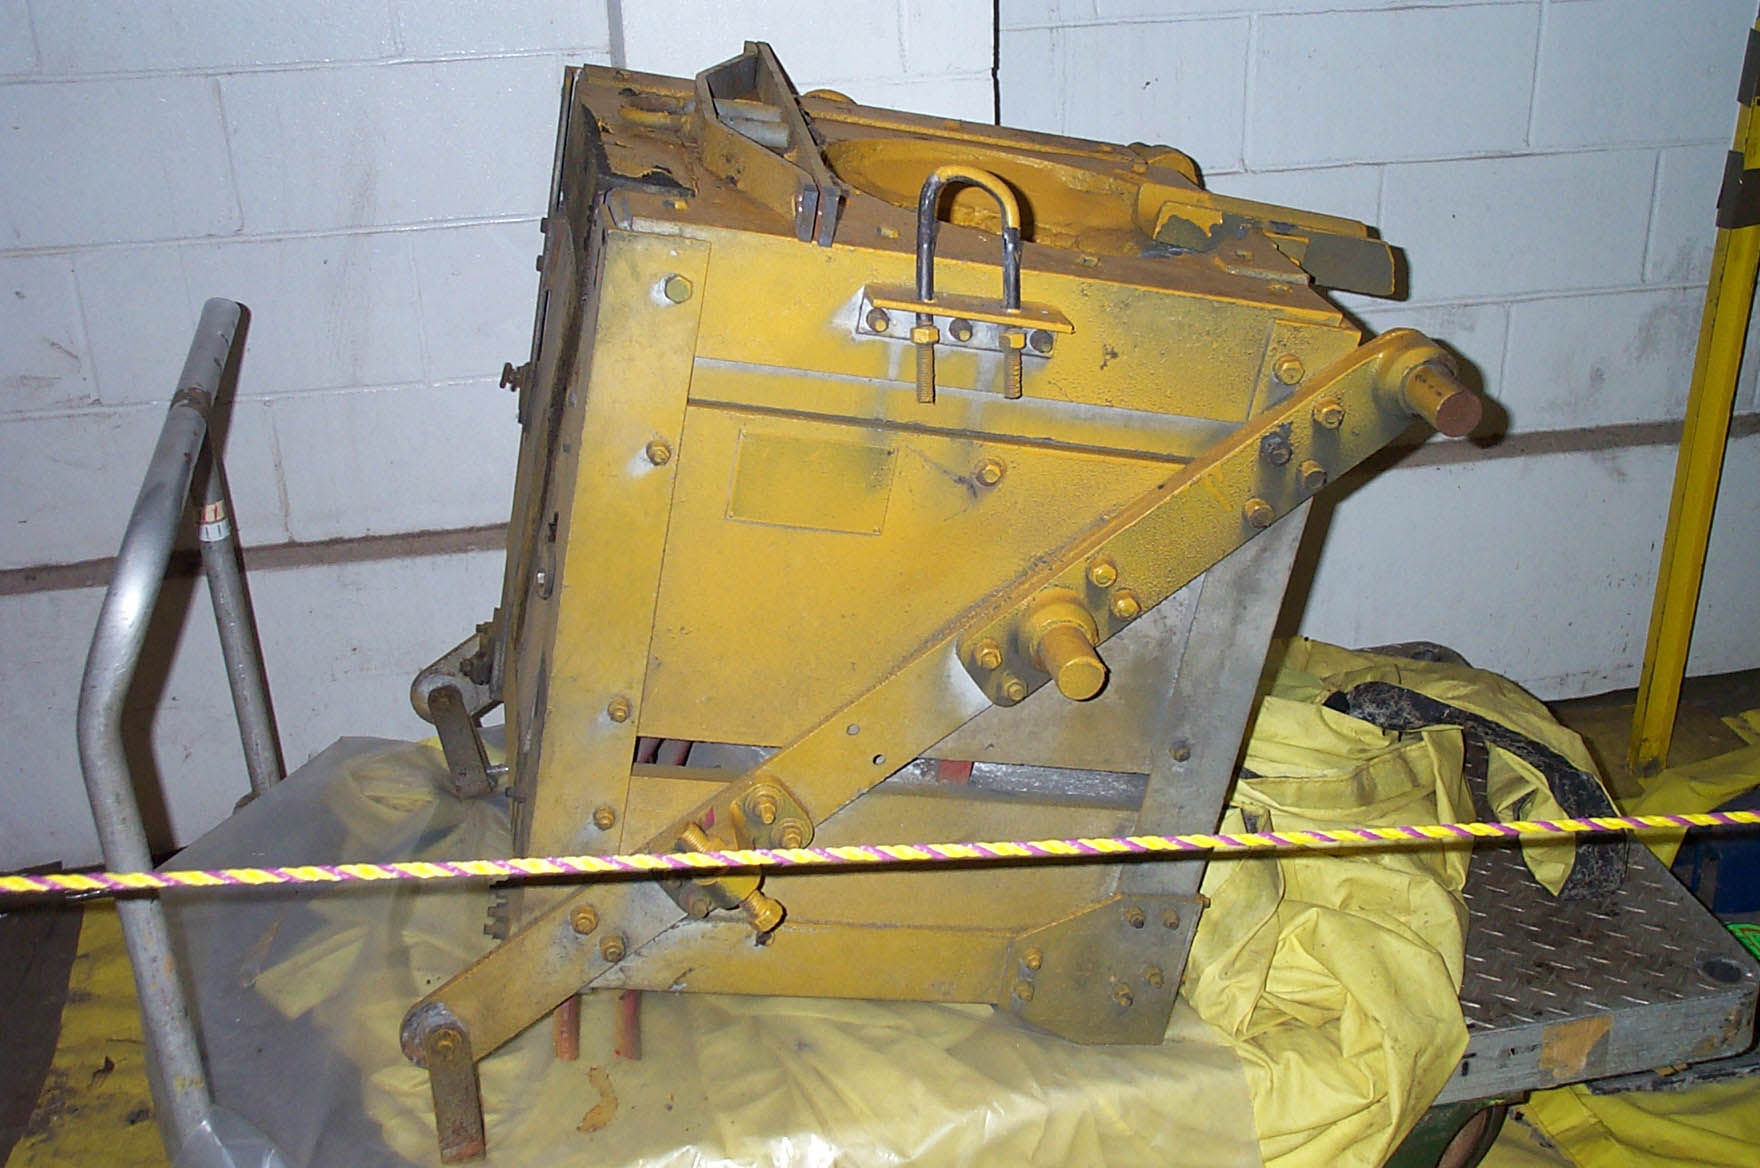
Since the 1995 assay indicated a total of 28.7 g of 235U holdup in furnace B with up to 100% uncertainty (no value reported for the spare furnace), a more precise value was required to determine their disposition with respect to the 50 g limit. The furnaces were used to cast U-Al alloy ingots. These casting furnaces have the dimensions 24" x 23.5" x 26". Figure 1 is a photograph of one of the two furnaces showing its side and top.
Figure 1. A Photograph of a Side of a Furnace.
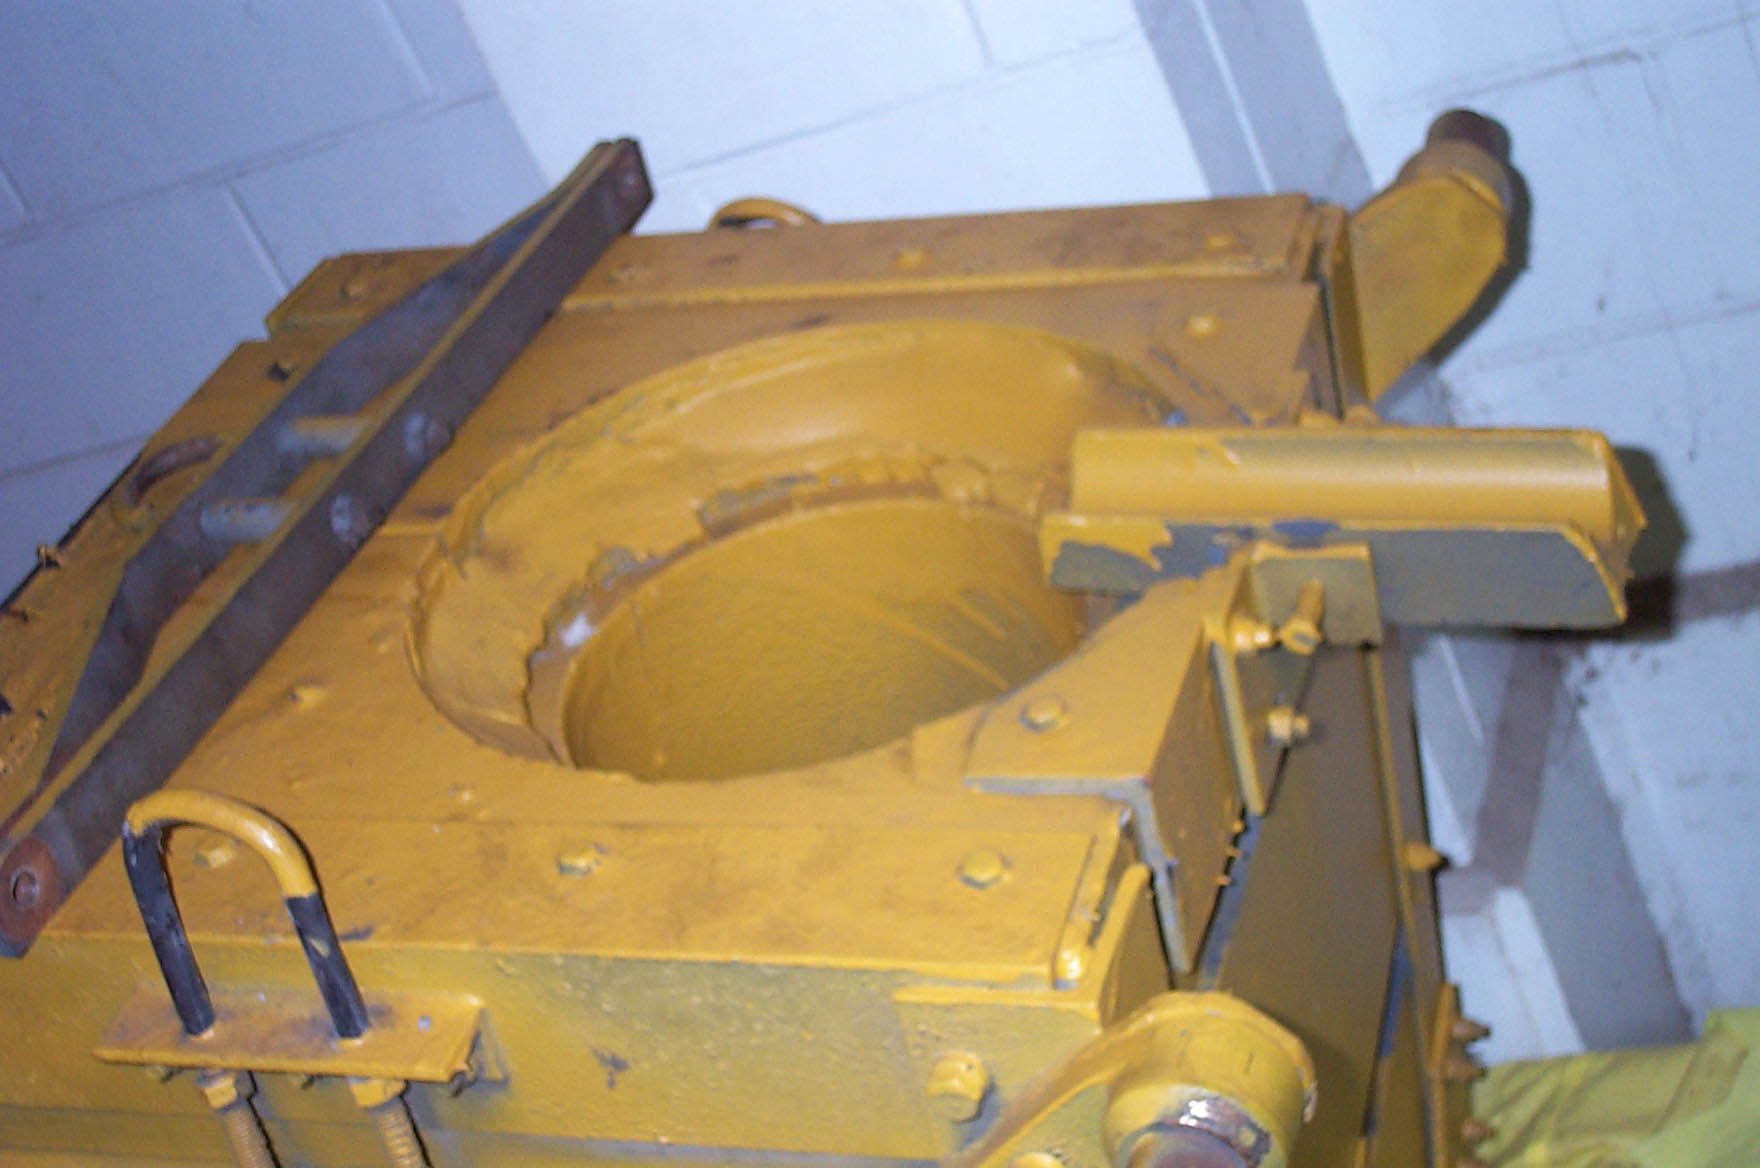
Figure 2. A Photograph of the Top of a Furnace.
2. Experimental
Two measurement systems were used for determining the quantity and approximate location of the HEU holdup in the two furnaces. One is a portable HPGe detector and EG&G DartÔ system that contains high voltage power supply and signal processing electronics. A personal computer with Gamma-Vision software was used to control the DartÔ MCA and to provide space to store and manipulate multiple 4096-channel g-ray spectra.6 The other is a 2" x 2" NaI crystal with an MCA that uses a portable computer with a Canberra NaI+ card installed. This card converts the PC to a full function MCA and contains the ancillary electronics, high voltage power supply, and amplifier required for data acquisition.7
We obtained high purity germanium detector (HpGe) acquisitions and sodium iodide (NaI) acquisitions at multiple distances for interpretation as both area source and point source configurations in order to assay for 235U content on the two furnaces. Both furnaces are very dense matrices, so that it is necessary to interpret all measured g-ray data as coming from surface contamination only.
Photographs of a casting furnace are shown in Figures 1 and 2. The top view in Figure 2 shows a five inch radius well of depth 18 inches. The following are the measured holdup values obtained for the two furnaces, which we identify as furnace B (item number 1893) and spare furnace (item number 1894) to be consistent with the identification used in the 1995 report.3 We use two approaches in these calculations and show that the results agree well.
3. Results and Discussion
3.1 Initial Assay
The data acquired from furnace B (item 1893) are listed in Table 1, and the data acquired from the spare furnace (item 1894) are listed in Table 2. Each of these tables contains both HpGe and NaI spectra, and they are identified appropriately in each table. Table 1 includes a quality control (QC) spectrum acquired with the HPGe detection system using the HEU standard wt2025a at a source to detector distance of 37 inches. Table 2 contains a QC spectrum acquired with the NaI detection system at a distance of 40 inches. These spectra were used as QC checks of both detection systems, and are presented as equations (1) and (2) of reference 8. The g-PHA spectra for the furnaces were acquired in the same set of experiments as those of the miscellaneous items described in reference 8, so we do not repeat the description of the QC checks performed on the systems.
Table 1. Data Acquisitions For Furnace B Item 1893 on February 27, 2001.
|
Location |
Acquisition Name |
Count time (s) |
185 KeV Area |
cps |
|
background |
2-12-01BKG |
5000 |
960± 79 |
0.192± 0.016 |
|
QC |
QC2025a |
140 |
2893± 57 |
20.66± 0.41 |
|
HpGe side 1 view |
1893furnside1 |
500 |
42421± 227 |
84.842± 0.454 |
|
HpGe side 3 view |
1893furnside3 |
500 |
3355± 22 |
6.71± 0.044 |
|
NaI side 1 view |
furn1893 |
100 |
9369± 229 |
93.69± 2.29 |
|
NaI side 2 view |
furn1893sid2 |
100 |
2188± 125 |
21.88± 1.25 |
|
NaI side 3 view |
furn3s3 |
100 |
2201± 117 |
22.01± 1.17 |
|
NaI side 4 view |
furn3s4 |
100 |
2319± 135 |
23.19± 1.35 |
|
top view |
100 |
6171± 394 |
61.71± 3.94 |
|
|
furnace 1893 well |
100 |
8386± 507 |
83.86± 5.07 |
Table 2. Date Acquisitions For Spare Furnace Item 1894 on
February 28, 2001.
|
Location |
Acquisition Name |
Count time (s) |
185 KeV Area |
cps |
|
background |
0213BKG |
16018 |
8375± 744 |
0.523± 0.046 |
|
QC |
QC2025a |
118.64 |
25543± 102 |
21.53± 0.86 |
|
1894 side 1 view |
1894furnsid1 |
500 |
30484± 195 |
60.97± 0.39 |
|
1894 side 3 view |
1894furnsid31 |
500 |
4032± 74 |
8.064± 0.148 |
|
1894 NaI side 1 view |
furn1894 |
100 |
4093± 184 |
40.93± 1.84 |
|
1894 NaI side 2 view |
furn4s2 |
100 |
993± 102 |
9.93± 1.02 |
|
1894 NaI side 3 view |
furn4s3 |
100 |
1480± 114 |
14.80± 1.14 |
|
1893 NaI side 4 view |
furn3s4 |
100 |
1193± 112 |
11.93± 1.12 |
|
1893 top view |
100 |
16559± 315 |
165.6± 3.15 |
|
|
1893 well |
100 |
6695± 248 |
66.95± 2.48 |
Figure 3 shows the HPGe QC spectrum obtained with the 4.41-g HEU source, and Figure 4 shows a typical sample HPGe spectrum (1893furnside1). The very good match between the QC spectrum and the spectrum (1893furnside1) demonstrates that the furnace sample spectra do not suffer from sample self-absorption. This interpretation is described in more detail in reference 8 and provides a good defense of the assumption that all of the data acquired represent surface contamination on the two furnaces. NaI g-PHA QC and background spectra are shown in Figure 5. Figures 6 and 7 are photographs of the two furnaces. The calculations and results for the two furnaces are recorded on pages 45 and 46 of reference 9. The measured contents are 8 < [HEU] < 32 grams on furnace 1893 and 7 < [HEU] < 28 grams on furnace 1894.10
Figure 3. HPGe QC Spectrum of 4.41 g HEU Standard.
Figure 4. HPGe Spectrum of Item 1983 Furnace Side 1.
Figure 5. NaI Detector Spectra of QC Check and Background.
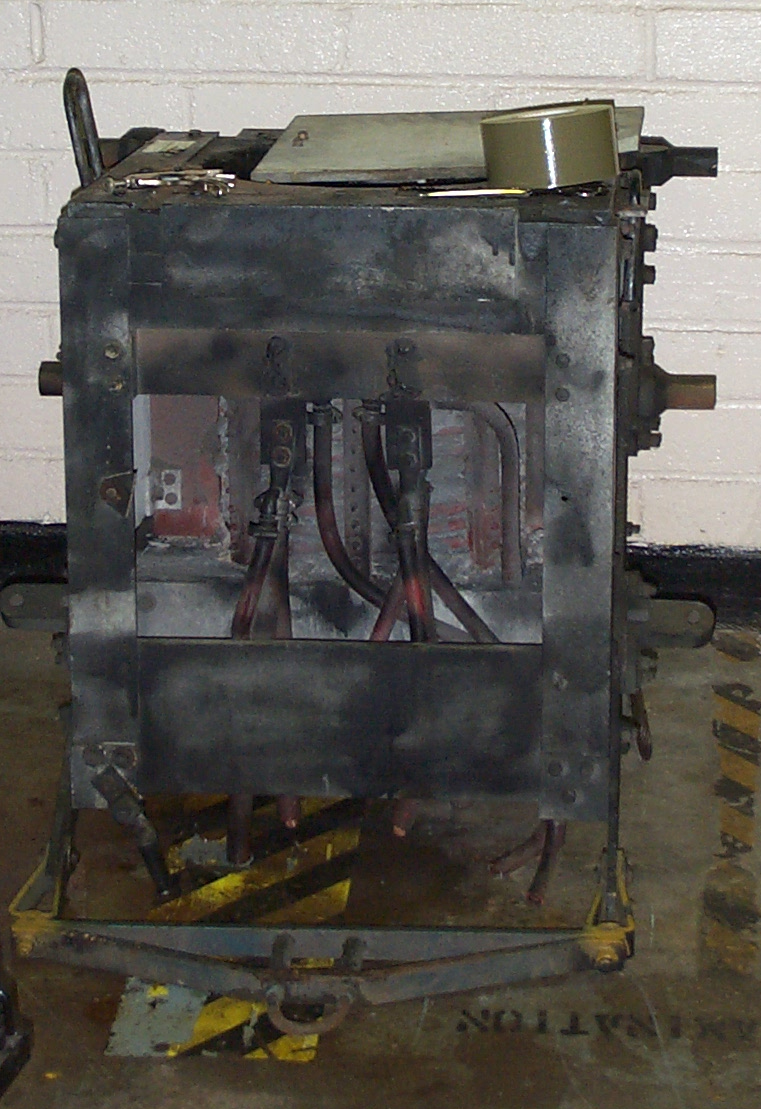
Figure 6. A Photograph of the B Furnace.
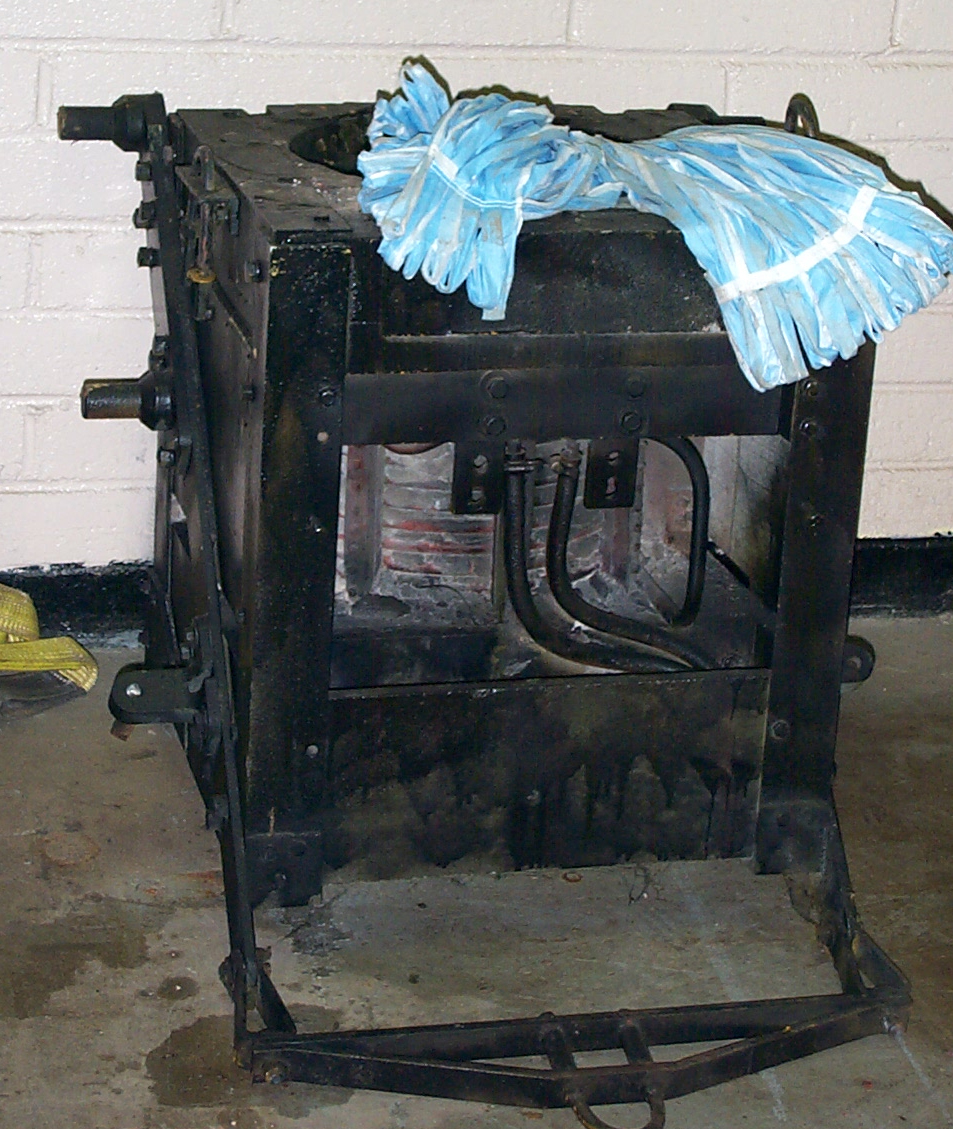
Figure 7. A Photograph of the Spare Furnace.
3.1.1 Calculations
The calculations of this section are documented in references 8 and 9. For furnace 1893 we obtained two HPGe acquisitions with a source to detector distance of 28 inches. We treat these acquisitions as both point sources and area sources to gain a measure of 235U content on the surfaces we observed. From face one we obtained the spectrum 1893furnside1 listed in Table 1. Using a point source configuration we obtained the 235U content of
235U = (2.36x10⁻⁵)(28x2.54)2(84.54) = 10.1 grams, (1)
where the first factor is the point source configuration calibration constant in units of g-sec/cm2 that was derived in reference 6, and the second factor is the source to detector distance in units of cm. With the same spectrum using an assumed area source configuration we obtain a content of
235U = (1.29x10⁻⁵)(84.84)A = 0.00109g/cm2(27x27x2.54x2.54)
= 5.1 grams, (2)
where the first term in (2) is the area source calibration constant derived for the HPGe in reference 6. The last term, A, is the total surface area of face one of the furnace.
From the HPGe measurements taken on face three (the face opposite face one) of furnace 1893 we obtain the values
235U = (2.36x10⁻⁵)(28x2.54)2(6.71) = 0.80 grams, and
235U = (1.29x10⁻⁵)(6.71)(27x27x2.54x2.54) = 0.41 grams.
The NaI data from each of the four vertical faces of furnace 1893 were acquired from a distance of eight inches. At that distance the collimated NaI detection system has an effective viewing area of 100 in2,11 and so each 27x27 or 24x27 vertical face can be regarded as an infinite uniform area source. The 235U content of face one is obtained from the NaI data using equation (3).
235U = (6.7x10⁻⁵)(93.69)(A)
= 0.00626g/in2(27x27) = 4.6 grams, (3)
where the first term is the area source calibration constant for the NaI detection system in units of g-sec/in2.10 Results for the NaI acquisitions from faces two, three, and four are 0.90 g, 1.08 g, and 1.01 g.
From the top face of furnace 1893 we obtain an NaI area source content of
235U = (6.7x10⁻⁵)(61.71)(A)
= 0.0041 g/in2(24x24 – 25p) = 2.1 grams. (4)
The last term in (4) is the surface area of the top face, which is a 24x24 inch square with a circle of radius 5 inches removed.
Finally we obtain the 235U content from the well using the last acquisition of Table 1. The surface area of the well is obtained from a sum of the 25p in2 bottom plus the area of the 18-inch cylindrical sides of radius 5 inches.
235U = (6.7x10⁻⁵)(83.86)(A)
= 0.00556 g/in2(25p+180p) = 3.6 grams. (5)
This calculation is a lower limit of content because the well was filled with a liquid that shielded it from the detector.
A second approximation of the content of 235U in the well is taken from an average of all of the vertical sides’ measurements and renormalizing to the surface area of the well.
235U = ¼[4.6/(27x27) +0.90/(27x27) + 1.08/(27x27) + 1.01/(27x27)]g/in2[25p + 180p]
= ¼(0.00626 + 0.00144 + 0.00146 + 0.00139)g/in2(25p + 180p)
= 1.8 grams. (6)
From the calculations above we have three measures of face one, three measures of face three, two measures of the well, and one measure each of faces two and four and the top. Our summed contamination of all but the bottom of furnace 1893 is
235U = 1/3(10.1 + 5.1 + 4.6) + 0.9 + 1/3(0.80 + 0.41 + 1.08)
+ 1.01 + 2.1 + ½(3.6 + 1.8)
= 14.1 grams. (7)
We assume the bottom to have the same contamination level as the average of the sides, therefore we divide this value that represents approximately five faces by five. We add this estimate of the bottom to the total of equation (7). Finally the 235U content of furnace 1893 is 17 grams with an assumed uncertainty of +100%/-50%, yielding
8 grams < mass on furnace 1893 < 34 grams.
Using an identical approach for furnace 1894 we obtain
235U = 1/3(6.8 + 3.7 + 3.9) + 0.4 + 1/3(0.89 + 0.41 + 0.7)
+ 0.6 + 3.9 + ½(2.8 + 0.8)
= 12.2 grams. (8)
for all but the bottom. The bottom we estimate as (12.2)/5 using the same approach as above. Finally for the total we obtain
7 grams < mass on furnace 1894 < 29 grams.
3.2 Second Assay
3.2.1 Furnace Sides
After removing the liquid from the wells of both furnaces by FDD personnel, we performed a second assay of the furnaces. The second assay of the furnaces was conducted with the HPGe and with the NaI detectors in the point source configurations. The furnaces were measured with the HPGe detector at 48 inches and with the NaI detector at ranges of 40 inches and 48 inches. We also acquired a NaI spectrum in the area source configuration at a range of 8 inches from the top of each furnace and several NaI acquisitions at close contact from the sides of the two furnaces.
The four far field HPGe measurements for each furnace are shown in Table 3. The 235U content was calculated in the last column of Table 3 for each of the four sides by
235U = (2.36x10⁻⁵)(48x2.54)2(cps),
which is identical to the point source calculations of (1) of the first part of this report.
Table 3. HPGe Data For Both B and
Spare Furnaces Acquired at 48 inches.
|
Furnace B (1983) |
185 KeV Area |
Count Time(sec) |
cps |
235U Mass |
|||
|
Side 1 |
470± 28 |
60 |
7.83 |
2.75± 0.16 |
|||
|
Side 2 |
492± 24 |
60 |
8.20 |
2.88± 0.14 |
|||
|
Side 3 |
924± 34 |
60 |
15.40 |
5.40± 0.20 |
|||
|
Side 4 |
2452± 53 |
60 |
40.87 |
14.34± 0.31 |
|||
|
Total |
25.36 |
||||||
|
Spare Furnace (1984) |
|||||||
|
Side 1 |
345± 21 |
60 |
5.75 |
2.02± 0.12 |
|||
|
Side 2 |
341± 21 |
60 |
5.68 |
1.99± 0.12 |
|||
|
Side 3 |
631± 28 |
60 |
10.52 |
3.69± 0.16 |
|||
|
Side 4 |
2215± 50 |
60 |
36.92 |
12.95± 0.29 |
|||
|
Total |
20.65 |
||||||
Table 4. NaI Point Source Data B Furnace
at 40" and Spare Furnace at 48".
|
Furnace B (1983) |
185 KeV Area |
Count Time(sec) |
cps |
235U Mass (g) |
|||
|
Side 1 |
237± 21.5% |
60 |
3.95 |
1.10 |
|||
|
Side 2 |
317± 21.9% |
60 |
5.28 |
1.07 |
|||
|
Side 3 |
519± 14.7% |
60 |
8.65 |
1.74 |
|||
|
Side 4 |
3717± 3.5% |
60 |
61.95 |
12.5 |
|||
|
Total |
16.4 |
||||||
|
Spare Furnace (1984) |
|||||||
|
Side 1 |
591± 12.3% |
60 |
9.85 |
2.86 |
|||
|
Side 2 |
25± 260% |
60 |
0.42 |
0.12 |
|||
|
Side 3 |
229± 29% |
60 |
3.82 |
1.11 |
|||
|
Side 4 |
1736± 7% |
60 |
28.93 |
8.40 |
|||
|
Total |
12.5 |
||||||
Note the sum of the far field HpGe measurements on furnace B sides is 25.4 g with the bulk of the material on side 4. This is consistent with our measurements in the initial assays with the difference that we designated the hot side as side 1. The sum of the far field HpGe measurements on the spare furnace is 20.6 g, with the bulk of the material on side 4.
The NaI far field measurements are listed in Table 4. The calculations in the last column of Table 4 were performed with equation (9).
235U = (2.10x10⁻⁶)(d)2(cpm), (9)
where the first term is the NaI point source calibration constant in units of g-min/in2,(11) and the distance d is 40 for furnace B and is 48 for the spare furnace. The NaI measurements for the four sides of furnace B sum to 16.4 g, and the NaI measurements for the spare furnace sum to 12.5 g. For the adopted value of the sum of the four sides we have taken the average of the HPGe and NaI measurements, 20.8 g for furnace B, and 16.6 g for the spare furnace. We still must deal with contamination in the top, the bottom, and the well.
3.2.2 Wells
For the wells, we obtained four contact measurements taken on the bottom of the well from each furnace. These data are summarized in Table 5. The last column in Table 5 lists the mass of 235U observed in each contact measurement. The 235U gram value is obtained using iterative fit of the observed count rate (equation 10). Equation is a Deming least square fit of the contact data in WSRC-TR-2000-00269.(7)
cpm = (1.03 x 10⁵ ) x (grams)/ (1 + 0.147 x grams). (10)
From the measured counts per second obtained at contact, the 235U holdup for each contact measurement is listed in Table 5. This technique of close-contact assay is consistent with the method used in reference 2. The summed content for the four measurements at the bottom of the cylinder in furnace B is 0.099 g, and the summed content for the four measurements at the bottom of the cylinder in the spare furnace is 0.355 g.
As described in reference 11, the NaI detector is a 1-inch radius cylindrical crystal placed in side of a steel collimator of inside radius ![]() inch. Therefore each contact measurement is able to view 1.41p in2 of surface area. The four contact measurements at the bottom of well B demonstrate an average surface contamination of 0.099/4(1.4p in2), or 0.00559 g/in2. With a radius of 5 inches, the bottom of each of the wells has a surface area of 25p in2. Therefore we estimate the total contamination of the bottom of the well in furnace B to be 0.44 g. Repeating the procedure for the spare furnace we obtain 1.57 g.
inch. Therefore each contact measurement is able to view 1.41p in2 of surface area. The four contact measurements at the bottom of well B demonstrate an average surface contamination of 0.099/4(1.4p in2), or 0.00559 g/in2. With a radius of 5 inches, the bottom of each of the wells has a surface area of 25p in2. Therefore we estimate the total contamination of the bottom of the well in furnace B to be 0.44 g. Repeating the procedure for the spare furnace we obtain 1.57 g.
For a comparison measurement, we take the total value measured by far field on the four sides of furnace B and divide by the total surface area of 4x(26x26) in2. The total surface contamination is then approximately 20.8/2704 = 0.00769 g/in2. The two techniques of determining surface contamination yield results in good agreement. It is interesting from our contact measurements that the well of the spare furnace appears to be far more contaminated than the well of furnace B.
Table 5. NaI Data from Contact Measurements
for Both B and Spare Furnaces
|
Furnace B (1983) |
185 KeV Area |
cps |
Mass 235U (g) |
Mass 235U Demming (g) |
|
bottom 1 |
2001 |
33.35 |
0.01 |
0.019 |
|
bottom 2 |
2789 |
46.48 |
0.01 |
0.027 |
|
bottom 3 |
2613 |
43.55 |
0.01 |
0.025 |
|
bottom 4 |
2784 |
46.40 |
0.01 |
0.027 |
|
Sum |
0.04 |
0.099 |
||
|
Spare Furnace (1984) |
||||
|
bottom 1 |
10007 |
166.78 |
0.04 |
0.099 |
|
bottom 2 |
7152 |
119.20 |
0.03 |
0.070 |
|
bottom 3 |
5539 |
92.32 |
0.02 |
0.054 |
|
bottom 4 |
13354 |
222.57 |
0.05 |
0.132 |
|
Sum |
0.14 |
0.355 |
||
Using the contact measurements we also determine the contamination on the walls of the two wells. With a radius of 5 inches and a height of 18 inches, the total surface area of the well walls is 180p in2. From the measured close contact values we calculate a contamination of 3.16 g on the walls of the well of furnace B and 11.34 g on the walls of the well of the spare furnace.
3.2.3 Furnace Tops
We determine the contamination on the furnace tops by three distinct techniques. The first technique uses the well contact measurements to determine the rate of contamination per unit area. For furnace B recall that rate is 0.00559 g/in2. The total area of the top of the furnace is 26 x 26 with a hole of radius 5 inches cut out by the well. Thus we project a total contamination of 0.00559{26x26 – 25p} = 3.34 g. Alternately we can use the rate of contamination from the sum of the sides (0.00769 g/in2) to project a total contamination of 4.59 g. Identical calculations for the spare furnace yield total contamination values of 11.98 g and 3.67 g.
Our last calculation of contamination of the top surface comes from the NaI measurement acquired from the top surface at a range of 8 inches. We treat this measurement as an area
source configuration and determine the surface contamination by equation (11).
235U = Ka(A)(cpm) = (1.12x10⁻⁶)(A)(cpm) (11)
where Ka is the area source calibration constant in g-min/in2, (11) A is the total area in in2, and cpm is the measured counts per minute. Total area for each furnace top is the same as above (26x26 – 25p). The measured data were 6974 cpm for furnace B and 8210 cpm for the spare. These yield total contamination values of 4.67 g and 5.49 g respectively.
3.2.4 Furnace Bottoms and Final Total
For the furnace bottoms we have no measured values to conduct the assay. We use the same technique of that in the first assays. That is to predict the HEU contamination of the bottoms from a simple average of the values on the four sides and top.
For the four sides of furnace B we have two measured values (25.3 g by HPGe and 16.4 g by NaI) for an adopted value of 20.8± 6.3 g. For the well top we have three calculated values of 3.3 g, 4.6 g, and 4.7 g, for an adopted value of 4.2± 0.8 g. From these we project a contamination of
[HEU]bottom = {(20.8± 6.3) + (4.2± 0.8)}/5 = 5.0± 1.3 g, (12)
where we have divided by five because the first term represents four sides. For the well bottom we calculated 0.44 g, and for the well sides we have the calculated value of 3.2 g. Thus our final total for furnace B is
[HEU]B = (20.8+6.3) + (4.2± 0.8) + (5.0± 1.3) + 0.44 + 3.2 = 34± 6 g. (13)
By identical determinations we project the contamination on the bottom of the spare furnace to be
[HEU]bottom = {(16.6± 5.7) + (7.0± 4.4)}/5 = 4.7± 1.4 g. (14)
For the well bottom we calculated 1.57 g, and for the well sides we have the calculated value of 11.3 g. Thus our final total for the spare furnace is
[HEU]spare = {(16.6± 5.7) + (7.0± 4.4) + (4.7± 1.4) + 1.57 + 11.3 = 41± 7 g. (15)
For equations (13) and (15) we have no assigned uncertainty for the last two terms. To compensate we adopt the usual convention of assigning +100%, -50% uncertainty to our overall values. Thus the result for furnace B in the second assay is
17 grams < mass on furnace B < 67 grams,
and the result for the spare furnace second assay is
21 grams < mass on spare furnace < 82 grams.
3.3 Reported Values
The two measured values for the two furnaces were determined by g-PHA using the same two detection systems, but with widely differing counting configurations. The initial assay used the HpGe detector in far field acquisitions that were treated as both point source and area source acquisitions. The NaI acquisitions in the initial assays were all in the area source configuration.
The second set of assays were performed with the HpGe detector exclusively in the point source configuration, but with the NaI detector in the point source and area source configurations as well as in the close contact configuration described in reference 7. Again the point source determinations on the furnace sides agreed very well between the HpGe and NaI detectors. These point source results were slightly higher than the results of the initial acquisitions, but the disagreement was not out of the bounds of holdup assays.
The second set of NaI area source acquisitions yielded measured contents on the furnace tops that were in very good agreement with the estimations of HEU contaminations made in the initial assays. Likewise the close contact measurements that we made on furnace B in the second assay yielded results for the top and well that were in very good agreement with the estimations for the top and well of furnace B in the initial assays.
The NaI area source acquisitions obtained in the second assays on the spare furnace yielded values for the furnace top that were in good agreement with the calculated values we obtained in the initial assays. The close contact measurements obtained on the spare furnace in the second assays yields derived contamination values in the well that are much higher than the initial assay and that are much higher than the area source acquisitions.
Table 6 lists the gram values obtained from the initial and the second assays. Column four provides an average of measured values where available.
Table 6 List of the Gram Values Obtained from Both Assays.
|
Component |
Initial Assay (g) |
Second Assay (g) |
Ave. of Both Assays Furnace B (g) |
|
4 Vertical Sides |
9.3 |
20.8 |
15 |
|
Top |
2.1 |
4.2 |
3.2 |
|
Bottom |
2.8 |
5.0 |
3.9 |
|
Well Walls |
2.4* |
3.2 |
3.2 |
|
Well Bottoms |
0.3* |
0.4 |
0.4 |
|
Total |
16.9 |
33.6 |
25.7 |
|
Reported Value |
25.7+100%/-50% (>13 < 51) g |
||
|
Component |
Initial Assay (g) |
Second Assay (g) |
Ave. of Both Assays |
|
4 Vertical Sides |
6.5 |
16.6 |
11.6 |
|
Top |
3.9 |
7.0 |
5.4 |
|
Bottom |
2.4 |
4.7 |
3.6 |
|
Well Walls |
1.6* |
11.3 |
11.3 |
|
Well Bottoms |
0.2* |
1.6 |
1.6 |
|
Total |
14.6 |
41.2 |
33.5 |
|
Reported Value |
33.5+100%/-50% (>17 < 67 g) |
||
*Projection based on uniform contamination of
the surface area of the
entire furnace and is not included in the average reported
in column four.
Including the close contact measurements in our estimation of contamination on the spare furnace raises the overall content values in the second assay significantly. For our adopted values we report the average of the two assays and with one sigma standard deviation as the uncertainty. This results in the following final values of 25.7+100% and -50% (>13 < 51) g for the B furnace and 33.5+100% and -50% (>17 < 67) g for the spare furnace
4. Conclusion
Using a combination of far field measurements obtained with a portable high purity germanium detection system and close field and close contact measurements obtained with a sodium iodide detection system, we have provided holdup measurements of 235U content in two casting furnaces used in Building 321-M. Each measurement assumed all detected activity was surface contamination, and no transmission corrections were applied. These holdup measurements were important contributions to assist FDD to accomplish the AOP milestone SC-FDD00-008. The upper limit of 235U content for the B and Spare furnaces are 51 g and 67 g respectively, which are in good agreement with the predicted range for holdup content in process furnaces.12 The value for B-Furnace is in agreement with the value reported in the 1995 report. No measurements were made in 1995 on the spare furnace.
5. References