
WSRC-TR-2000-00232
Tensile Properties for Application to Type I
and Type II
Waste Tank Flaw Stability Analysis
K. H. Subramanian and A. J. Duncan
Savannah River Technology Center
Westinghouse Savannah River Company
Aiken, SC 29808
This report was prepared as an account of work sponsored by an agency of the United States Government. Neither the United States Government nor any agency thereof, nor any of their employees, makes any warranty, express or implied, or assumes any legal liability or responsibility for the accuracy, completeness, or usefulness of any information, apparatus, product or process disclosed, or represents that its use would not infringe privately owned rights. Reference herein to any specific commercial product, process or service by trade name, trademark, manufacturer, or otherwise does not necessarily constitute or imply its endorsement, recommendation, or favoring by the United States Government or any agency thereof. The views and opinions of authors expressed herein do not necessarily state or reflect those of the United States Government or any agency thereof.
This report has been reproduced directly from the best available copy.
Available for sale to the public, in paper, from: U.S. Department of Commerce, National Technical Information Service, 5285 Port Royal Road, Springfield, VA 22161, phone: (800) 553-6847, fax: (703) 605-6900, email: orders@ntis.fedworld.gov online ordering: http://www.ntis.gov/support/ordering.htm
Available electronically at http://www.osti.gov/bridge/
Available for a processing fee to U.S. Department of Energy and its contractors, in paper, from: U.S. Department of Energy, Office of Scientific and Technical Information, P.O. Box 62, Oak Ridge, TN 37831-0062, phone: (865 ) 576-8401, fax: (865) 576-5728, email: reports@adonis.osti.gov
1 Summary
Tensile testing to provide tensile test data for ASTM A285 steel for application to fracture analysis of Type I and Type II high level waste tanks has been completed. The testing was performed in accordance with the test plan outlined in SRT-MTS-2000-20011. A total of 32 tensile tests were done on 8 heats of steel. Each heat of steel was tested with the tensile axis in the L and T directions and at 60oF and 80oF. Yield stress, ultimate tensile strength, and total elongation were measured. Load vs. displacement and stress-strain curves were calculated.
Tensile properties were analyzed as a function of chemical composition, microstructural features, test temperature, and orientation. Results are shown as a function of carbon, manganese, and sulfur content. In addition, grain size and pearlite influences on tensile properties are discussed. Stress-strain curves show Luders type behavior with upper and lower yield point phenomenon as expected of low carbon steels.
The results show that tensile properties are not affected by carbon content in the range tested. Carbon content affects yield and ultimate tensile strength by controlling pearlite volume fraction, and is not varied enough in these tests to have a significant effect. Manganese content is analyzed as a component of Mn/C ratio and also shows a negligible effect on yield stress and ultimate tensile stress. Increased sulfur content and increased temperature indicate a slight decrease in yield and ultimate tensile strength. Test orientation does not show any effect on tensile properties. Increased grain size led to decrease tensile properties, in accordance with increased manganese that acts as a grain refiner. Increased manganese augments the effect of pearlite content and grain size on tensile properties.
The properties obtained were used to calculate accurate JIc values from tests done on the same heats of steel. These data are reported and show no dependence on orientation. There is insufficient data to make statistical inferences. However, the effect of chemical composition on J-R curve behavior is much greater than on tensile properties. Since the tensile tests sample bulk material, there is uniformity of yield and ultimate tensile strength in the range of chemical compositions tested. However, the fracture toughness depends upon the crack tip microstructure and shows a great dependence on microstructural features around the crack tip. This indicates that the bulk material of waste tanks in service can be expected to show uniform results on bulk sampling; however, local microstructural features will play a role in toughness behavior.
2 Introduction
2.1 Background
An experimental test program plan was developed for measuring mechanical properties of ASTM Type A285 carbon steel under conditions specific to Type I and II waste tanks. The test plan has been designed to directly support the Life Management Program for HLWM-Concentration, Storage, and Transfer Engineering for demonstration of tank structural integrity under normal operation and seismic conditions., Under this plan, fracture toughness testing and tensile testing are being performed on A285 steels that span the tank plate compositions.
Fracture toughness testing to provide an initial set of data for A285 steel for application to fracture analysis of Type I and II high level waste tanks has been completed. The testing was performed in accordance with the statistical-design test plan to provide mechanical and corrosion property data at tank and material-specific conditions. The fracture toughness of A285 is in the form of the J-integral versus ductile crack extension or crack growth resistance (J-R) curves.
2.2 Current Testing
Companion tensile testing has been completed to provide a set of data applicable to results of fracture toughness testing of A285 steel reported in WSRC-TR-99-00416. Testing was performed under conditions similar to those expected in normal operation, as previously enumerated. The yield stress (sy), ultimate tensile strength, elongation (%) values are reported. In addition, (1) s-e and (2) load vs. displacement traces are contained in the appendix. Relevant parameters will be used to update J-R curves, and calculate accurate JIC values.
The dependence of mechanical properties on chemical composition and microstructure is discussed. The effects of manganese, carbon, and sulfur content are addressed. The effect of pearlite is also discussed as a function of plate thickness, interlamellar spacing, and processing techniques. In addition, the effects of microstructure and grain size are addressed.
3 Methods
3.1 Materials
The carbon steel material for both Type I and II tanks was fabricated per specification ASTM A285-50T, Grade B firebox quality (A285). The nominal composition is shown in Table 3.1. A carbon content of 0.22 wt.% was allowed for plates that were greater than 0.75 inch thick, but less than or equal to 2 inches thick.
Table 3.1: Nominal Chemical Composition for A285-50T, ASTM Grade B Firebox Quality

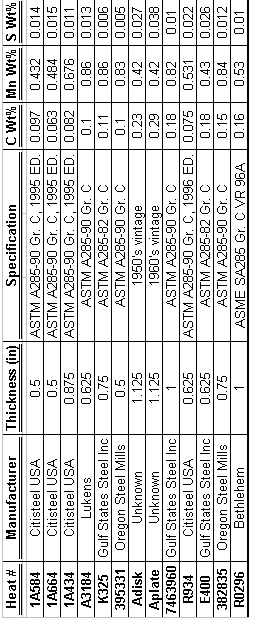
Material was selected to closely match the materials used in the Type I and II waste tanks. The sensitivity of the mechanical properties of low carbon steel to chemical composition with respect to carbon, manganese and sulfur contents is well established. The materials selected for the test matrix were chosen for the nominal levels of carbon, manganese and sulfur specified in Table 3.2. A list of heats of steel used (same as used for previous fracture toughness testing) for tensile testing with their respective (1) manufacturer, (2) plate thickness (3) chemical composition, and (4) ASTM specification are shown in Table 3.3. All of these heats were produced of semi-killed steel and hot rolled to the indicated plate thickness shown.
Table 3.2: Compositional Ranges Used to Select Heats of A285 for Test Matrix
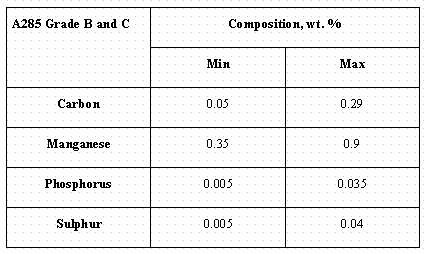
Table 3.3: Heats of Steel Obtained indicating (1) Manufacturer, (2) Plate Thickness, (3) ASTM Classification, and (4) Chemical Composition.
3.2 Testing
The test samples are of standard geometry as prescribed by ASTM E8, "Standard Method of Tension Testing of Metallic Materials". The samples were taken from the center of the rolled plate. Due to test fixture restrictions, a sub-sized standard specimen was used, as shown in Figure 3.1. A round specimen with threaded ends was used to allow post-test evaluation of true-stress, and true-strain. The cross-section of the test specimen can affect the percent elongation (ductility) measured. For the cylindrical test specimen, elongation to fracture increases with decreasing gage length. This is due to the localization of strain during necking, which occurs after maximum load. A gage length to diameter ratio of 4:1 is maintained to provide a standard basis to compare elongation values.
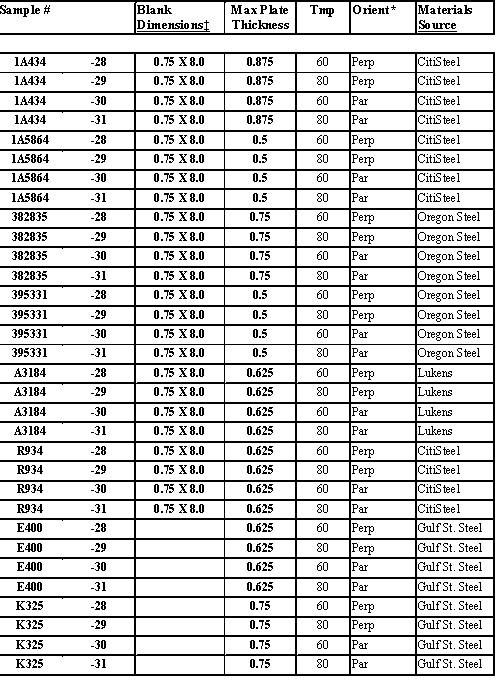
Eight heats of steel were tensile tested, from the possible 13 obtained heats. The eight heats selected correspond to heats previously tested for fracture toughness, and are shown in Table 3.3. A total of 32 tensile tests were conducted, as shown in Table 3.4. Each of the 8 heats was tensile tested with the tensile axis in the transverse and longitudinal directions; and at temperatures of 60oF and 80oF. A strain rate of 0.05 in/in/min was used during testing. An extensometer fastened mechanically to the sample was used to measure elastic and plastic strain until 0.075 % elongation, after which crosshead displacement was used. The assumption is that the crosshead displacement and the strain rate of the machine are equivalent to the displacement and strain rate in the gage length of the specimen. However, the compliance of the machine was ignored for total elongation calculations. In addition, the total elongation was measured optically following the testing. The crosshead displacement was determined to be accurate, indicating low machine compliance and validating the original assumption.

Figure 3.1: Tensile Test Specimen Dimensions
Table 3.4: List of Specimens Tensile Tested with (1) Thickness, (2) Temperature, (3) Tensile Axis Orientation with Respect to Rolling Direction, and (4) Materials Source
4 Results/Discussion
4.1 Load vs. Displacement/Extension
Appendix 1 contains the (1) load vs. displacement and (2) load vs. extension traces for each of the heats tested. Each chart shows specific results from each orientation and temperature tested for each heat of steel. The displacement data was recorded from crosshead displacement of the testing machine, and the extension data from an on-sample extensometer. The extensometer gage travel was limited to 0.075 inches and did not record information until fracture. However, the crosshead displacement is accurate for the purposes of measuring yield stress and ultimate tensile strength. Neither the load-displacement, nor load-extension data showed any dependence upon tensile axis orientation or test temperature.
4.2 Engineering Stress vs. Engineering Strain Curves
4.2.1 Curve Analysis
Appendix 2 contains the engineering stress-strain curves for each of the heats. Once again, data from each heat of steel tested is shown on one chart for each orientation and temperature. Both the ultimate tensile strength and yield stress were calculated using engineering stress. As a result, only the initial cross-sectional surface area was considered; the reduction of area will be addressed during future true stress-strain calculations, which will include the Bridgman correction.
The stress-strain curves show an upper yield and lower yield point phenomenon (shown in Figure 4.1), indicative of a localized, heterogeneous transition from elastic to plastic deformation. The load increases steadily with elastic strain, then drops suddenly, fluctuates about a constant load, and finally rises with further strain, as strain hardening becomes active. At the upper yield point, a band (i.e., Luders band) of deformed metal at 45 degrees to the tensile axis appears at a stress concentration, and propagates through the specimen causing the elongation immediately after the upper yield point is reached. Each oscillation of the curve in the lower yield point region indicates elongation as a result of the nucleation of a new Luders band. The propagation of Luders bands throughout the specimen indicates the end of the yield point elongation.
The yield point phenomenon can also be explained in terms of dislocation behavior based upon the fact that dislocation sources are pinned by solute atom interactions. Elastic interaction between solute atoms and dislocations arises from the mutual interaction of stress fields surrounding misfitting solute atoms and the core of edge dislocations. The elastic interaction is so strong that the impurity atmosphere condenses in a row of atoms along the core of the dislocation. When the dislocation line is pulled free from the influence of the solute atoms, slip can occur at a lower stress. Alternatively, new dislocations must be generated to decrease flow stress where dislocations are strongly pinned. As a result, the upper yield point is created.
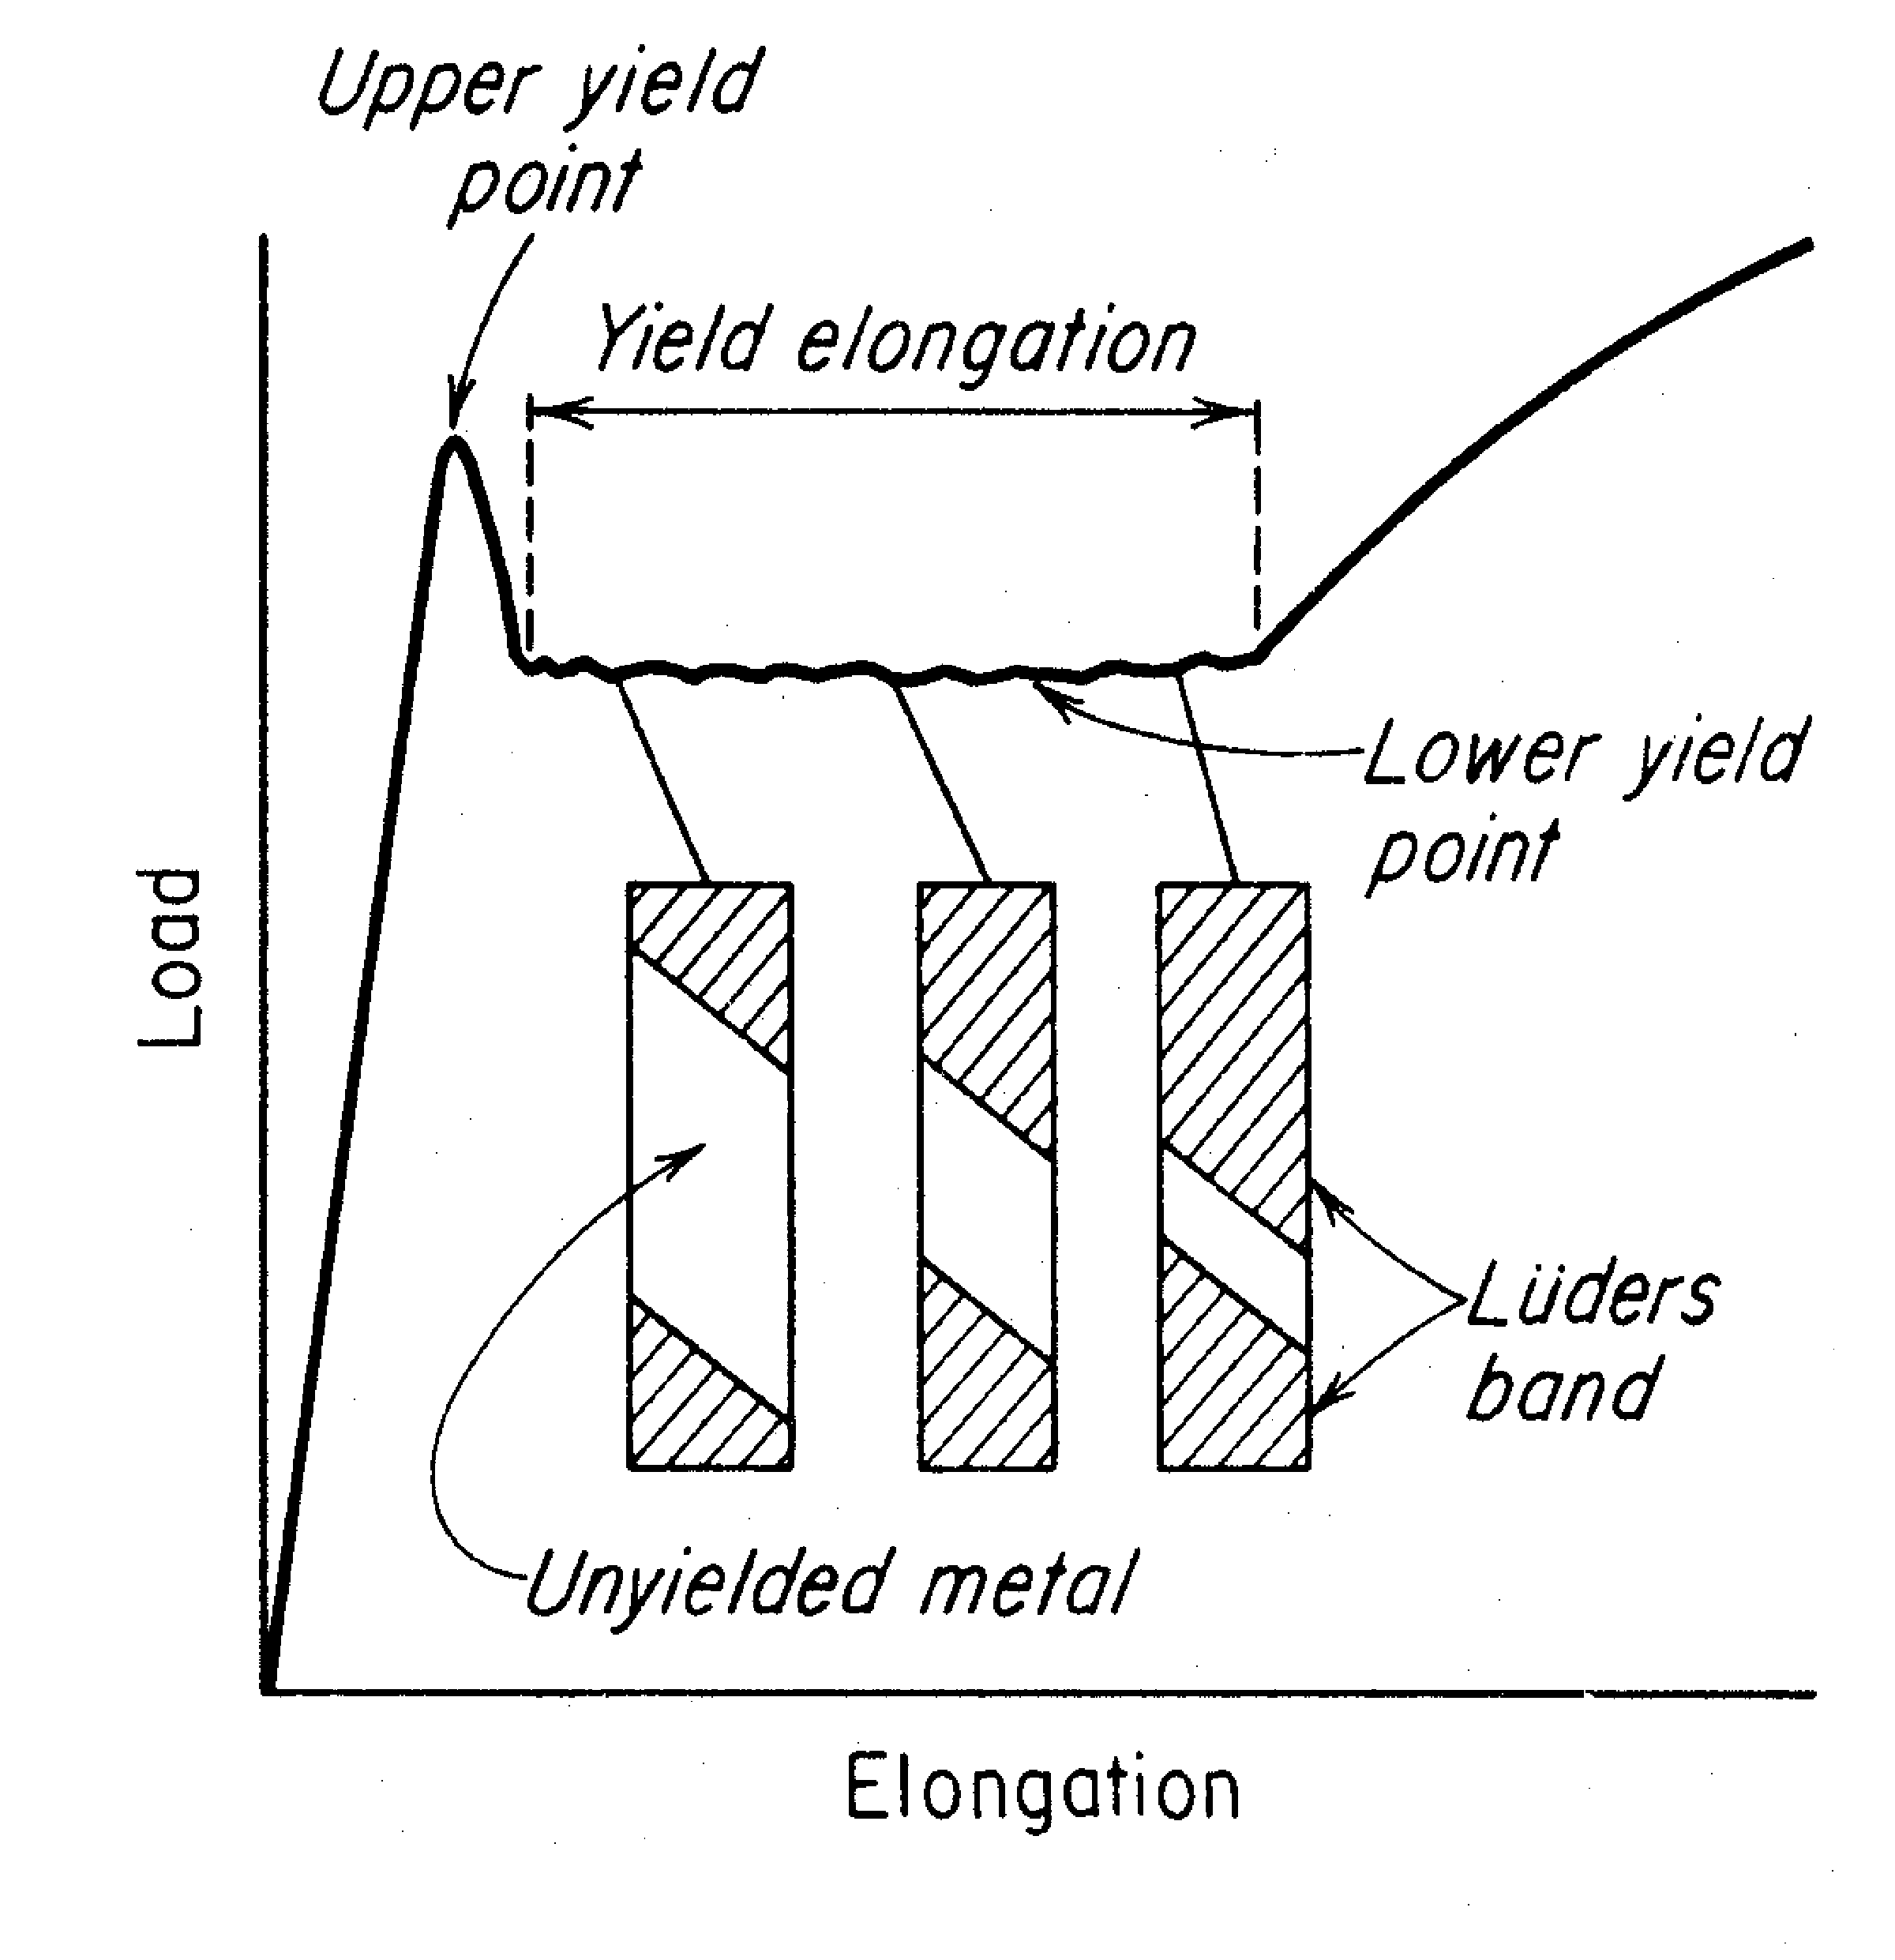
Figure 4.1: Schematic of Luders Behavior
4.2.2 Yield Strength, Ultimate Tensile Strength, and Total Elongation Summary
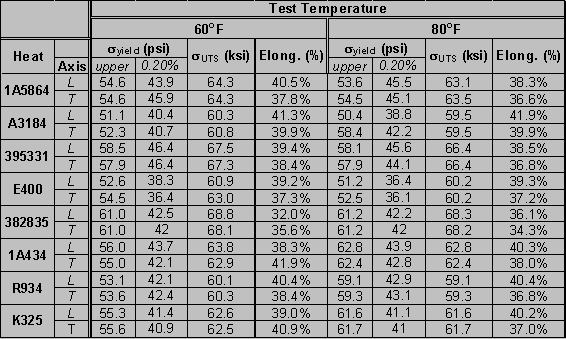
The total elongation, upper yield strength, 0.2% offset yield strength, and ultimate tensile strength are shown in Table 4.1. The test temperature and tensile axis orientation with respect to rolling direction are also indicated. The total elongation did not systematically vary as a function of orientation and temperature in the different heats; however, greater variation was observed in the tests conducted at 80oF. The elongation of every test sample stayed within bounds of 37-40%, regardless of chemical composition, orientation and temperature. This indicates that the effect of the chemical composition on total elongation is insignificant. Furthermore, orientation and temperature do not appear to substantially impact the yield and ultimate tensile strength. However, there is variance amongst heats indicating a possible second order influence of chemical composition on yield and ultimate tensile strength.
Table 4.1: Test Data Summary
4.3 Effect of Chemical Composition:
The effect of carbon and manganese content is well established. The effect of carbon content is shown in Figure 4.2. It is seen that tensile strength and yield strength increase with increasing carbon content, while elongation and reduction of area decrease. However, in the ranges between 0.1 and 0.2 percent carbon, there is a negligible and non-uniform effect of carbon content on yield strength and ultimate tensile strength. The yield strengths remain between 30-40 ksi, while the ultimate tensile strength remains between 50-60 ksi. These values are based on statistical analyses made by several investigators.
The yield stress is expected to increase with higher carbon and manganese content. Carbon readily diffuses to interstitial sites just below the atoms in a positive edge dislocation. The elastic interaction between trace amounts of carbon and dislocations in ferrite creates the yield point phenomenon as discussed before due to pinning of dislocations. However, this phenomenon is more sensitive to temperature than manganese content. Carbon primarily increases yield strength by increasing the volume fraction of pearlite. However, this behavior is not easily seen in carbon steels with less than 0.3% carbon because the volume fraction of pearlite is quite small. Tensile strength is observed to be more sensitive to carbon content (i.e., pearlite fraction) at these low levels primarily because of the impact of pearlite on strain hardening. Burns and Pickering observed the strain-hardening rate to increase linearly with pearlite content from 15 to 90 %. This also means that higher carbon content allows less energy absorption, and therefore reduces elongation and reduction of area prior to failure. In addition, there is decreased ductility, and lower Charpy impact values. Failure in steels is usually understood to result from void nucleation at pearlite interfaces or non-metallic inclusions and growth until voids intersect with one another. Hence, higher pearlite contents provide more possible sites for the void nucleation and decrease the amount of deformation possible before failure.
Figure 4.3 shows the effect of pearlite content and grain size on tensile strength as a function of carbon and manganese content . At a constant manganese level, the effect of carbon content on tensile strength is due only to the increase in pearlite volume fraction. On the other hand, the effect of manganese is threefold as discussed further.
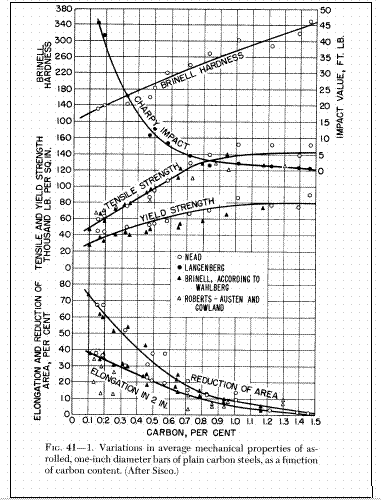
Figure 4.2: Carbon Content Effect on Mechanical Properties
Manganese increases yield and tensile strengths by several different mechanisms. Manganese lowers the pearlite transformation temperature, and thus increases the pearlite fraction for a given carbon content. Manganese also refines the grain size of the ferrite, as well as increases the flow stress by solution strengthening. These mechanisms combine to produce a beneficial effect on yield and tensile strengths as in the instance of carbon. However, manganese does not necessarily have the same deleterious effect on ductility that carbon does, since manganese strengthens by a combination of three different mechanisms and not solely by increased pearlite fraction. The ratio of manganese to carbon (Mn/C) is often used to describe the relationship between properties and alloying additions in carbon steels. A high Mn/C ratio will provide a favorable balance of strength and ductility, while a low Mn/C will usually exhibit an increase in strength at the expense of ductility.
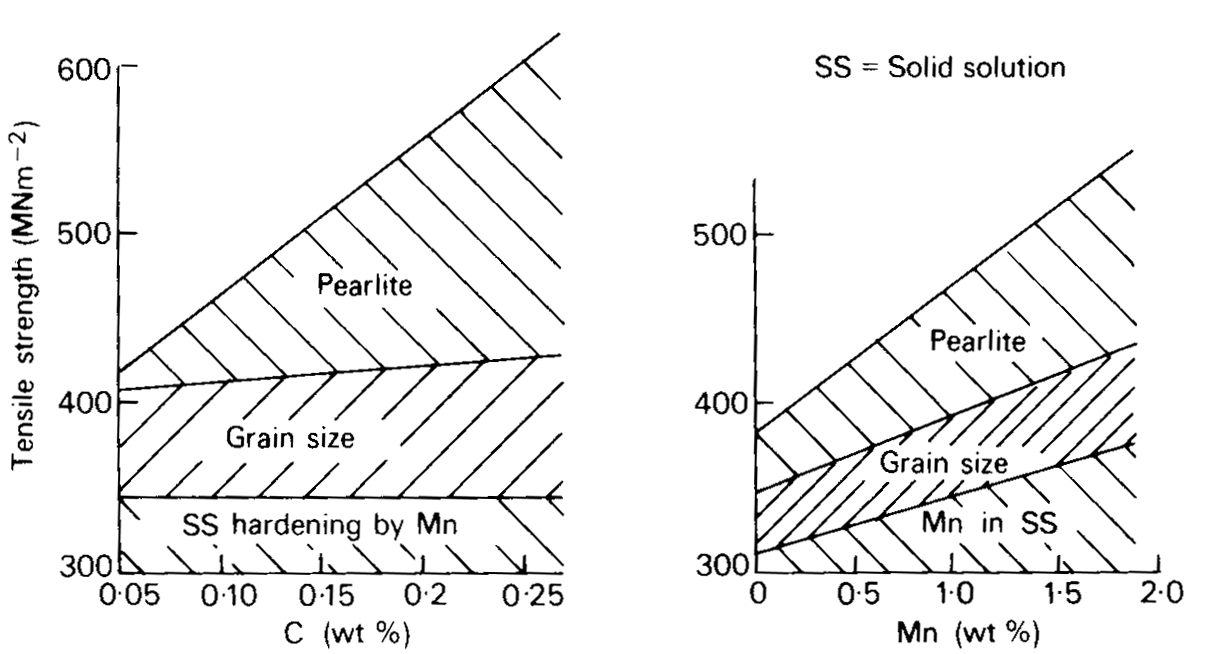
Figure 4.3: Effect of Pearlite Content, Grain Size, as a Function of Carbon and Manganese Content
Yield stress and ultimate tensile stress data from current testing are shown in Figure 4.4 as a function of temperature and carbon content. In addition, Figure 4.5 and Figure 4.8 show the effect of the Mn/C ratio and sulfur content respectively on the yield stress and ultimate tensile strength. Once again, the test temperature is indicated in the legend. Tensile specimen orientation has been ignored due to its negligible influence on yield stress and UTS. In addition, test temperature is also seen to have a negligible effect on yield stress and UTS in the ranges tested. However, it can be seen that the lower temperature tests all show slightly higher yield and tensile strengths with all other conditions equal. If the ranges tested are varied further, a temperature effect may be seen. This validates the study with respect to waste tank material, and indicates uniform mechanical properties in the range of temperatures tested.
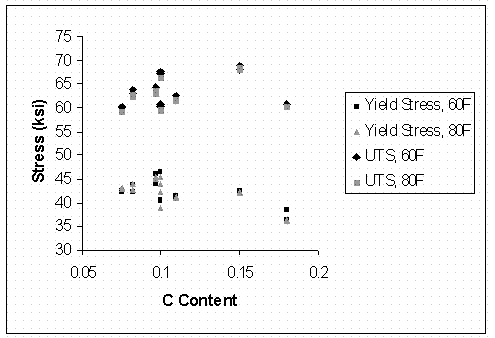
Figure 4.4: Effect of Carbon Content on Yield Stress and Ultimate Tensile Strength, shown for 60oF and 80oF
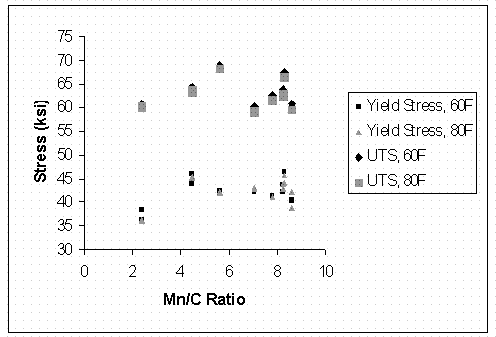
Figure 4.5: Effect of Mn/C Ratio on Yield Stress and Ultimate Tensile Strength, shown for 60oF and 80oF
The effect of carbon content on yield stress and UTS is seen to be negligible in the range tested. The yield stress is expected to increase with higher carbon content and manganese to carbon ratio. In addition, the ultimate tensile strength also does not show a dependence on carbon content in the ranges tested. In terms of waste tank material, this indicates uniform tensile behavior in the chemical composition ranges tested. The heats of steel were chosen to reflect the composition of waste tank material. These results indicate that mechanical properties of waste tank material are uniform with respect to yield stress and ultimate tensile strength as they fall within the carbon and manganese content ranges tested.
The percent elongation data from samples tested are shown in Figure 4.6 and Figure 4.7 are shown as a function of carbon content and Mn/C ratio. It is seen that elongation decreases as carbon content increases. This is to be expected as the higher concentration of carbon indicates a higher volume fraction of brittle pearlite.
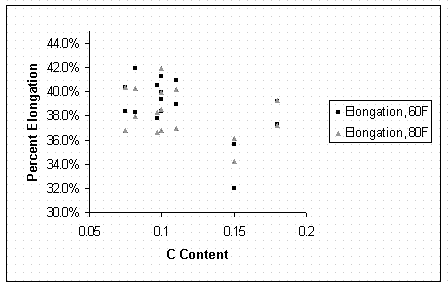
Figure 4.6: Effect of Carbon Content on Percent Elongation
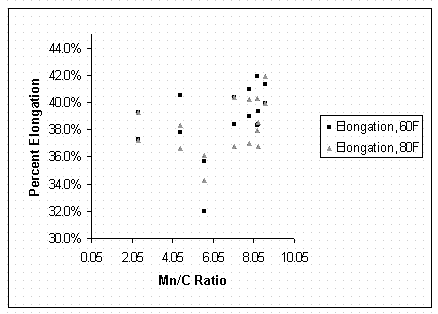
Figure 4.7: Effect of Mn/C Ratio on Percent Elongation
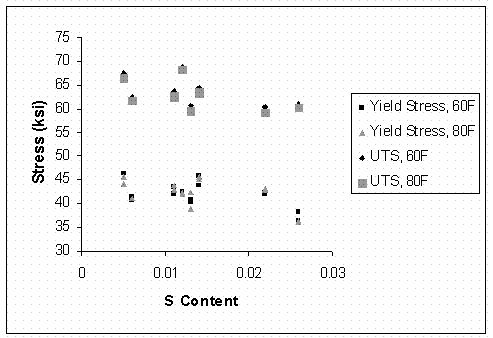
Figure 4.8: Effect of Sulfur Content on Yield Stress and Ultimate Tensile Strength, shown for 60oF and 80oF
Sulfur content shows an effect on the yield and ultimate tensile strengths. It is seen that as sulfur content increases, yield stress and ultimate tensile strength decrease. In the sulfur range tested (0.005 -0.026), yield stress varies from approximately 45 ksi (heat 395331) to 38 ksi (heat E400). The ultimate tensile strength for the same heats of steel falls within 67 ksi for heat 395331 and 60 ksi for heat E400. In addition, the ranges of intermediate sulfur contents fall within these bounds for yield stress. Heat 382835 with a sulfur content of 0.012 is an anomaly showing an ultimate tensile strength of 68 ksi average over the range of temperatures and orientations tested. Heat 382835 has a higher relative carbon and manganese content of 0.15 and 0.86 respectively.
The percent elongation as a function of sulfur content is shown in Figure 4.9. It is seen that sulfur content did not have uniform effect on the percent elongation, used as a measure of ductility. However, there is a general decrease in ductility with an increase of sulfur, as expected.
There are several mechanisms by which a higher sulfur content can decrease the yield stress, ultimate tensile strength, and percent elongation, or ductility:
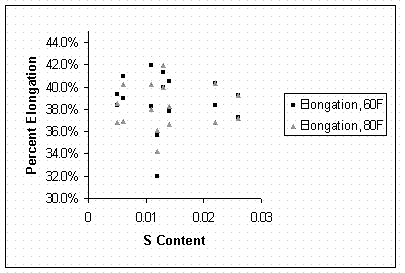
Figure 4.9: Effect of Sulfur Content on Percent Elongation
4.4 Effect of Grain Size
Grain size can impact the yield stress of carbon steels because grain boundaries in the vicinity of dislocations inhibit their movement under stress. The resultant effect is that the stress at which yielding occurs is elevated when grain size is small. This relationship is referred to as the Hall-Petch relation and is given as:
sy = s0 + kyd-1/2
where sy is the yield stress, s0 and ky are constants and d is the grain diameter. Figure 4.10 shows the data of yield stress in relation to the grain size of the heats. Figure 4.11 relates the yield stress to grain size in a manner consistent with the Hall-Petch relation. Although scatter is present, seemingly as a result of the different heats and plate thickness, the yield stress data show a downward trend with increasing grain size. This agrees with the Hall-Petch relation qualitatively. However, this relationship is difficult quantify with such a small data set.
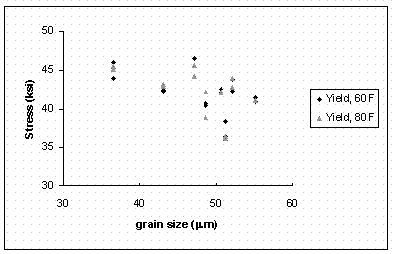
Figure 4.10: Yield Stress vs. Grain Size Plot
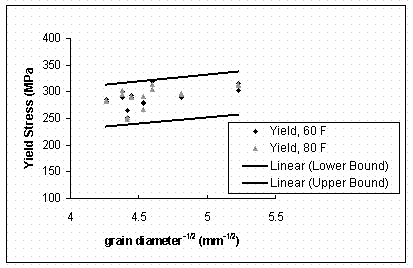
Figure 4.11: Hall-Petch Relationship for Grain Diameter, and Yield Stress with Upper and Lower Bounds
5 JIc Analysis
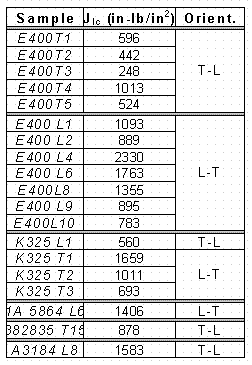
J-R curves were obtained for initial 30 fracture toughness specimens and previously reported. From these J-R curves, JIc's are calculated as outlined in ASTM E1820 using yield stresses obtained from current tensile testing. The J-R curves used are shown in Appendix 3. JIc's were calculated for tests conducted on heats E400, K325, 382835, 1A5864. and A3184. The J-R curves obtained from tests conducted on heats E400 are consolidated into one graph for each orientation. J-R curves from heat K325 have also been similarly consolidated.
The yield stresses were calculated by averaging 0.2% offset yield stresses calculated from tests of both temperature and orientation. It has been shown that temperature and orientation have a negligible effect on the 0.2% offset yield stress in the ranges tested. The results of the JIc calculations are shown in Table 5.1.
Crack length for fracture toughness testing was measured by unloading compliance and by DCPD method. Samples E400 T4, L4, and L8 all were measured by unloading compliance. As a result of this measurement technique, load relaxation during the unloading cycle contributes to an artificially high J-R curve, and consequently higher JIc values. In addition, sample E400 L6 was not sidegrooved and showed massive crack tunneling in the plane stress regime, once again contributing to an artificially high JIc value.
The data indicates a slight correlation between orientation and JIc. Empirically, since JIc values indicate the energy required to overcome elastic strain and initiate a crack, there should is no orientational dependence. However, with crack growth into the plastic regime and extensive plastic zone size, J at instability will show an orientational effect.
Table 5.1: JIc Results of Selected Heats, with Orientation Indicated
6 Path Forward
The samples tested will be analyzed for microstructural features that will lend insight to fracture behavior under tensile conditions. Orientational, compositional, and grain size effects on fracture mode will be qualified through fracture surface analysis. The yield stress and ultimate tensile strength of each specimen will be related to fracture surface features of each respective sample tested. The microstructure will be related to the resulting tensile properties, including yield strength, ultimate tensile strength, and total elongation. The fracture modes will be compared to the fracture mode during fracture toughness testing.
Several other parameters will be determined from the fractured samples. Reduction of area, the reduced radius in the neck region will be used to measure the stress at fracture. In addition, true stress and true strain calculations will be made. The curvature of the neck region will also be measured.
The remaining 5 heats of steel will be tested. The tests will be made in conjunction with future fracture toughness tests outlined by the statistical test matrix. Those results will again be used for similar analysis.
7 Acknowledgements
The authors of this report thank Dr. John J. Lewandowski and Chris Tuma of Case Western Reserve University for testing each of the tensile specimens, and their assistance in compiling data.
8 References
9 Appendix 1: Load vs. Extension and Load vs. Displacement Curves.
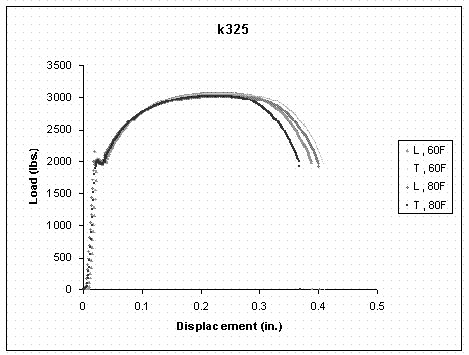
Figure 9.1: Heat K325, Load vs. Displacement Curves
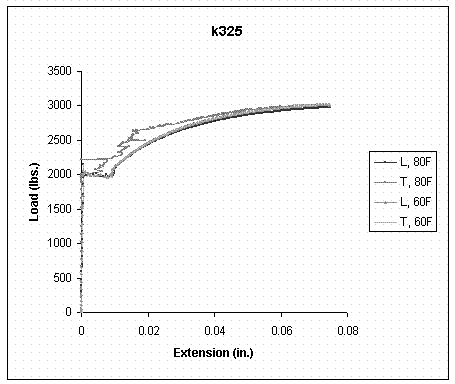
Figure 9.2: Heat K325, Load vs. Extension Curves
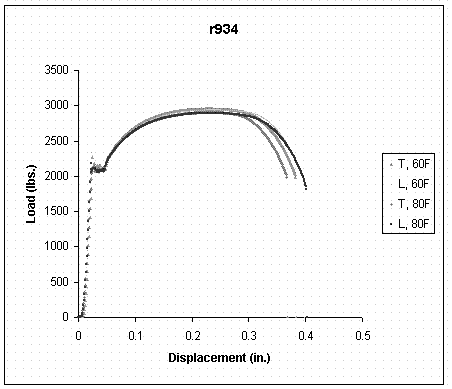
Figure 9.3: Heat R934, Load vs. Displacement Curves
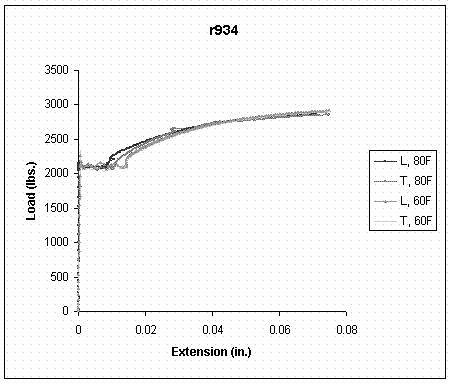
Figure 9.4: Heat R934, Load vs. Extension Curves
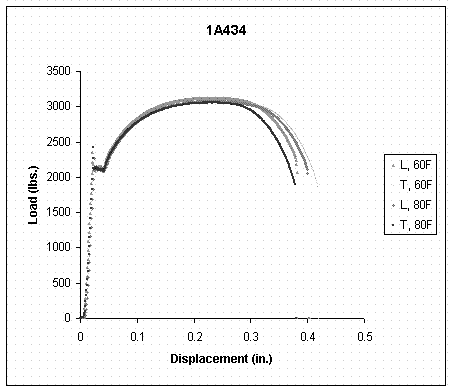
Figure 9.5: Heat 1A434, Load vs. Displacement Curves
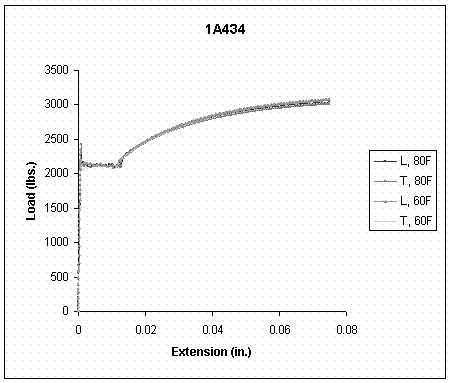
Figure 9.6: Heat 1A434, Load vs. Extension Curves
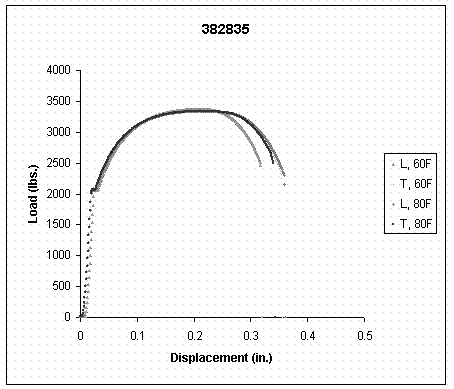
Figure 9.7: Heat 382835, Load vs. Displacement Curves
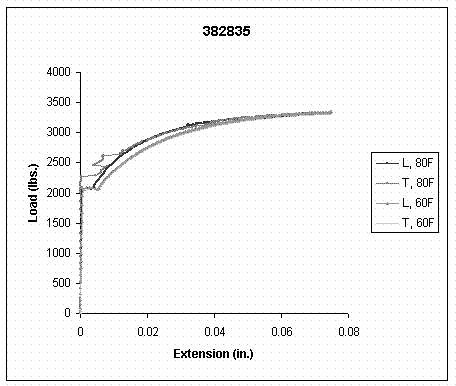
Figure 9.8: Heat 382835, Load vs. Extension Curves
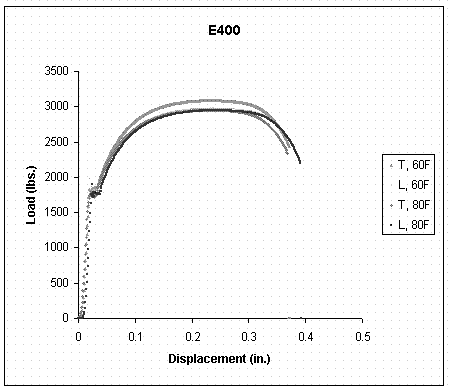
Figure 9.9: Heat E400, Load vs. Displacement Curves
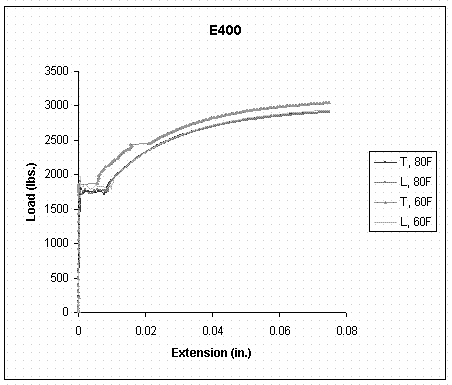
Figure 9.10: Heat E400, Load vs. Extension Curves
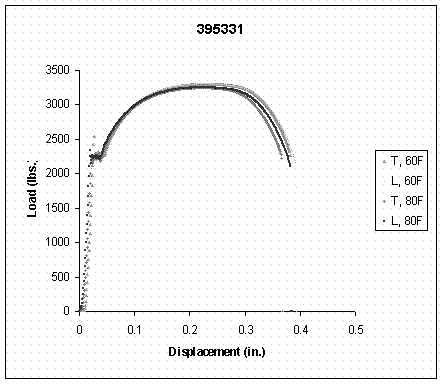
Figure 9.11: Heat 395331, Load vs. Displacement Curves
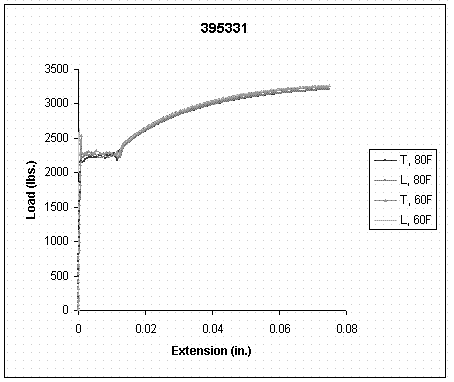
Figure 9.12: Heat 395331, Load vs. Extension Curves
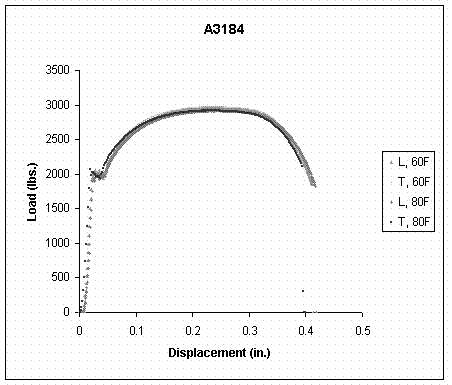
Figure 9.13: Heat A3184, Load vs. Displacement Curves
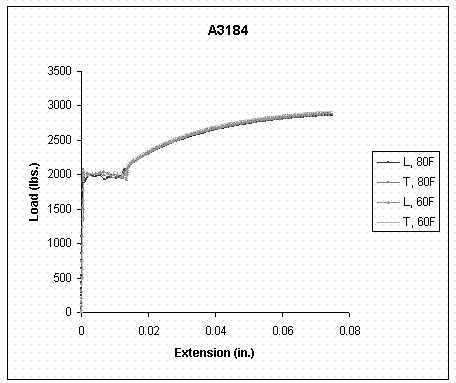
Figure 9.14: Heat A3184, Load vs. Extension Curves
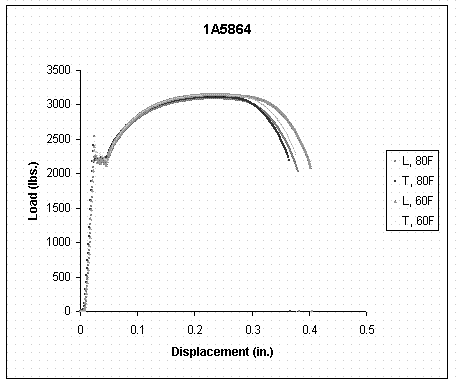
Figure 9.15: Heat 1A5864, Load vs. Displacement Curves
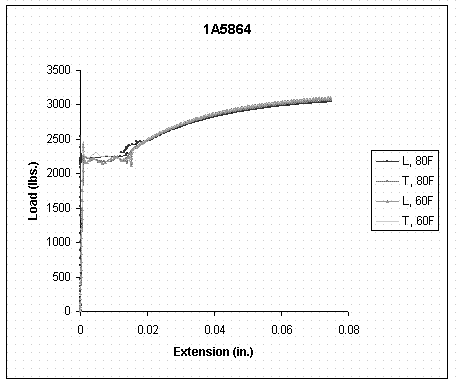
Figure 9.16: Heat 1A5864, Load vs. Extension Curves
10 Appendix 2: Engineering Stress vs. Engineering Strain Curves
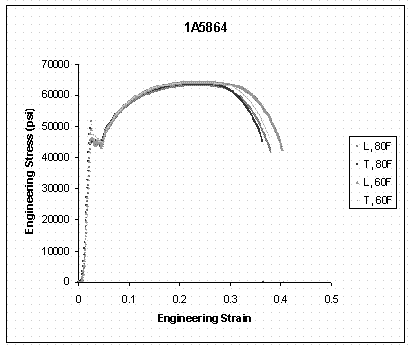
Figure 10.1: Heat 1A5864, Engineering Stress vs. Engineering Strain
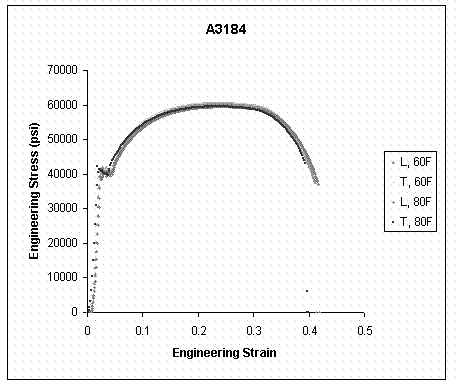
Figure 10.2: Heat A3184, Engineering Stress vs. Engineering Strain
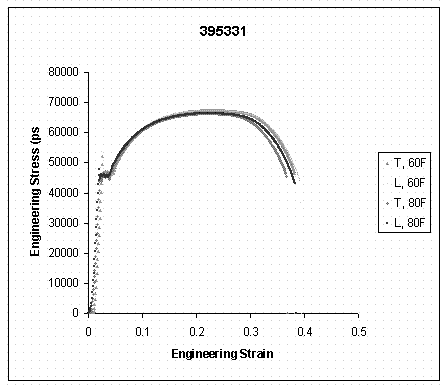
Figure 10.3: Heat 395331, Engineering Stress vs. Engineering Strain
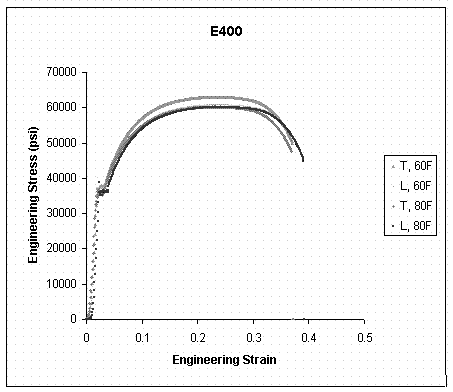
Figure 10.4: Heat E400, Engineering Stress vs. Engineering Strain
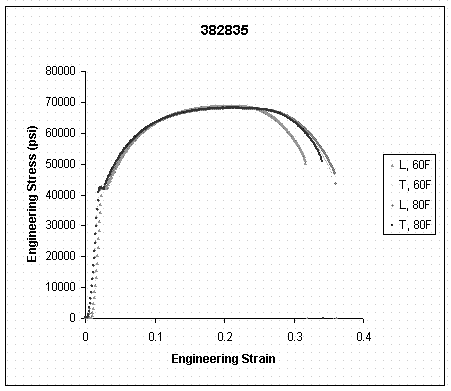
Figure 10.5: Heat 382835, Engineering Stress vs. Engineering Strain
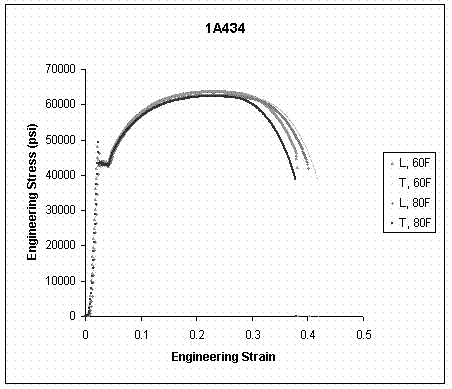
Figure 10.6: Heat 1A434, Engineering Stress vs. Engineering Strain
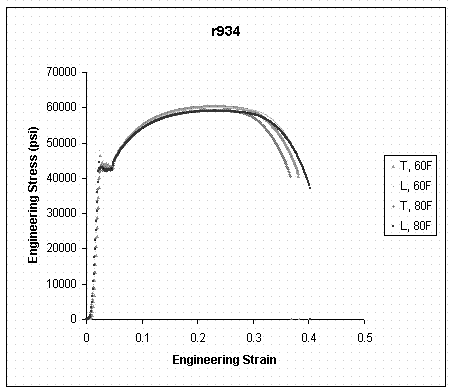
Figure 10.7: Heat r934, Engineering Stress vs. Engineering Strain
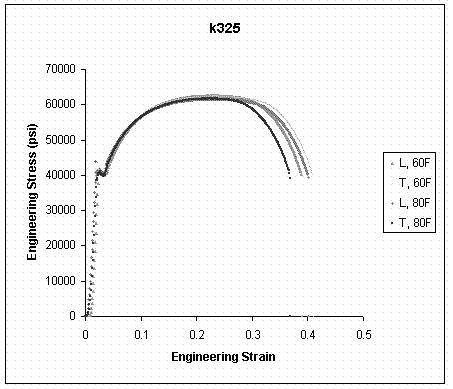
Figure 10.8: Heat k325, Engineering Stress vs. Engineering Strain
11 Appendix 3: J-R Curves Used for JIc Calculations
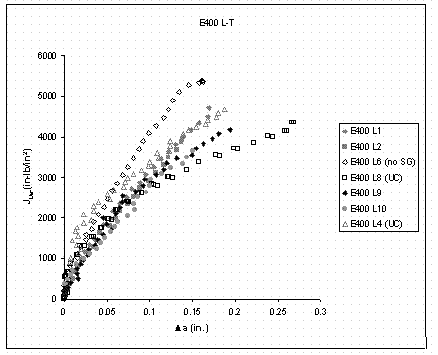
Figure 11.1: J-R Curves of Heat E400, L-T Orientation used for JIC Calculations
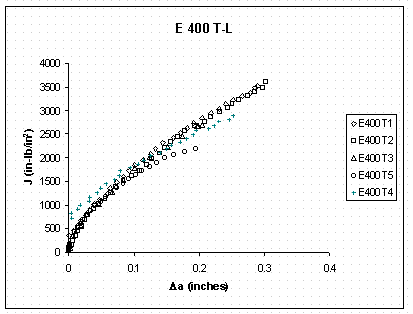
Figure 11.2: J-R Curves of Heat E400, T-L Orientation used for JIC Calculations
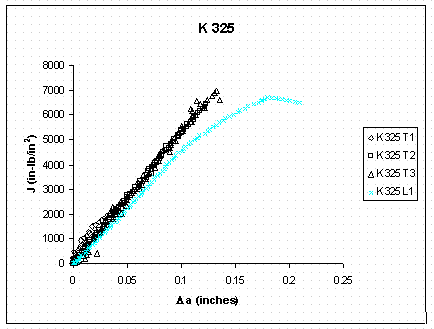
Figure 11.3: Heat K325, J-R Curves used for JIc Calculations
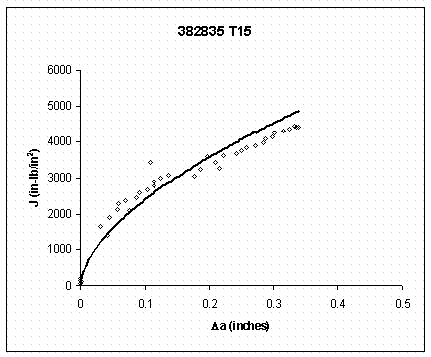
Figure 11.4: Sample 383835 T15, J-R Curve used for JIc Calculation
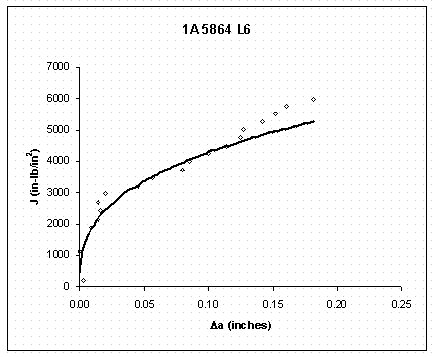
Figure 11.5: Sample 1A5864 L6, J-R Curve used for JIc Calculation
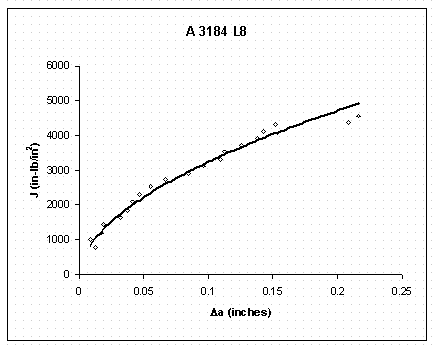
Figure 11.6: Sample A3184 L8, J-R Curve used for JIc Calculation