WSRC-MS-2000-00788
A Possible Calorimetric Error in Heavy Water Electrolysis on Platinum
K. L. Shanahan
Westinghouse Savannah River Company
Aiken, SC 29808
This report was prepared as an account of work sponsored by an agency of the United States Government. Neither the United States Government nor any agency thereof, nor any of their employees, makes any warranty, express or implied, or assumes any legal liability or responsibility for the accuracy, completeness, or usefulness of any information, apparatus, product or process disclosed, or represents that its use would not infringe privately owned rights. Reference herein to any specific commercial product, process or service by trade name, trademark, manufacturer, or otherwise does not necessarily constitute or imply its endorsement, recommendation, or favoring by the United States Government or any agency thereof. The views and opinions of authors expressed herein do not necessarily state or reflect those of the United States Government or any agency thereof.
This report has been reproduced directly from the best available copy.
Available for sale to the public, in paper, from: U.S. Department of Commerce, National Technical Information Service, 5285 Port Royal Road, Springfield, VA 22161, phone: (800) 553-6847, fax: (703) 605-6900, email: orders@ntis.fedworld.gov online ordering: http://www.ntis.gov/support/ordering.htm
Available electronically at http://www.osti.gov/bridge/
Available for a processing fee to U.S. Department of Energy and its contractors, in paper, from: U.S. Department of Energy, Office of Scientific and Technical Information, P.O. Box 62, Oak Ridge, TN 37831-0062, phone: (865 ) 576-8401, fax: (865) 576-5728, email: reports@adonis.osti.gov
Abstract
A systematic error in mass flow calorimetry calibration procedures potentially capable of explaining most positive excess power measurements is described. Data recently interpreted as providing evidence of the Pons-Fleischmann effect with a platinum cathode are reinterpreted with the opposite conclusion. This indicates it is premature to conclude platinum displays a Pons and Fleischmann effect, and places the requirement to evaluate the error's magnitude on all mass flow calorimetric experiments.
Introduction
It is now over ten years since Pons and Fleischmann claimed [1] that electrolysis of heavy water with a palladium cathode and platinum anode produced cold fusion (later known as the Pons and Fleischmann (P&F) effect). In that time several new variations on the original theme have been presented [2]. One of the most recent of these was the claim first made on an Internet mailing list by E. Storms in January, 2000 [3] that a platinum cathode could be made to show the P&F effect. In a laudable move, the raw experimental data and draft papers were made available by posting to a World Wide Web site [4]. Subsequently, the conclusions were presented substantially unchanged at the Eighth International Conference on Cold Fusion (ICCF8), held in Lereci, Italy on May 21 - 26, 2000 [5], and in the preprint for the Conference Proceedings posted on the Internet [6].
This is a significant claim, since up to now one of the primary requirements of the P&F effect was thought to be the necessity of loading a hydridable metal such as palladium or nickel to very high deuterium content. This is difficult to do via simple gas loading, as several thousand atmospheres of pressure may be required. It is much easier to do in the unique environment of an electrochemical cell, although even then, it is still difficult to obtain and maintain what is thought to be the requisite high loadings. But even in an electrochemical cell, platinum is not believed to form a bulk hydride. Thus the recent proposal by Storms is quite novel, and accordingly its basis bears close scrutiny.
Theory
The Storms claim for a Pt-based P&F effect is based upon a mass flow calorimetric study. In a mass flow calorimeter, the heat-producing electrochemical cell is placed in a controlled fluid flow. The fluid's inlet and outlet temperatures (Tin and Tout) are monitored and the output power (Pout) is theoretically computed as:
Pout = Cp * f * (Tout – Tin) (1)
where Cp is the calorimeter fluid's heat capacity and f is its flow rate. Since no calorimeter design achieves perfection, this equation is usually modified by establishing a statistical correlation between the measured input power (Pin) and the variation in the output parameters. Thus eq. (1) is applied in practice via a linear calibration equation, i.e.
Pout = m * Cp * f * (Tout - Tin) + b (2)
where m and b are the standard linear regression coefficients determined by fitting to input power. (In this report, numerical results will be for the combined term m*Cp.)
Finally, excess power (Pex) is determined by subtracting the input power from the computed output power:
Pex = Pout – Pin (3)
A positive Pex indicates an additional heat source in the cell (assuming no error).
Since m and b are statistical parameters, it is reasonable to assume some variation in these parameters would be observed if repeated calibrations were conducted. Therefore averaged 'global' values should be determined via replicate calibration runs. These global parameters would then be applied in each 'specific' case to interpret subsequent individual run data.
Recently, just such was noted for isoperibolic calorimetry [7]. Unlike the isoperibolic calorimeter, the design goal of a mass flow calorimeter is the total capture of all released heat, and it should theoretically not require anything but a single calibration. But perfect design goals are rarely achieved. This is evidenced by (a) the statement that the heat capture efficiency of this mass flow calorimeter approximates 98% [5,6], and (b) the reported calibrations showing small natural variation comprising a few percent of the expected theoretical heat capacities [4,5,6]. Thus it seems reasonable that mass flow calorimetry might well display variable calibration constants on a time-to-time or run-to-run basis.
Given that some level of natural variation is present, the global coefficients used to interpret any specific run will most probably be numerically different from the coefficients that best represent the specific run. This may produce an artifactual excess power signal.
That expected excess can be computed algebraically. In a specific run with no excess power, the expected output temperature in terms of input power, input temperature, and flow rate is computed by solving the run-specific calibration equation (2) assuming Pout = Pin, i.e.
Tout = Tin + ( Pin – bs ) /(ms * Cp * f) (4)
where ms and bs are the fit parameters for this specific run.
Substituting this expression into the global calibration equation, one finds that the flow rate and input temperature variables drop out. This leaves the expected output power expressed as a function of both set of calibration constants and the input power. Subtracting the input power from the expected output power gives the excess power as:
Pex = ( (mg/ms) –1 ) * Pin + ( bg – (mg/ms)*bs ) (5)
where mg and bg refer to the linear regression constants of the global calibration equation.
In a perfect situation, both algebraic terms should be zero and no excess power would be expected. However, since the constants are statistically determined, the terms will usually not be identical, and this will produce an excess power signal (either positive or negative). Thus a +3% calibration difference can produce an apparent positive excess power of 3%, which for 20 W input would mean an excess power of 600 mW.
Experimental Data
The electrolysis cell used by Storms was closed and used a recombination catalyst. The cathode was a platinum foil and the anode was a Pt wire mesh. The cell was placed in a mass flow calorimeter using pure water as the calorimetric fluid. The calorimeter inlet and outlet temperatures were monitored with thermistors. Further, three internal cell temperature thermistors were placed respectively near the top of the cell, near the bottom of the cell, and near the cathode. Water flow rate was periodically measured by collecting and weighing the water pumped in a measured time interval. Input current and cell voltage were also measured. The input current was stepped up, held constant for a time, and stepped again, either up to the maximum or down to zero in a current sweep. All experimental parameters were recorded by a computer data acquisition system. (A more complete description is included in reference 4.)
Calorimetric calibration was effected by the use of a resistive heater in the cell. Only one Pt electrode was reported to produce the effect, and another, called the 'inert' Pt electrode, was actually used as a calibration point as well. (No details about the 'inert' electrode were supplied.) Once the global calorimeter calibration constants were determined, they were applied to the measurements taken during other specific runs.
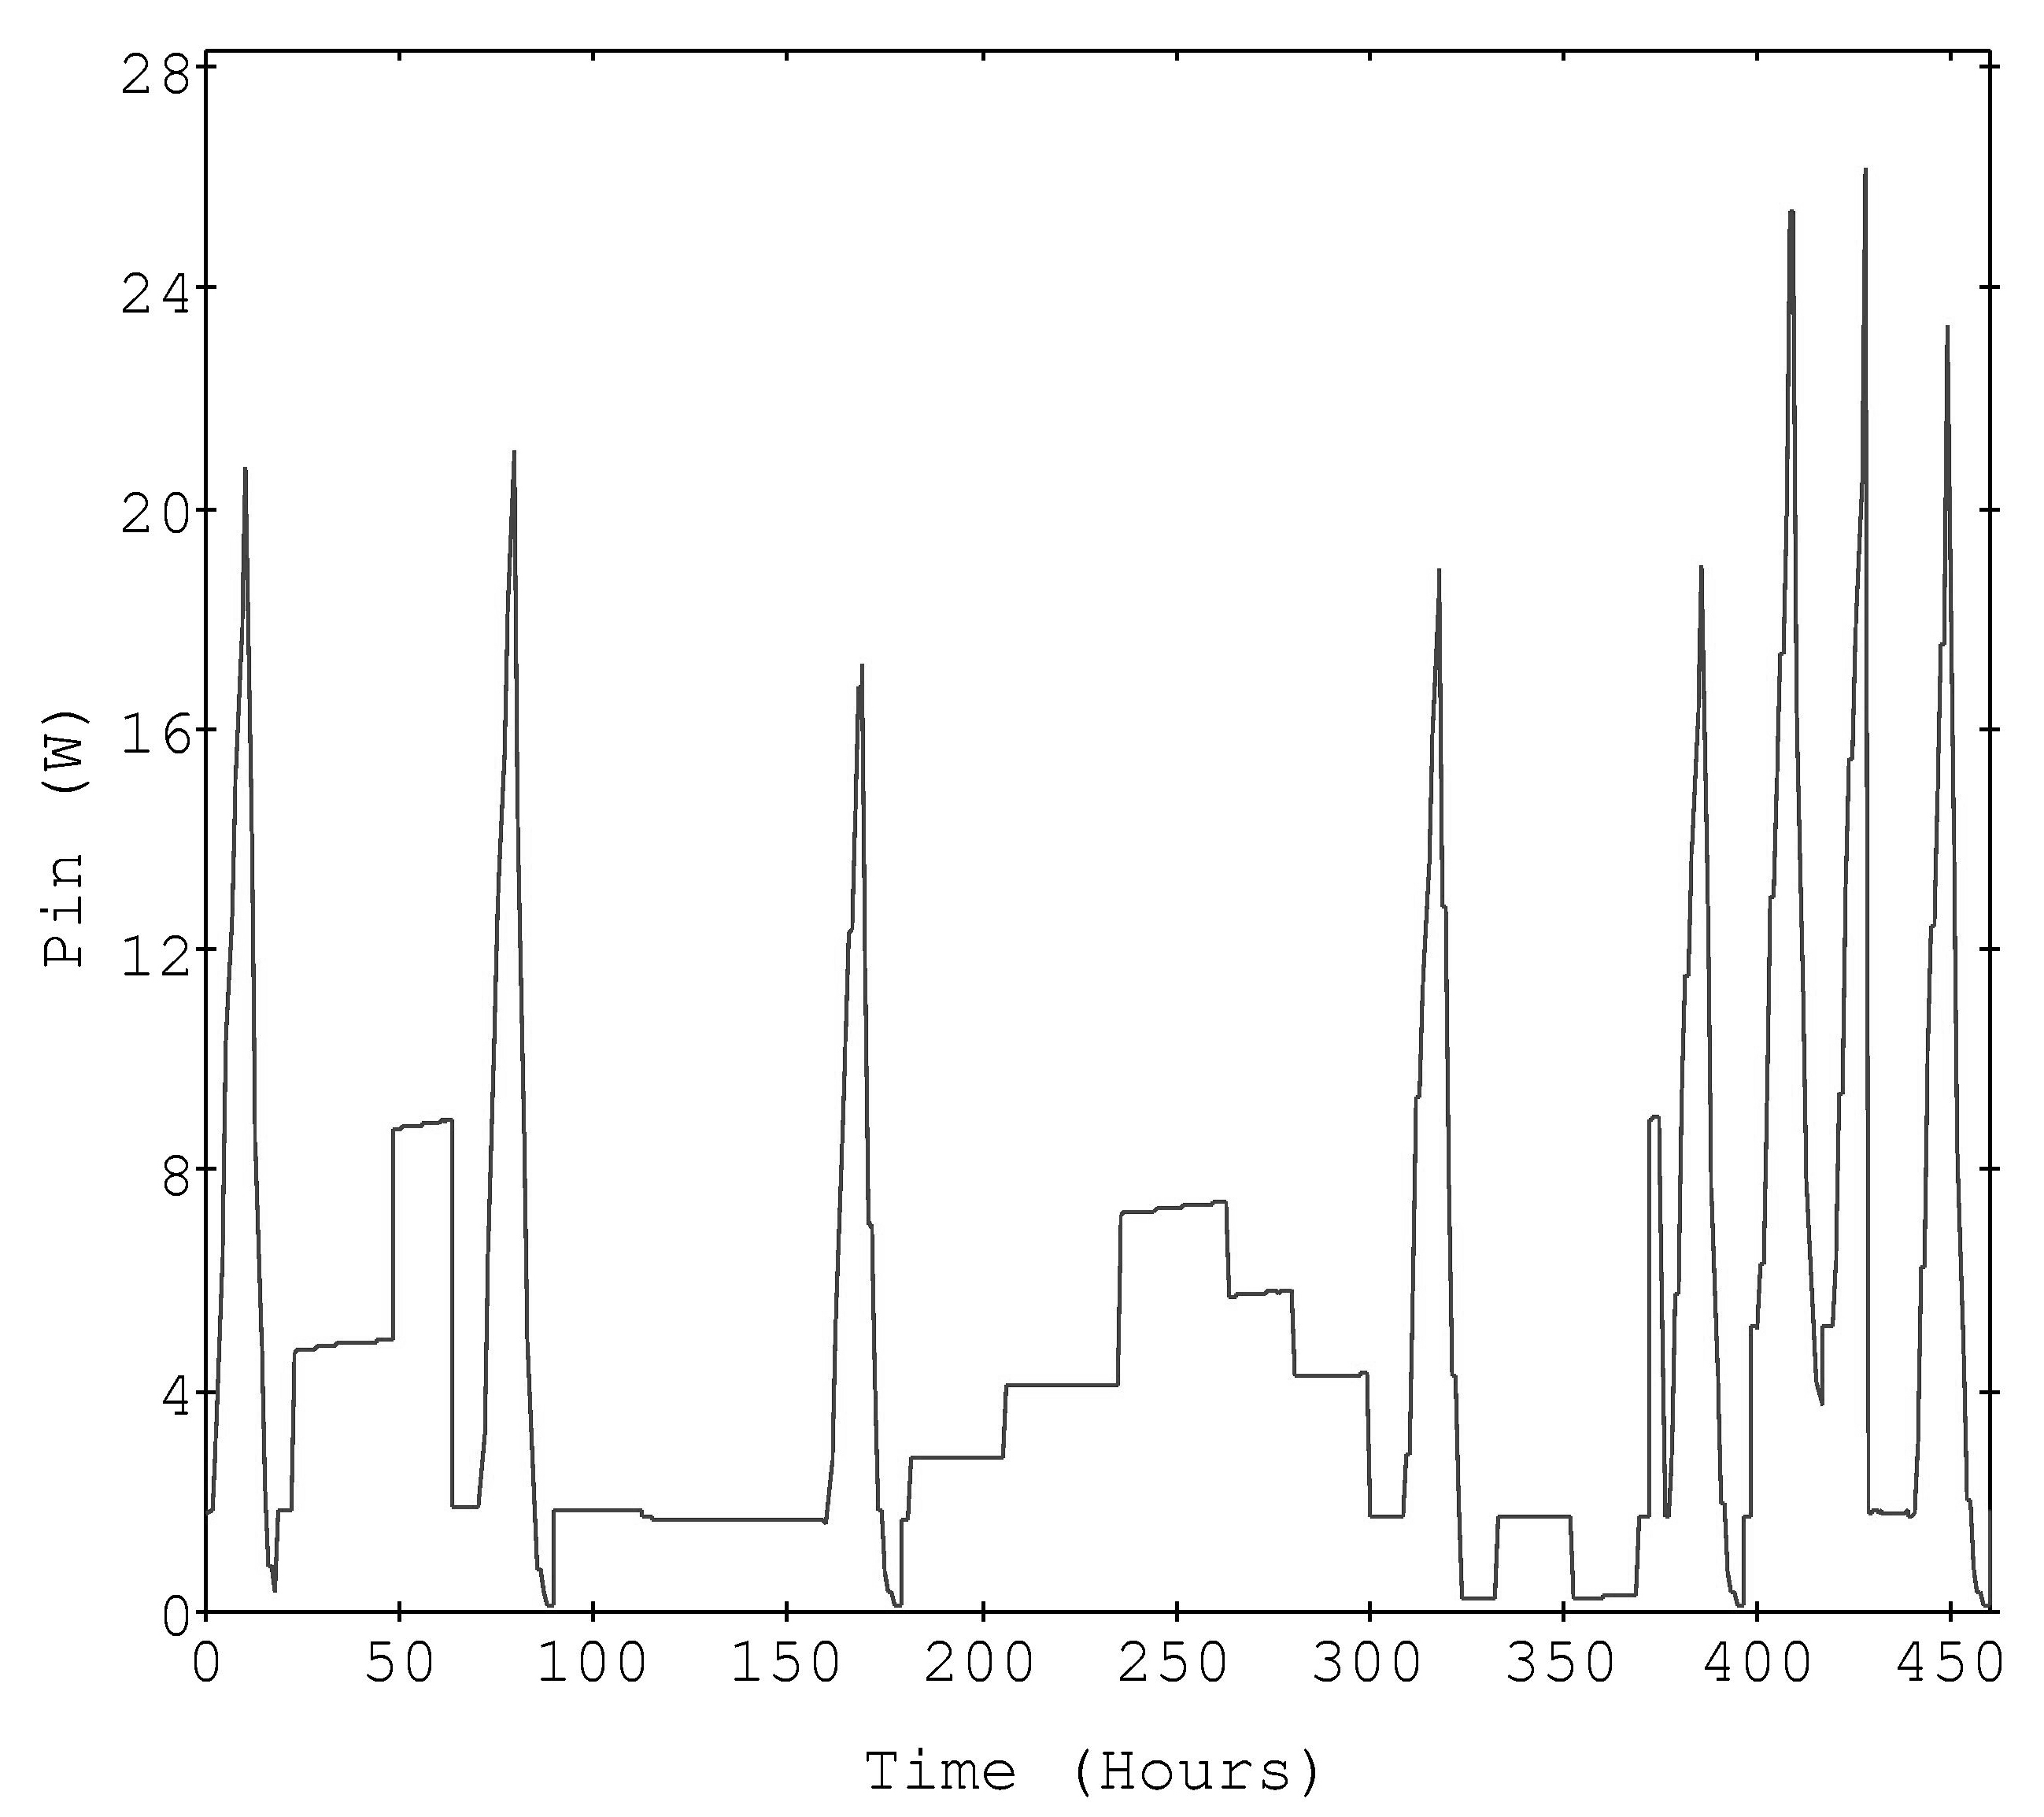
Figure 1 is the input power time profile of the 10 sweeps applied to the active Pt electrode derived by multiplying input current times cell voltage. The global calibration constants reported for the inert Pt electrode and the heater are shown in Table 1. Figure 2 shows the excess power computed via a global equation using m*Cp =0.0712 and b = 0.13, which was used in the data files[4].
Results and Discussion
Calibration data were not collected during the individual runs (current sweeps), so apparent calibration constants are computed by assuming the null result, namely power out should equal power in for each sweep. Once the speculative calibration constants are determined, they are compared to the actual resistive heater and inert Pt cathode calibration constants and to theoretical expectations. A key point is that the speculative constants must be reasonable, or the power balance assumption would be invalidated.
After assuming no excess power, the specific calibration constants for each individual current sweep (10 total) are computed by simple linear regression. Table 1 presents those constants and statistical fit quality measures, along with the reported resistive heater and inert Pt calibrations and two theoretical values. The theoretical values are the maximal and minimal pure water heat capacity at 20 and 34°C respectively for the 20-50°C range [8], which covers the variation in the calorimeter output temperature. The computed slopes (m*Cp term) are roughly centered about theoretical, as shown by the percent deviation from the 20°C theoretical value (Table 1), with a mean of –0.4% and a standard deviation of 1.5%.
Figure 2 shows the reported ('global') excess power curve [4,5,6] and the curve computed using the sweep-specific calibrations is shown in Figure 3. The power balance assumption and the fit quality leads to the expected reduced excess power in the latter case, statistically centered about zero excess power. It is of interest to note that the excess power peak structure has changed significantly by applying the sweep-specific calibration assumption. Now the largest features seem to be transients associated with peak input power points, possibly pointing to some other experimental problem. Also, the non-random shape of the residual peaks suggests that a slightly different form of the calibration equation might reduce the residual excess power even further.
The global calibration constants show some of the largest deviations from the theoretical values, thus excess power signals can be anticipated simply from this based on equation 5. The two sweeps that showed anomalously low excess power (third and sixth sweeps in the Figure 2) can be seen to have specific calibration constants very similar to the global one used.
Other parts of the experimental data may suggest possible causes of the divergence between the global and specific calibrations. The internal cell temperature profiles for the resistive heater calibration and the electrolysis sweeps are different. The difference between the top thermistor output and the bottom one varies systematically with input power. For electrolysis runs, at near zero Pin the difference is 0.1°C, while at peak input power (~26W), the difference increases to approximately 1.8°C. However, during the resistive heater calibration this differences increases to approximately 7°C for a 12.5 W input power, which scales to 14.5°C at 26 W. Clearly, a much stronger thermal gradient exists in the heater case, which may be a key to understanding a contributing factor in the constant's variation.
Conclusions
A potential systematic error in mass flow calorimetry has been described. It arises from the application of a global calibration equation to data where run-specific variation in that calibration exists. Equation 5 shows it to be a potentially significant error term, easily approaching the magnitude of many reported excess power signals.
Data presented by E. Storms to support the claim that platinum produces a P&F effect has been reanalyzed. Because no sweep-specific calibration data were recorded, the implied sweep-specific calibrations were computed based on the zero excess power assumption and found to be scattered about the theoretical expectations. The reported Pt electrode calibration constants also fall within that variation. Thus there seems to be nothing particularly unreasonable about the computed constants, suggesting that this interpretation of the data is as valid as any other.
The resulting excess power curve showed significantly reduced excess, but still contained residual signal. This is possibly due to one or more other factors, such as the need for a more sophisticated calibration model, other physical/chemical process affecting the apparatus, or perhaps the actual presence of an excess power source (of reduced magnitude). More sophisticated analysis was not attempted here, as it simply complicates this analysis without adding insight.
Therefore a simple reinterpretation produces the conclusions that the cell would seem to be close to power balance as expected, and the excess power detected by E. Storms was likely due to the systematic error involving calibration constant variation. The root causes of the calibration constant variation remain unclear. A significant difference in internal cell temperature gradients between the electrolysis runs and the resistive heater calibration is suggestive. Additional data must be acquired and further analysis performed before the claim of E. Storms that platinum shows evidence for cold fusion can be taken seriously.
Acknowledgment
This author gratefully acknowledges the helpful discussions of D. Bell, WSRC, Dr. D. Britz, Aarhus Universitet, S. Little, EarthTech International, Prof. W. B. Clarke, McMaster University, and Dr. E. Storms, Energy K. Systems. Dr. Storms is especially thanked for posting his drafts and data, and supplying the ICCF8 preprint. This work was supported by Westinghouse Savannah River Company, under the US DOE contract number DE-AC09-96SR18500
References
Figure 1. The experimental input power (Watts).
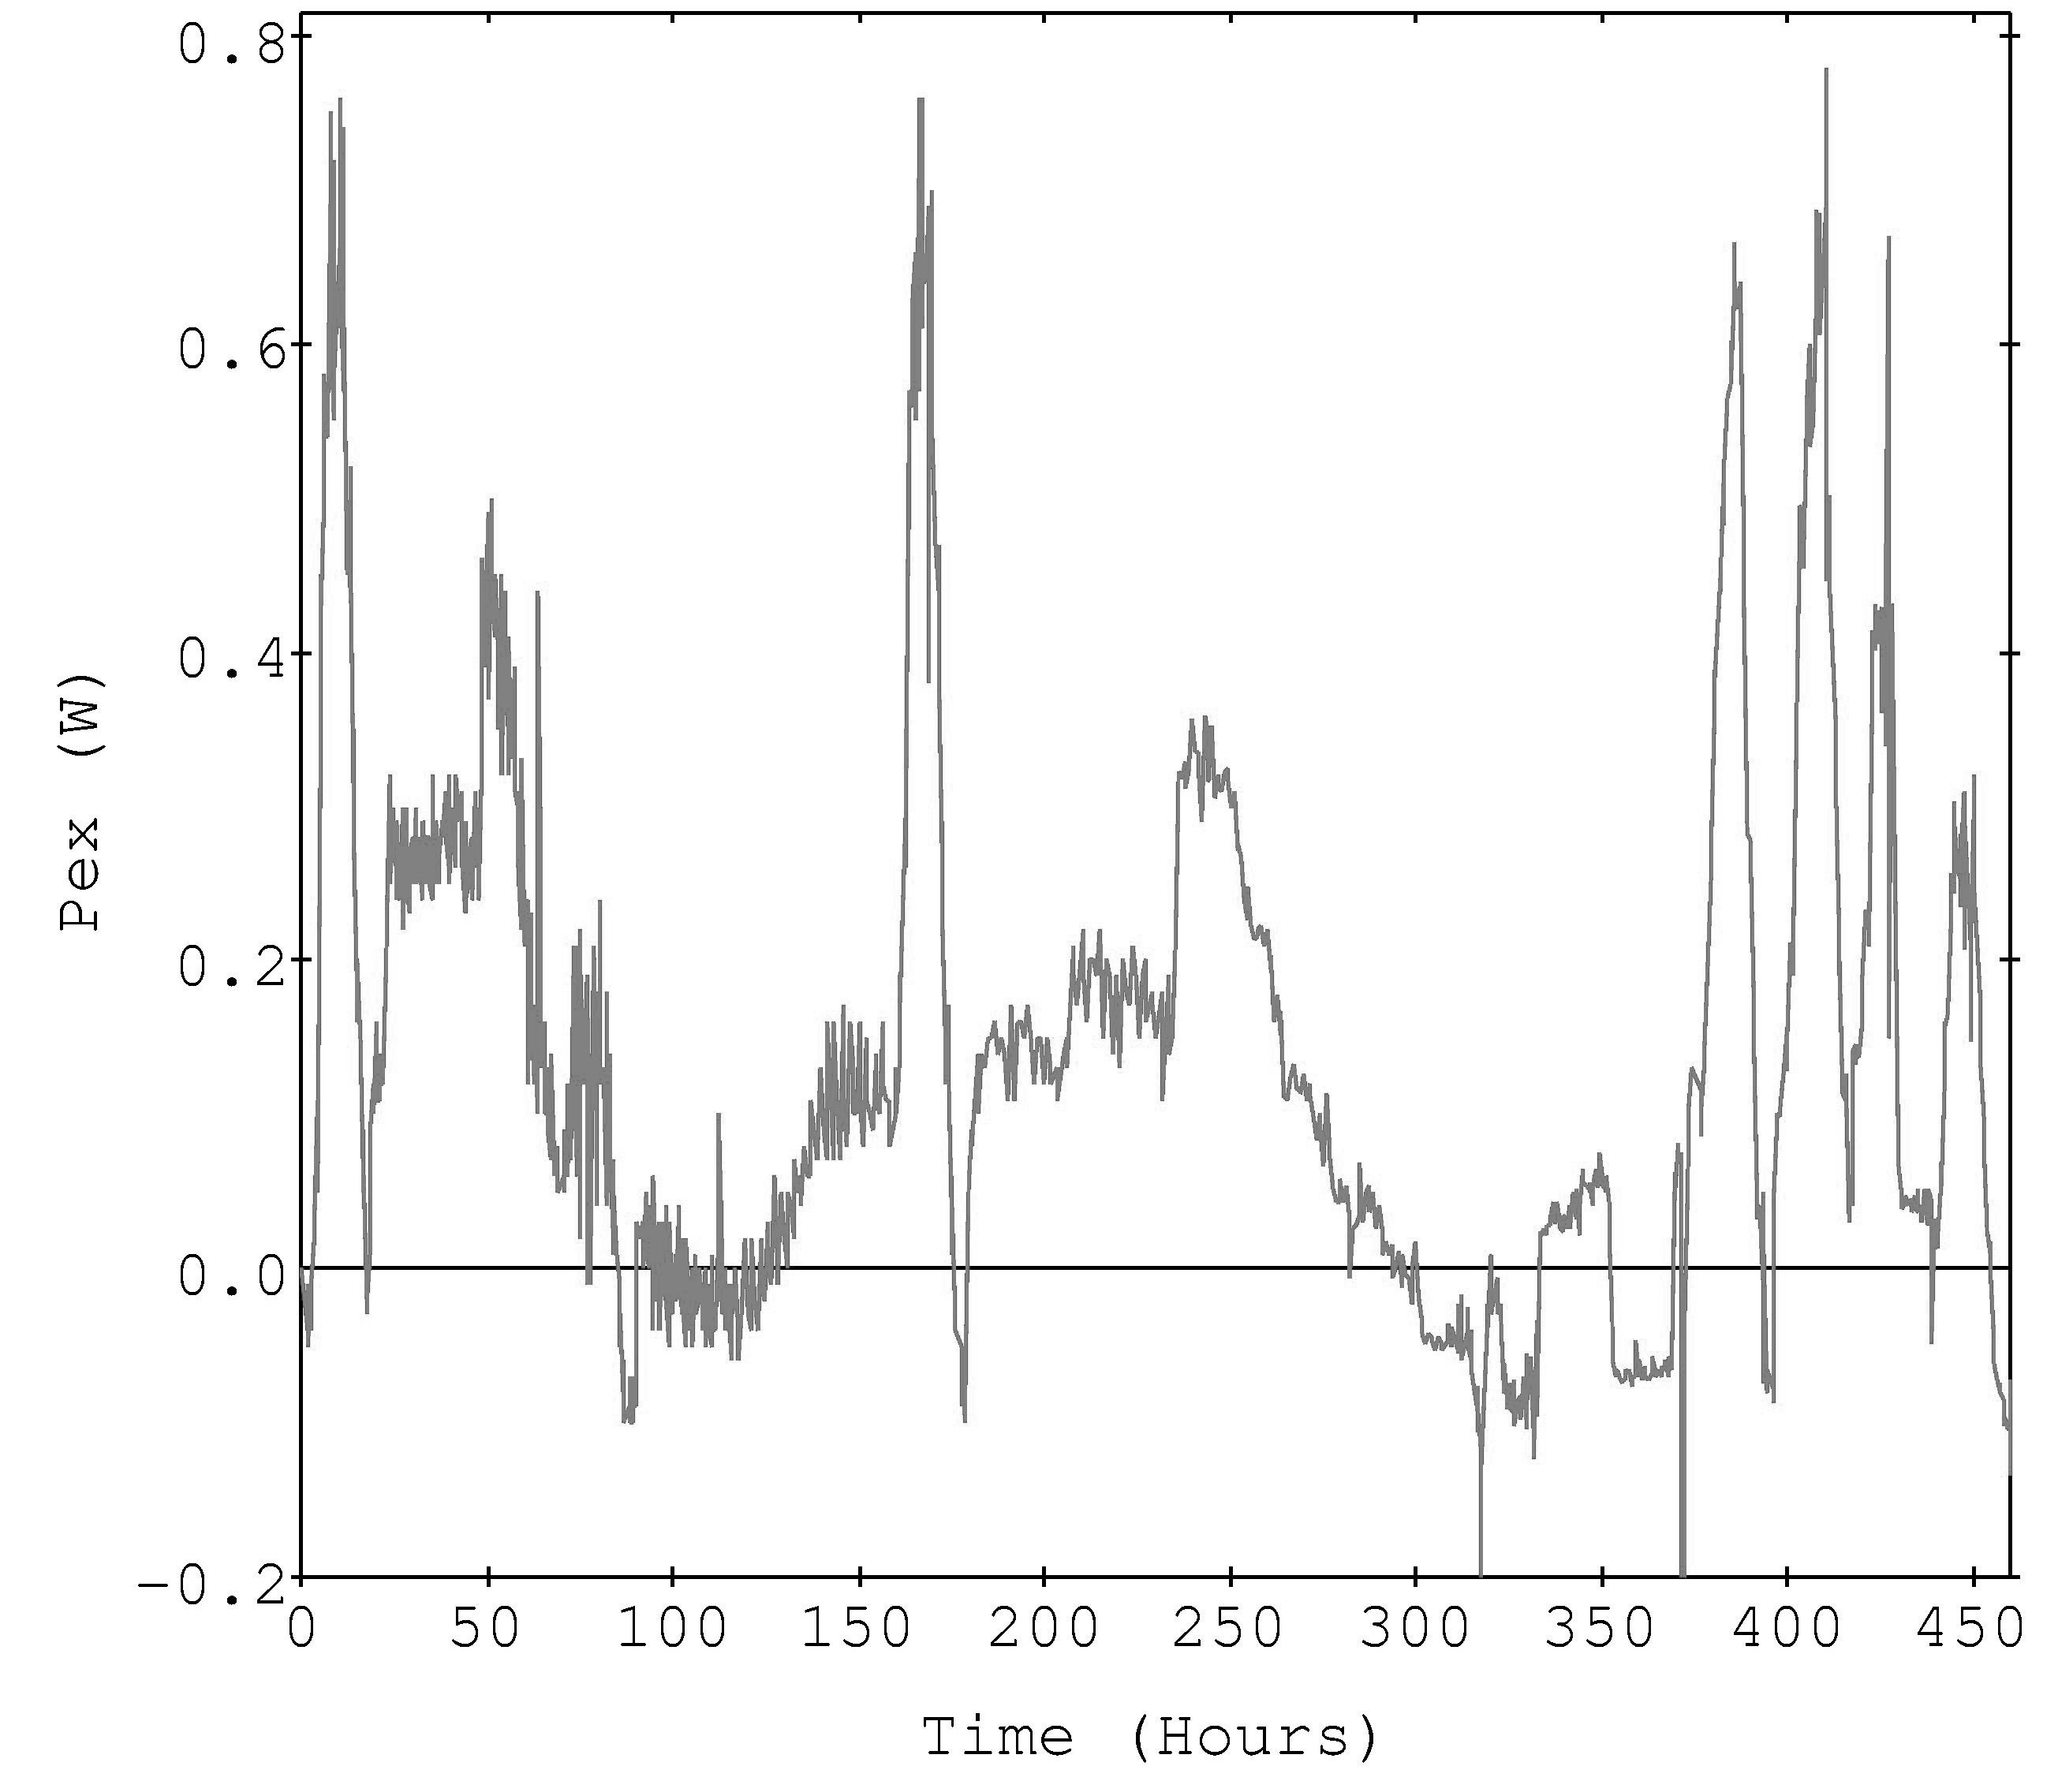
Figure 2. The reported excess power derived via a global calibration (Watts).
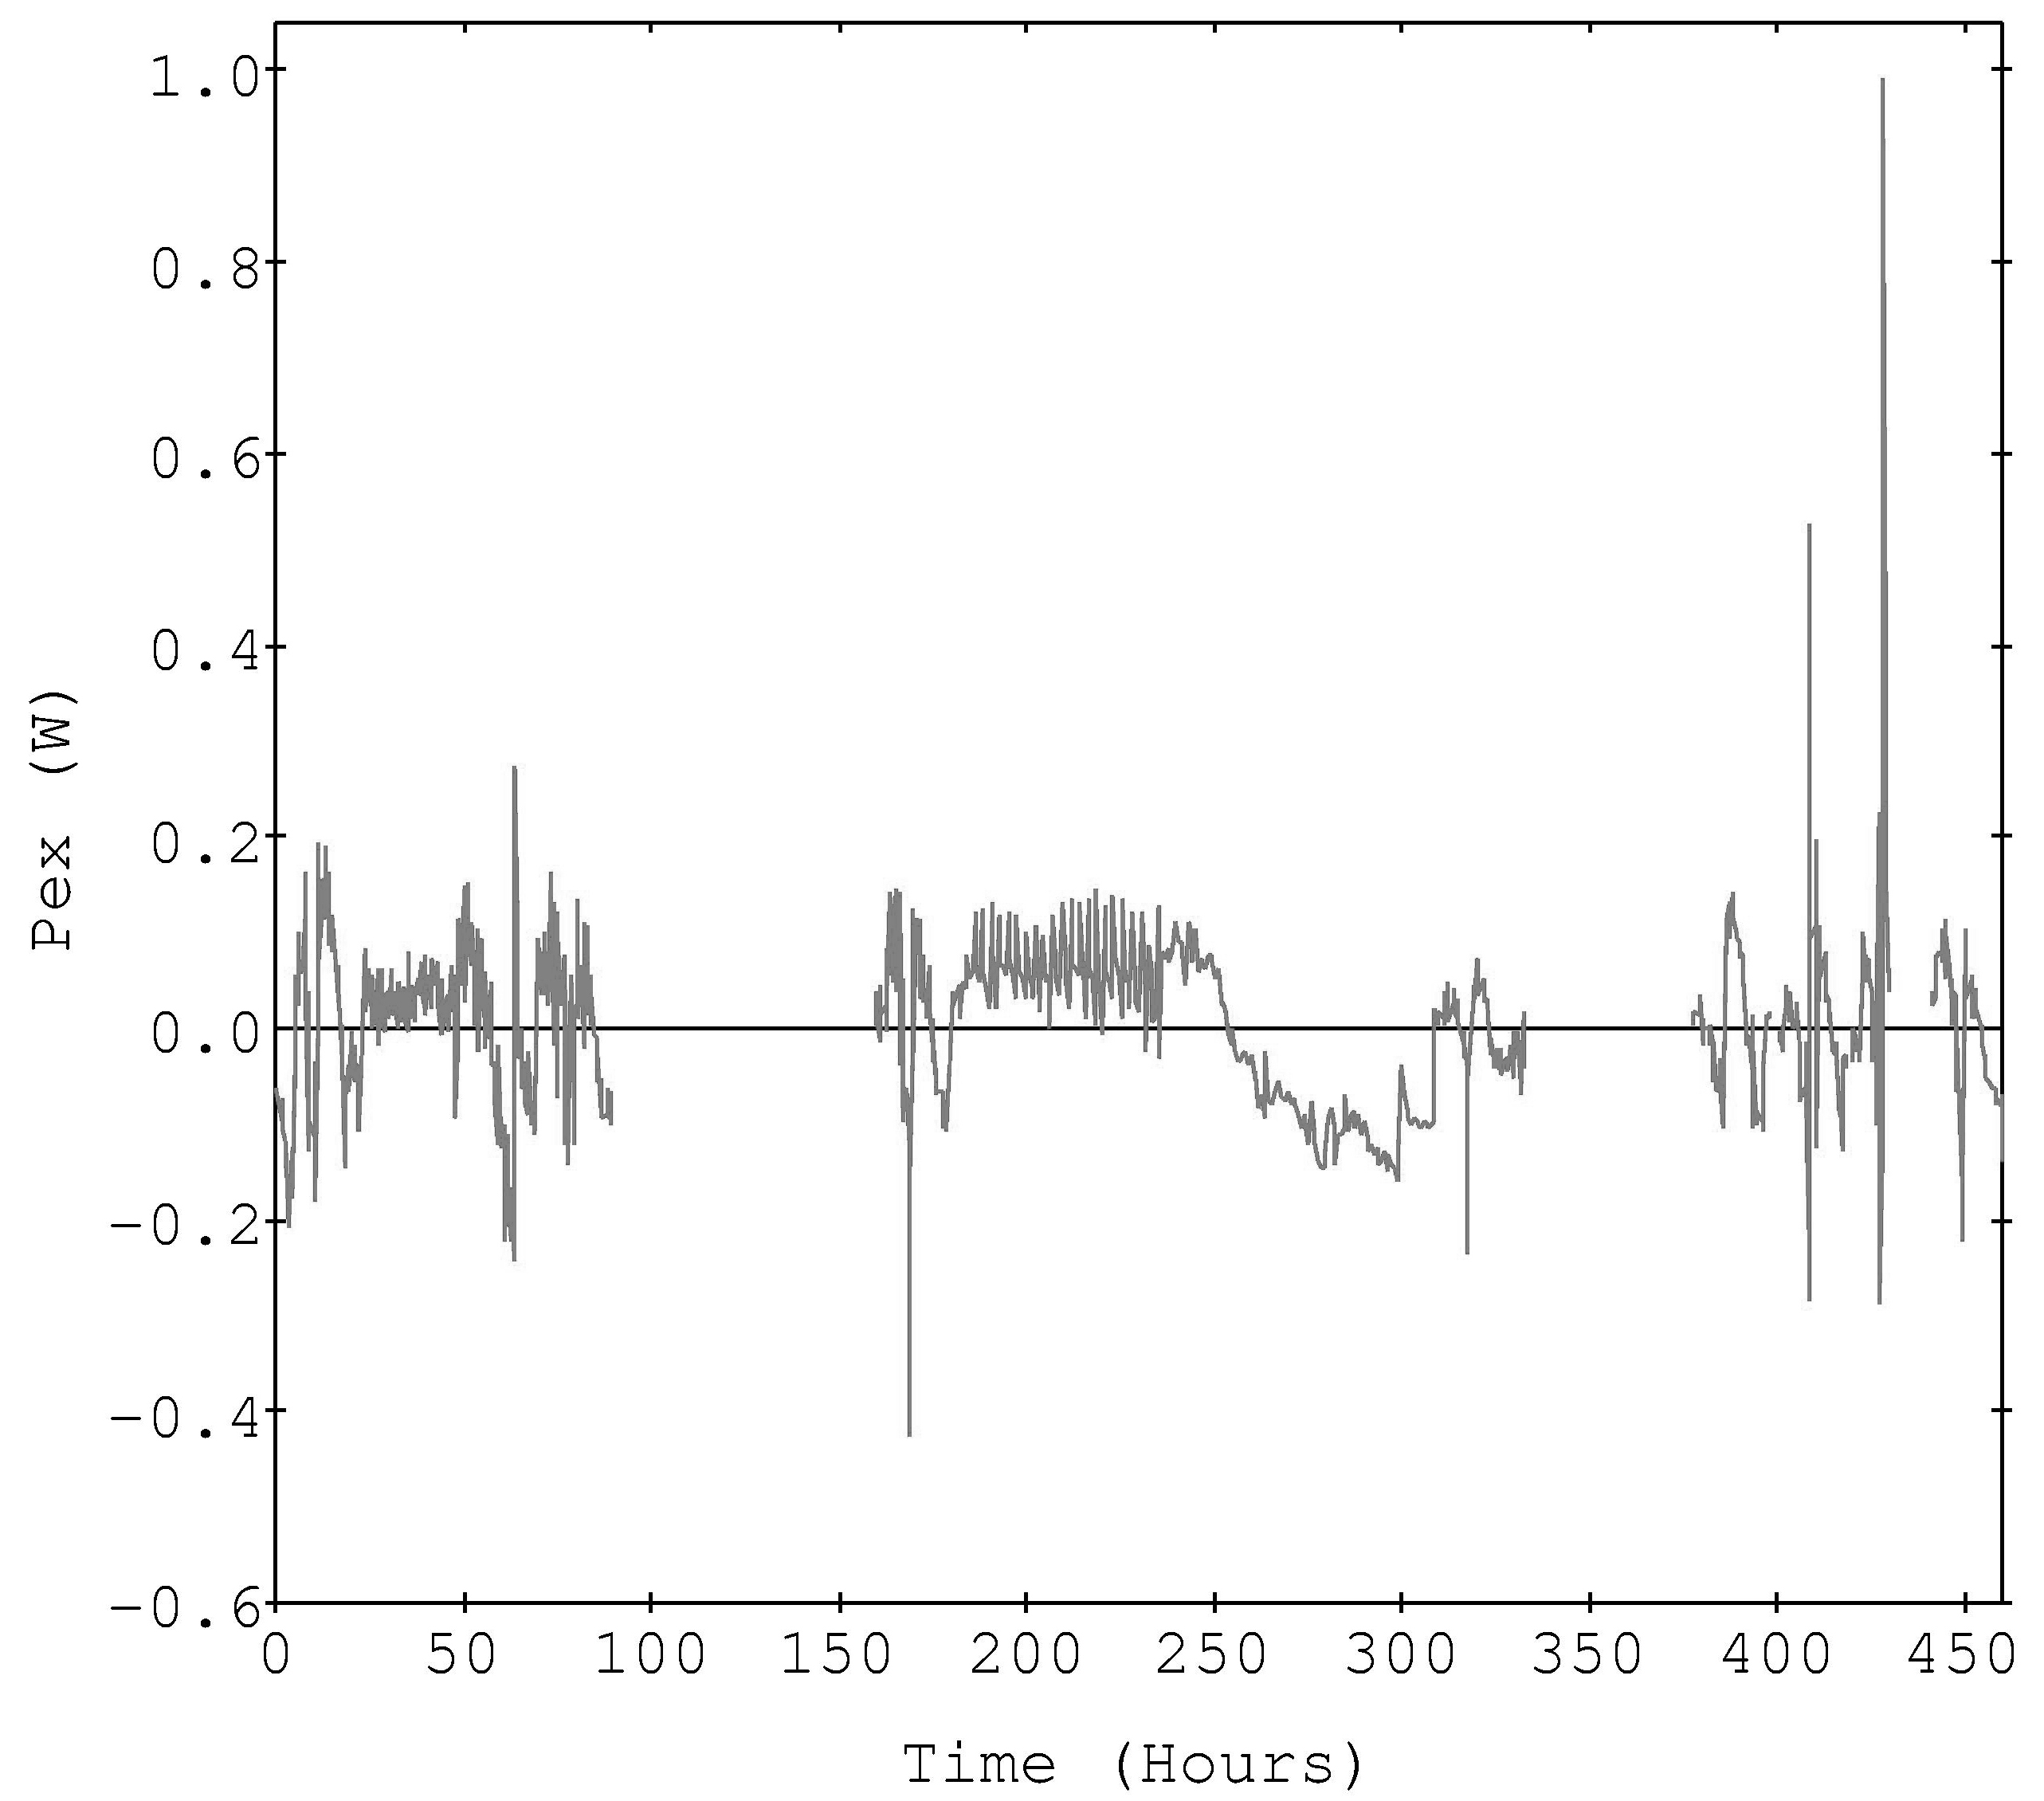
Figure 3. The excess power computed via individual
sweep-specific calibration equations
(Watts, breaks in the curve indicate unfit regions).
Table 1. Computed Run Specific Calibration Constants
|
Slope |
Intercept |
Multiple |
Std. Dev. Regr. |
% Dev. |
|
|
Sweep |
|||||
|
1 |
.068564 |
-.289437 |
.999738 |
.106 |
-1.63 |
|
2 (*) |
.069415 |
-.289437 |
.999048 |
.077 |
-0.41 |
|
3 (**) |
.070672 |
-.177146 |
.999875 |
.077 |
1.40 |
|
4 |
.067956 |
-.187765 |
.999728 |
.091 |
-2.50 |
|
5 (*) |
.068890 |
-.174754 |
.997721 |
.085 |
-1.16 |
|
6 (**) |
.071320 |
-.131471 |
.999950 |
.043 |
2.33 |
|
7 |
.068622 |
-.196223 |
.999870 |
.070 |
-1.54 |
|
8 |
.068751 |
-.166957 |
.999754 |
.101 |
-1.36 |
|
9 |
.069961 |
-.253006 |
.999811 |
.081 |
0.38 |
|
10 |
.070028 |
-.157767 |
.999906 |
.068 |
0.47 |
|
Storms |
|||||
|
Elec., Initial |
.071221 |
-.18317 |
2.19 |
||
|
Joule |
.072107 |
-.23893 |
3.46 |
||
|
Elec., Final |
.070892 |
-.14405 |
1.71 |
||
|
Theory |
|||||
|
at 20°C |
.069698 |
0 |
0 |
||
|
at 34-5°C |
.069637 |
0 |
-0.09 |
(*) Different Input Power Profile (**)Low Excess Power Reported