This report was prepared as an account of work sponsored by an agency of the United States Government. Neither the United States Government nor any agency thereof, nor any of their employees, makes any warranty, express or implied, or assumes any legal liability or responsibility for the accuracy, completeness, or usefulness of any information, apparatus, product or process disclosed, or represents that its use would not infringe privately owned rights. Reference herein to any specific commercial product, process or service by trade name, trademark, manufacturer, or otherwise does not necessarily constitute or imply its endorsement, recommendation, or favoring by the United States Government or any agency thereof. The views and opinions of authors expressed herein do not necessarily state or reflect those of the United States Government or any agency thereof.
This report has been reproduced directly from the best available copy.
Available to DOE and DOE Contractors from the Office of Scientific and
Technical Information, P. O. Box 62 Oak Ridge, TN 37831; prices available from
(423) 576-8401. Available to the public from the National Technical Information
Service, U.S. Department of Commerce, 5285 Port Royal Road, Springfield, VA
22161.
The objective of this study was to measure Hg-distribution coefficient (Kd values) for sediments located at the Ford Building Seepage Basin. Particular attention was directed at evaluating the effect of Hg concentrations, pH, and chloride concentrations on Hg-Kd values. Based on these studies, Reasonably Conservative Kd values and Likely Kd values were estimated for use in subsequent contaminant transport modeling. The laboratory tests were conducted with uncontaminated sediments collected from the FBSB: a sandy sediment from the upper sequence and a clay sediment from the lower sequence.
Reasonably Conservative and Likely Hg-Kd Values for the Ford Building Seepage Basin Site

These studies provide technically defensible evidence for employing Hg-Kd values appreciably greater than the present conservative values from the literature that commonly range between 0.1 and 10 mL/g. A number of issues were identified during these studies. Tests need to be conducted using uncontaminated local groundwater as the background solution to evaluate the effect of natural complex solutions on Hg-Kd values. Additional sediments need to be evaluated to provide an estimate of the variability associated with sediments. These additional tests will provide needed technical defensibility and will further improve modeling accuracy.
Depending on the redox condition of a sediment, Hg may occur in three oxidation states,
namely as Hg(0), Hg(I), and Hg(II). The Hg(0) and Hg(II) are the most common
states in nature and Hg(II) is the most likely state in unsaturated zones or
oxygenated surface waters (Lindsay 1971, Andersson 1979). In addition to the
redox potential, pH and Cl- concentrations are generally considered
to be key parameters in determining the speciation of Hg in the sediment
environment. Knowledge of the speciation of Hg is important in order to
explain the retention and mobility of this element in the subsurface.
The free ionic form of Hg(II), Hg2+, rarely exists in groundwater
because of its strong tendency to form complexes. Among the anions commonly
found in SRS groundwaters, OH-, Cl-, and humic matter,
are the most important ligands, forming Hg(OH)20,
Hg(Cl)20, and a Hg-humic matter complex, respectively.
The humic matter complex is not very well characterized (Steinnes 1990).
Mercury speciation is also affected by sulfide concentrations, especially under reducing conditions. Under strongly reducing conditions, Hg(II) converts to Hg(0), which is stable in the presence of H2S0 or HS-. At somewhat greater redox potential conditions, HgS will precipitate. Further increases in the redox status will bring about the oxidation of sulfide to sulfate, but at this point the potential is still not high enough to convert Hg(0) to Hg(II). Stated differently, sulfide has a lower standard reduction potential than Hg(0). Further rise in redox potential to levels commonly found in surface soils and in the vadose zone will transform Hg into the +2 state. A more detailed treatment of the physical chemistry of Hg in aqueous solutions is given by Hepler and Olofsson (1975) and Andersson (1979).
In general, only a small fraction of the total Hg(II) in sediments exists in the
interstitial waters and the remainder is sorbed to the sediment surfaces. The
extent to which Hg is sorbed by sediments is controlled by a number of factors,
including the chemical form of Hg, the grain size distribution of the sediment,
sediment mineralogy, humic substance concentrations, soil pH, and the redox
potential. Steinnes (1990) concluded that the adsorption process
dominated Hg removal from the aqueous phase under oxidized environments, and
the precipitation process dominated Hg removal under reducing environments (as
sulfides and selenides).
In oxidized SRS sediments, Hg sorption is likely to be dominated less by ion exchange, and more by surface complexation onto Fe-oxides, Al-oxides, and humic substances. Andersson (1979) reported the following sequence for the retention of inorganic Hg(II) under oxidizing, pH 7 conditions: Al(OH)3 < kaolinite < montmorillonite < illite < organic soils < Fe2O3-x nH2O. Of these minerals, only the following minerals are found to any appreciable extent on the SRS: Al(OH)3 (gibbsite), kaolinite, organic soils, and Fe2O3-x nH2O (generically referred to as Fe-oxides). The retention of Hg in an organic soil was not significantly reduced until pH <4 (Steinnes 1990). In sediments with a pH >5.5, Fe-oxides and clay minerals sorbed Hg more effectively. Maximum sorption generally occurred around pH 7, where HgOHCl0 was the dominant species (Andersson 1979). Also, organomercury compounds such as methylmercuric chloride and phenylmercuric acetate are strongly sorbed in sediments in the pH range around neutrality (Hogg et al 1979).
The speciation or even the oxidation state of the Hg in the waste is not known.
Based on the process chemistry that occurred at the Ford Building, Hg could
have been either in the +2 or 0 oxidation state (WSRC 1999a). Eventually the
Hg would be converted to Hg(II) because the basin is in a generally oxidizing
condition. However, even if Hg(0) is present, it is not known whether
sufficient time has passed to permit it to convert to Hg(II). TCLP analyses of
the sludge indicated that it contained 995 µg/L Hg (Table 2 in WSRC
1999b). Containerized soils remaining in the operating unit contained between
199 and 737 µg/L Hg (Table 1 in WSRC 1999b).
No in depth studies have been conducted to elucidate Hg geochemistry in SRS sediments (Krvartek et al. 1994). Thus, the expected Hg geochemistry at SRS is based on non site-specific literature, as discussed briefly above. The background Hg in the surface and near surface environment of the Ford Building Seepage Basin (FBSB) will likely exist in the +2 oxidation state. Very little of the Hg will exist as the free ion species, Hg2+. Instead, it will form strong complexes with either Cl-, organic matter, or OH-, the extent of which will depend on the concentration of each ligand. Based on simple observations of cores collected for this study from the FBSB, there appears to be very little organic matter in these sediments. Thus, Hg-humic substance complexes are not likely to be important in this system. More Hg is expected to be associated with the sediments than the mobile aqueous phase. The most important sorbing phases will be Fe-oxides; gibbsite and kaolinite will play relatively less important roles as Hg sorbents.
The objective of this study was to measure Hg-Kd values for sediments located at the Ford Building Seepage Basin. Particular attention was directed at evaluating the effect of Hg concentrations, pH, and Ionic Strength/Chloride concentrations on Hg-Kd values.
The intent of these studies was to measure Hg-Kd values under a wide range of conditions and not to provide mechanistic understandings of the Hg sorption to these sediments. Two subsurface sediments collected from the FBSB site were evaluated: a sandy sediment (a composite from 10.5 to 12 ft depth) and a clay sediment (a composite from 32 to 36 ft depth). These sediments were selected to represent the two main stratigraphic zones at the FBSB site. Three laboratory experiments were conducted: the Hg Isotherm Study, pH Study, and Ionic Strength/Chloride Study. The Hg Isotherm Study evaluated the effect of Hg concentration on sorption and provided important information as to whether Hg sorption is linear, i.e., whether the Kd construct was appropriate. The pH Study, as the name implies, evaluated the effect of 3 pH levels on Hg sorption. The Ionic Strength/Chloride Study was conducted by adding sodium chloride concentrations and therefore, as chloride concentration increase, so did the solution ionic strength.
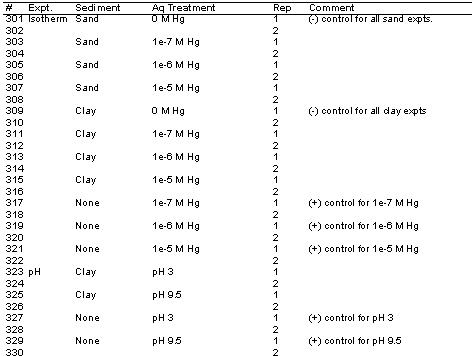
Three laboratory experiments were conducted: the Hg Isotherm Study, pH Study, and Ionic Strength/Chloride Study. The Hg Isotherm Study had the following experimental factorial:
(4 [Hg] x 2 reps x 2 sediments) + (1 no sediment [+]-control x 2 reps x 3 [Hg]) = 22 treatments
The pH Study had the following experimental factorial:
(3 pH x 2 reps x 1 sediment) + (1 no sediment [+]-control x 2 reps x 3 pH) = 12 treatments
The Ionic Strength/Chloride Study had the following experimental factorial:
(3 IS/Cl x 2 reps x 1 sediment) + (1 no sediment [+]-control x 3 FA x 2 reps) = 12 treatments
Only 2 replicates were conducted for each treatment. This is less than what is generally run for Kd values, however, given the scope, resources, and schedule, it was decided that it would be better to include more treatments than replicates. Consequently, measured Kd value variability was slightly higher than usual.
Jay Noonkester of the Environmental Restoration Technology Group within SRTC collected the two sediment samples. The samples were collected with a cone penetrometer from the Ford Building in N-Area, adjacent to well HXB-4D. The first sample was taken from 10.5 to 14.5 ft. below ground surface. Approximately 37% recovery was obtained from a 1.5-ft long sample (interval 10.5 to 12 ft below ground surface). The second sample was taken from 32 to 36 ft below ground surface with 100% recovery. The upper sediment is referred to in this study as the sand sample and the lower sediment as the clay sample. The samples were dried at 105°C, homogenized, and then stored in plastic bags at room temperature.
Batch sorption experiments based on ASTM method D 4319 (ASTM 1984) were used in this
study. A detailed description of the method and the solutions made for these
tests are presented in Appendix A. A brief description of the procedure used
in this study follows.
Approximately 0.35-g sediment was placed in a 40-mL centrifuge tube. The
sediments were then preequilibrated with 3 2-hr washes of 0.02 M
NaNO3, the background solution. Preequilibration of the sediments
prior to conducting sorption tests has been shown to be essential. Reactions,
not of interest to the Kd measurement, such as precipitation, may occur as a
result of the solution and sediment not being in equilibration. The only
solute that should be out of equilibrium during a sorption experiment is the
solute of interest, in this case, the Hg. The 0.02 M NaNO3 solution
was selected as the background solution because it is largely non-reactive with
Hg2+ and the SRS groundwater has an ionic strength of approximately
0.02 M. The sediments in the pH Study required additional equilibration after
the 0.02 M NaNO3 washes. They had to also be equilibrated to pH 3.1
and 9.3. The pH adjustment of the sediments was accomplished by adding, twice
a day, either HNO3 or NaOH. After three days of pH adjustments,
little change in pH was observed. Due to schedule limitation, we did not
establish whether steady state conditions were obtained.
After preequilibration, 35-mL of a 0.02 M NaNO3 solution containing the Hg and the treatment (pH or Cl) was added. The soil-water suspensions were placed on a platform shaker for a week. After equilibration, the samples were centrifuged and then passed through a 0.45-µm filter. The filtrates were then analyzed for Hg concentration by Atomic Absorption techniques. The Hg concentration data were then used in Equation 1 to calculate Hg-Kd values. Equation 1 accounts for the dilution of the initial Hg spike solution by the interstitial water remaining in the sediment after the final preequilibrating wash (i.e., the unspiked water left in the tube after washing):

where Vinterstitial is the volume of the interstitial solution left after the third pre-equilibration wash (L), Msed is the sediment mass (g), Vinitial is the volume of the Hg-amended solution added to the sediment (L), Cfinal is the Hg concentration in the solution after contact with the sediment (µg/L), and Cinitial is the Hg concentration of the Hg-amended solution (µg/L) added to the solids.
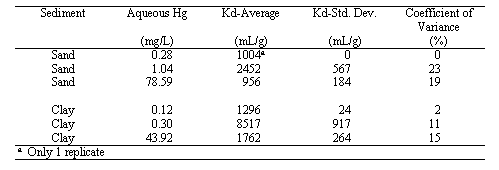
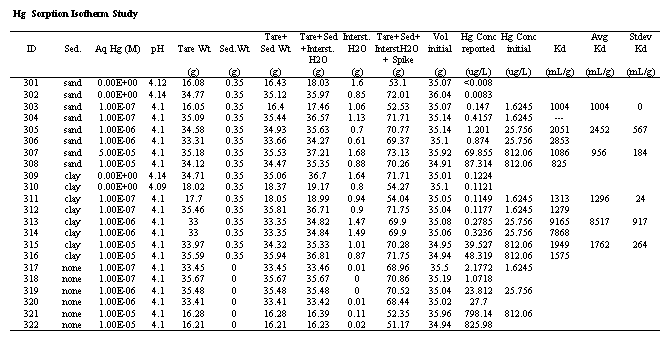
The results from the Hg Isotherm Study are presented in Table 1. Perhaps the most important finding of this study is that the Kd values ranged from 956 to 8517 mL/g and had an average of 2664 mL/g. These values are orders of magnitude greater than the conservative Kd value presently being using in Hg migration calculations, 0.1 to 10 mL/g. These values are consistent with previously reported Hg Kd values of a wide variety of non-SRS sediments (Yin et al. 1996, Yin et al. 1997). The sand samples, located in the upper region of the vadose zone, tended to have lower values than the clay samples. The trend of the Kd values with the aqueous Hg concentrations is similar for both the sand and the clay samples; it increases and then declines as the aqueous Hg concentrations increase. This trend is not readily explainable. Typically, Kd values either remain constant or decrease as the aqueous Hg concentration increases. The decrease in Kd values is usually attributed to saturation of adsorption sites, and is indicative of nonlinear sorption behavior in the Hg concentration range investigated. A constant Kd value indicates that sorption behavior is, in fact, linear throughout the range investigated.
Table 1. Hg-Kd Values as a Function of Equilbrating Aqueous Hg Concentrations.

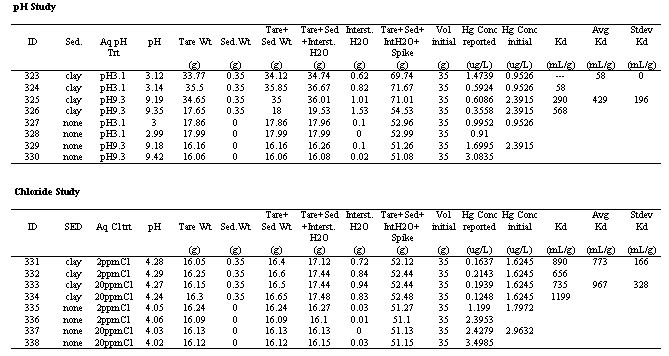
pH values had a significant influence on Hg Kd values. Several other researchers have shown a strong dependency of Kd value on pH (reviewed by Andersson 1979). The values ranged from 58 to 1296 mL/g. At the two extreme pH levels, the Kd value decreased. Hogg et al. (1978) reported a similar trend, with the maximum Hg sorption occurring between pH 5 to 8. Evaluating more alkaline pH levels, Andersson (1979) reported that Hg sorption to bentonite decreased ~50% between pH values of 5 to 7; Hg sorption to FeO3-nH2O decreased ~90% between pH values of 4.7 and 6.6; and Hg sorption to an illitic soil decreased ~70% between pH 4.6 to 6.8. Importantly, the Kd value in the pH 3.1 system was the lowest value measured in the three studies conducted for this project, 58 mL/g.
Table 2. Hg-Kd Values as a Function of pH

The influence of chloride concentration (and ionic strength which was a covariant in this study) on Hg Kd values is presented in Table 2. The Kd values slightly declined as the amount of chloride in solution increased from 0 to 2 mg/L. Little or no significant difference in Kd values was observed between the Kd values of the 2 and 20 mg/L Cl- treatments. Previous work has shown that the effect of Cl- concentration on Hg sorption is dependent on the concentration of organic matter in the sediment (Yin et al. 1996). Yin et al. (1996) reported no effect of Cl on Kd values measured in sediments containing 11 and 31 g/kg organic matter (at pH 3, 6.5 and 10). However, in a sediment that contained only 3 g/kg organic matter, they observed a 45% decline in Hg absorption as the Cl- concentration increased from ~3 to 30 mg/L. The organic matter concentration of the clay sediment used in this study was not measured, however, it appeared to be very low, perhaps <2 g/kg. Thus, the dependency of Hg sorption on Cl- for this low organic matter sediment is consistent with the findings of Yin et al (1976).
Table 3. Hg-Kd Values as a Function of pH

One of the objectives of this study was to make recommendation for Reasonably
Conservative Kd Values and Likely Kd Values based on the experimental data. The
Reasonably Conservative estimates are meant to reflect the lowest values that
would be encountered and the Likely estimates reflect what we believe are the
true Kd values in the system. The experimental data showed that the Kd values
varied depending on pH and to a lesser extent on Cl- concentrations.
Variations in Kd values based on aqueous Hg concentration were not conclusive.
Thus, in order to make recommendation for Reasonably Conservative and Likely Kd
values, it is necessary to make some assumptions about the environmental
conditions beneath the FBSB. It is anticipated that the background chemistry
(the chemistry of groundwater other than the contaminants, e.g., Ca, Mg, K, Cl,
pH ) of the plume emanating from the Ford Building Seepage Basin will not vary
greatly from the chemistry of natural groundwater in this region. There are
two reasons to support this assumption. The first reason, is that very little
waste was introduced into the basins. Only 1,437,912 L (380,400 gal) of waste
was introduced into the 37m by 24 m basins (WSRC 1999a). Assuming that the
water table is ~44 m below the seepage basin floor (WSRC 1999a), and the
porosity is 0.5, the waste volume is <10% of the total pore volume in the
sediment located between the seepage basin and the water table.[1] Thus, after only a couple of years, it is anticipated that
rainwater would greatly dilute the background constituents to levels that would
approach that of uncontaminated groundwater.
The second reason, albeit less compelling, for believing that the plume
background chemistry will be similar to natural groundwater chemistry is that
the waste had to be treated before it could be released into the seepage basin.
There were several criteria that the waste had to meet before disposal to the
seepage basin, including the pH had to be >3 and <12, the conductivity
had to be <1,400 µmhos/cm, Hg had to be < 2 µg/L, and
Cl- had to be <250 µg/L (Table2.1-1 in WSRC 1999a).
Based on the experimental data and the assumption that the background chemistry of the plume approaches that of uncontaminated groundwater, Reasonably Conservative Hg-Kd Values and Likely Hg Kd values were estimated (Table 4).
Table 4. Reasonably Conservative and Likely Hg-Kd Values for the Ford Building Seepage Basin Sitea

[1] (380,400 gals)(3.78 L/gal)(1e-3
m3/L) = 1,438 m3 waste introduced into the FBSB.
(37m x 24m x 44m)(0.5) = 19,092 m3 pore space between the seepage
basin and the water table, assuming a porosity of 0.5.
1,438 m3/19,092 m3 = 0.08 ratio of waste volume to pore
volume.
These studies provide technically defensible evidence for employing Hg-Kd values appreciably greater than the present default values. A number of issues were identified during these studies. Tests need to be conducted with uncontaminated groundwater as the background solution to evaluate the effect of naturally complex solutions on Hg-Kd values. Additional sediments need to be evaluated to provide an estimate of Hg Kd variability between sediments. Tests with more than 2 replicates need to be conducted to reduce the measured variability. These additional tests will provide needed technical defensibility and will improve modeling accuracy.
Anderson, A. 1979. Mercury in Soils. pp. 79-112. In: The Biogeochemistry of Mercury
in the Environment, J. O. Nriagu (ed.). Elsevier, Amsterdam.
ASTM. 1984. Standard Test Method for Distribution Ratios by the Short-Term
Batch Method D 4319-83. Annual Book of ASTM Standards, Vol 04.08.
Hepler, L. G., and G. Olofsson. 1975. Mercury: Thermodynamic Properties,
Chemical Equilibria, and Standard Potentials. Chem. Rev. 75:585-602.
Hogg, T. J., J. W. B. Stewart, and J. R. Bettany. 1978. Adsorption of
Organomercury Compounds to Sediments. J. Environ. Qual.7:440-448.
Kvartek, E. J., W. H. Carlton, M. Denham, L. Eldridge, MN. C. Newman. 1994.
Assessment of Mercury in the Savannah River Site Environment. WSRC-TR-94-0218.
Aiken, SC.
Lindsay, W. L. 1971. Chemical Equilibria in Soils. John Wiley & Sons, New
York. pp. 343-363.
Steinnes, E. 1990. Mercury. pp. 222-236. In: Heavy Metals in Soils, B. J.
Alloway (ed.). John Wiley & Sons, Inc., New York.
WSRC. 1999a. RFI/RI with BRA for the Ford Building Seepage Basin (904-91G)
Operable Unit. WSRC-RP-98-4096, Rev.0. February 1999. Aiken, SC.
WSRC. 1999b. Post Removal Action Report for the Ford Building Seepage Basin
(904-91G) Operable Unit. WSRC-RP-98-4226, February 1999. Aiken, SC.
Yin, Y, H. E. Allen C. P. Huang, and P. F. Sanders. 1997.
Adsorption/desorption Isotherms of Hg(II) by Soil. Soil Sci. 162:35-45.
Yin, Y., H. E. Allen, Y. Li, C. P. Huang, and P. F. Sanders. 1996. Adsorption of Mercury(II) by Soils: Effects of pH, Chloride, and Organic Matter. J. Environ. Qual. 25:837-844.
Table A1. Experimental design for Hg-Kd Study of FBSB sediments.


