WSRC-TR-2002-00506
Results of Sample Analysis from Solids Removed from Tank 50H
W. R. Wilmarth,
C. J. Coleman, F. F. Fondeur,
V. H. Dukes, M. P. Bussey, M. S. Blume, and A. V. Bowman
Westinghouse Savannah River Company
Aiken, SC 29808
Summary
Samples of solids were removed from Tank 50H during October of 2002 and sent to the Savannah River Technology Center for analysis. The results of the analyses showed the following.
- Solid phases agree with material (sodium oxalate and cancrinite) found in ETF with additional constituents like high-fired components (quartz and cristobalite)
- Radioactivity levels are low as expected for Saltstone feed and meet ETF acceptance criteria for alpha activity.
- Trace levels of organic constituents from ITP were found (benzene and tetraphenylborate) with sodium tetraphenylborate present at ~ 0.1 wt %.
- Thermal analysis shows exothermic behavior at ~ 400°C under N2 atmosphere.
- Organic analysis shows 0.2 wt % branched alkyl benzenes. Potential sources include scintillation cocktail, resin fragments or possibly detergents.
Keywords: Oxalate, Aluminosilicate, Tetraphenylborate
Background
Decontaminated liquid waste at the Savannah River Site is grouted for disposal in the Saltstone Facility. Tank 50H serves as a staging tank and routinely transfers supernate to the Saltstone feed tank. During October of 2002, the mass balances for transfers from Tank 50H to Saltstone started to show discrepancies. On October 22, 2002, the differences in mass balance between the two facilities exceeded a preset value of 10%.
At that time, High Level Waste Operations personnel inserted a video camera into the riser nearest the discharge point to Saltstone and observed a mound of solids. Subsequent to that observation, an inspection in the opposite (northeast) quadrant of the tank revealed a second mound of solids. A decision was made to sample the northeast mound1 and sent to the Savannah River Technology Center for analysis. This report documents the results of that analysis.
Experimental
Three core samples were sent to SRTC and the samplers (labeled as TK50-HTF-E-195, TK50-HTF-E-196, and TK50-HTF-E-197) were placed in a radiochemical hood. A photograph of the sampler is shown in Figure 1. Figure 2 shows a photograph of the three samples removed from their sampler. The measured density of the solids was 1.8 g/mL.
The solid phase was collected and analyzed. The X-ray diffraction (XRD) patterns were obtained with Cu Ka radiation on a Bruker Axs, Inc. instrument with a Siemens D500 goniometer. Scanning electron micrographs (SEM) and energy dispersive spectra (EDS) were obtained using the following instruments: Cambridge Stereoscan 250 Scanning Electron Microscope, Tracor Northern Energy Dispersive X-ray Analyzer and Mirocspec Wavelength Disperive Analyzer. Portions of the solid samples were analyzed using Differential Scanning Calorimetry (DSC) and Thermal Gravimetric Analysis (TGA). Samples were placed in an Instrument Specialist Incorporated 550E DSC. About 10 to 20 mg of material was placed in the calorimeter and was heated at 10° C/minute from 25°C to 600°C. The temperature rise or depression in the sample was monitored and converted to energy via calibration standards. Over a similar temperature range, the weight loss of samples was determined in a DuPont V5.1A TGA equipment. About 20 to 40 mg of sample was placed in the TGA and it was heated 10°C/minute from 25°C to 1000°C.

Figure 1. Photograph of Sampler
Elemental metals measurements were performed, based on atomic emission from excited atoms and ions, using Applied Research Laboratories, Model Number: 3580 inductively-coupled plasma atomic emission spectrometer (ICP-ES). Organic analysis was performed by gas chromatography/mass spectrometry using a Hewlett Packard model 5973 mass selective detector with a model 6890 gas chromatograph and chromatography/mass spectrometry using a Hewlett Packard model 5971 mass selective detector with a model 5890 gas chromatograph.
Figure 2. Photograph of Solids from Tank 50H
Gamma analysis used an aliquot of the sample and was analyzed by gamma spectroscopy analysis using a high purity germanium detector. Strontium-90 separation and analysis, performed using an aliquot of the sample, was performed using an Eichrom Sr-Spec based extraction procedure. A Sr-90 spiked blank, as well as a Sr-90 spiked sample, was analyzed with the sample batch to establish Sr-90/Y-90 counting efficiencies and Sr chemical recoveries. Once the extractions were complete aliquots of the resultant Sr-90/Y-90 containing extracts mixed with liquid scintillation cocktail were counted in the ADS Radiochemistry Counting Facility. The samples were counted on a Packard Instruments liquid scintillation counter.
The plutonium separation and analysis, performed using an aliquot of each sample, was subjected to a thenoyltrifluoroacetone (TTA) separation. An aliquot of each sample was initially spiked with a Pu-239 tracer. A second aliquot of sample was analyzed along with the spiked sample. All of the plutonium in the samples was reduced once using hydroxylamine. An anion complexing reagent (aluminum nitrate) was then added, and the solutions were oxidized with 4 M sodium nitrite. The plutonium was then extracted from the matrix using a TTA solution. The TTA layer was mounted on a counting dish, the mount was then analyzed by alpha spectroscopy.
Results and Discussion
Physical Properties
Sixteen subsamples from the original three solid samples were submitted for X-ray diffraction analysis. A typical powder diffraction pattern is shown in Figure 3. The pattern exhibits sharp diffraction peaks and a smooth baseline indicative of a very crystalline material even though the submitted sample had not been dried prior to analysis. In this particular powder pattern, five crystalline materials were identified and included sodium oxalate, the aluminosilicate cancrinite, sodium nitrate, sodium carbonate and the mineral cristabolite which is a high-fired form of silicon dioxide. Other patterns indicated these materials and others including other aluminosilicates and quartz.
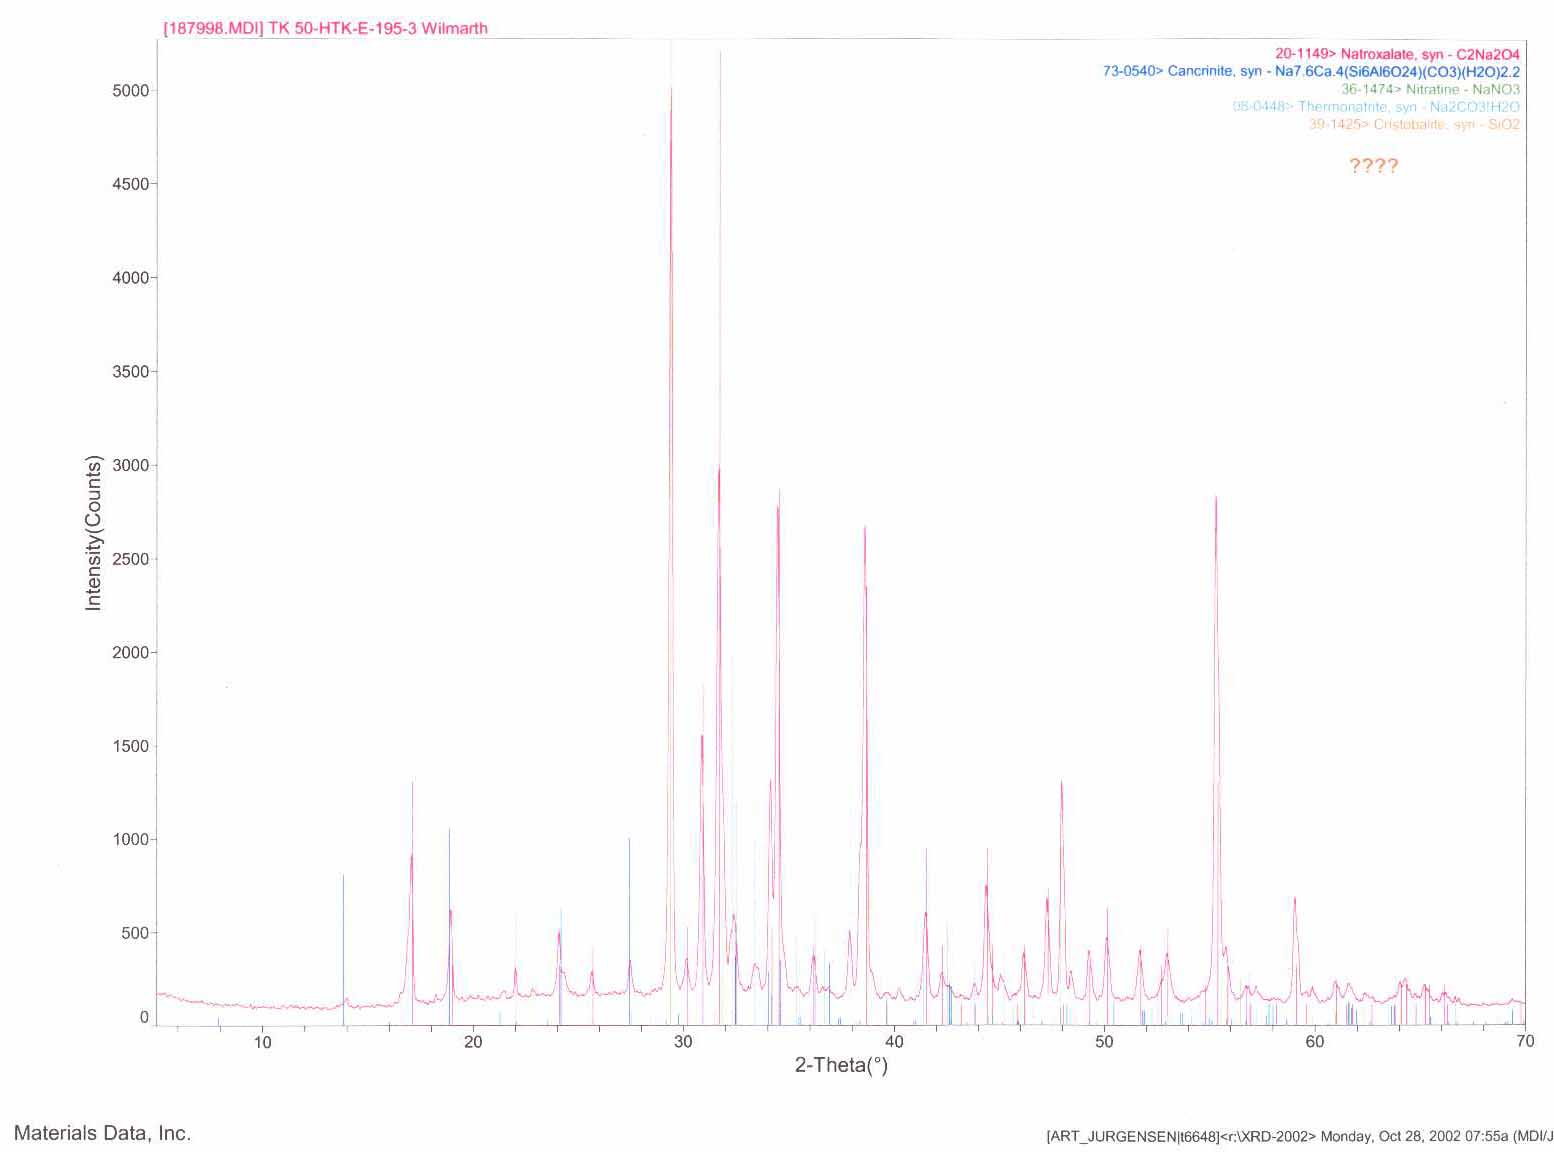
Figure 3. X-Ray Diffraction Powder Pattern of Tank 50H Solids
Previous analysis by Wilmarth2 on samples form the Effluent Treatment Facilitys (ETF) Evaporator Concentrate Tank had shown similar materials. In that report, estimates showed 65% sodium oxalate, 30% aluminosilcates and 5% iron oxide. Cleaning operations for the Effluent treatment Facility (ETF) Evaporator Concentrate Tank used hot water to dissolve the sodium oxalate and slurry the remaining solids to Tank 50H. The high sodium molarity in the Tank 50H supernate led to a re-precipitation of the sodium oxalate. The X-ray diffraction data agrees with this hypothesis. The presence of the silicon dioxide materials (quartz and cristabolite) most likely arises from the transfer of the Consolidated Incinerator Facilitys (CIF) Blowdown material.3
Additional solid-state analysis was performed using Scanning Electron Microscopy coupled with Energy Dispersive Spectroscopy (SEM-EDS). Figure 4 shows SEM photomicrographs and the EDX spectra of the solids as-received sample and after washing the sample with a small aliquot of de-ionized water. The washing was intended to remove the sodium nitrate salts from the Tank 50H supernate and allow clearer imaging of the aluminosilicate and sodium oxalate. Comparing the two EDS spectra, a number of elemental peaks are observable. The peaks form gold (Au) and palladium (Pd) are artifacts of the sample preparation. The intensity of the aluminum and silicon are higher in the after washing spectra and expected. Both set of spectra also indicate the presence of iron as in the ETF solids. Also present are calcium, potassium and nickel. The SEM images show the sodium oxalate as rod-like materials with the aluminosilicate as spheres typical of other work.4,5
Figure 4. SEM-EDS Images of Tank 50H Solids
Thermal analysis using Differential Scanning Calorimetry (DSC) has been employed to examine the solid samples. The results from the DSC analysis can quantify the amount of sodium oxalate present and can identify the amount of free water held in the sample. Figure 5 shows the result from sample labeled Tk50-HTF-E-195. The thermogram exhibits five discernable peaks of which four are endothermic and one exothermic. The first endothermic peak was around 125°C and is typical of free water. Calculations indicate the amount of free water averaged 3.1 wt % and was highly variable. The second peak in Figure 5 labeled as nitrate was endothermic and occurred at 280°C. This peak is likely a melting of the nitrate salts in the solid matrix and accounts for 4.2 wt %.
Figure 5. DSC Thermogram of Tank 50H Solids
The next peak is an exothermic peak that occurred at 450°C. This peak is likely caused by the oxidation of organic materials like sodium tetraphenylborate or benzene-containing materials or even carbon. Sodium tetraphenylborate is likely because Tank 50H received materials form the In-Tank Precipitation (ITP) facilitys cold chemical runs and material from Tank 49H, one of ITPs process tanks. Carbon was likely in the CIF Blowdown material. Two other endothermic peaks are located at 500°C and ~ 575°C and can be attributed to amorphous oxalate such as ferric oxalate and crystalline sodium oxalate, respectively. Calculations showed that oxalate was present on average at 42.9 wt %.
The last physical property measurement for the solids was the determination of the particle sizes of the solids. The particle size measurements placed a known quantity of the wet solid into water prior to analyzing using a light scattering technique. The water most likely dissolved most of the sodium oxalate. The measurement, therefore, indicates the particle size of the slurry if one were to move the material forward to Saltstone. Figure 6 shows the results of the particle size analysis. The three samples, Tk50-HTF-E-195, -196, and 197, were analyzed in duplicate. The results from the replicates agreed within experimental error and showed the range of particle size was < 10 µm.
Figure 6. Particle Size Analysis of Tank 50H Solids
Elemental Analysis
Table 1 and Table 2 show the results of elemental analysis using Inductively Coupled Plasma- Emission Spectroscopy (ICP-ES) for three samples removed from Tank 50H. Two separate digestion methods were used and the samples were analyzed in duplicate. Almost every element that was probed was present in measurable concentration. This is not unexpected for sludge-type materials. Sodium is the element with the highest concentration and averaged 212,800 m g/g of sample in the aqua regia digestion. The sodium value was significantly lower in the microwave technique. Aluminum and silicon were present at appreciable levels and using the aluminum values from Table 1 and the silicon values from Table 2, one can estimate the amount of cancrinite at 6.3 wt % in the solids on average. Calcium is also present, most likely as calcium carbonate, and using the aqua regia concentrations indicates 1.5 wt % calcium carbonate.
Table 1. Elemental Composition of Solids from Tank 50H using Aqua Regia Digestion
Table 2. Elemental Composition of Solids Removed from Tank 50H using Microwave Digestion
Iron is also present at fairly high concentration (3870 m g/g sample on average in the aqua regia digestions). This would translate into 1.6 wt % iron oxalate if the DSC peak at ~ 500°C can be attributed to ferric oxalate. Lastly strontium was present at an average concentration of 1310 m g/g sample which would translate into 0.2 wt % strontium carbonate in the solids. Total inorganic carbon analysis showed an average of 4900 m g of carbonate/g sample. If one neglects the small amount of carbonate that exists as strontium carbonate, then the sample would expect to have ~ 2.3 wt % sodium carbonate. This value is low because sodium carbonate is very prevalent in the X-ray diffraction powder patterns. Typical XRD detection limits are 5 wt % or higher.
Radiochemical Analysis
Table 3 and Table 4 contain the results from radiochemical analysis using gamma spectroscopy, alpha spectroscopy and Inductively Coupled Plasma-Mass Spectrometry (ICP-MS). The specific activity of the material was low enough to handle the samples in a radiochemical hood. Only low levels of cesium were found and were typically 104 dpm/g of solids. Comparable levels of Sb-125 were also found in the gamma analysis.
Table 3. Radiochemical Analysis of Tank 50H Solids using Aqua Regia Digestion
Table 4. Radiochemical Analysis of Tank 50H Solids using Microwave Digestion
More importantly, the alpha analysis indicated low levels of Pu-238 in the sample. Pu-238 specific activity of the solids averaged 1.7 x 10⁴ dpm/g or ~7.3 nCi/g. This is below the ETF Waste Acceptance Criteria of 18 nCi/g. The uranium concentration on average was the highest in the aqua regia digested samples and averaged 8650 m g/g of sample. This would translate into 1.2 wt % sodium diuranate with an average enrichment of 0.32%. No americium-241 was detected in the solid samples.
Organic Characterization
Table 5 contains the results from the organic analysis by volatile and semi-volatile organic protocols. Several organic components identifiable to the In-Tank Precipitation (ITP) process were observed. These include benzene (11 mg/kg maximum), biphenyl (12 mg/kg maximum), and tetraphenylborate (1150 mg/kg maximum). These components are not surprising due to the cold chemical runs for ITP sent material to Tank 50H. Additionally, one of the ITP process tanks, Tank 49H, just recently was discharged to Tank 50H.
Table 5. Organic Characterization of Tank 50H
The organic component with the highest concentration was the branched alkyl benzenes that had a maximum concentration of 2500 mg/kg or 0.25 wt %. The source of this material is not completely understood. The branched alkyl benzenes are components of scintillation cocktails as are the diisopropyl napthalenes, alkyl tetralins and other included in Table 5. Other potential sources are detergents and organic ion exchange resin fragments. The impact of these organics on the safety analysis of Tank 50H will have to be determined.
Conclusions
An expeditious analysis was performed by SRTC on three samples of solids removed from a mound in the northeast quadrant of Tank 50H. Analysis of the solids indicated that the material was similar to solids form in the ETF Evaporator Concentrate Tank and is comprosed of predominately of sodium oxalate, cancrinite (a sodium aluminosilicate) and sodium carbonate. X-ray diffraction analysis showed high-fired forms of silicon dioxide (quartz and cristabolite). Elemental analysis supports the presence of these materials. Differential scanning calorimetry was used to quantify the amount of sodium oxalate and other materials. Table 6 contains an estimate of the chemical composition of the solids from the various analytical analyses. The exothermic peak in the DSC thermogram was attributed to carbon as previously stated. Further work in identifying the species responsible for this exothermic reaction is needed.
Table 6. Estimated Chemical Composition of Tank 50H Solids
Additionally, radiochemical and organic analysis was performed on the solids removed from Tank 50H. The alpha analysis showed the solids were below the ETF limit of 18 nCi/g. Mass spectral analysis showed 0.9 wt % uranium with an enrichment of 0.32%. The organic analysis showed the presence of a number of components including benzene, tetraphenylborate and branched alkyl benzenes.
Acknowledgments
The authors were not the only people working on this project. There were numerous personnel in the Analytical Development Section and in the High Level Caves that participated. The authors express their appreciation for the hard work that went into this report.
References
- P. Rogerson, HLE-TTR-2003-061, October 25, 2002.
- W. R. Wilmarth, "Characterization of Samples from the Effluent Treatment Facility Evaporator Waste Concentrate Tank (U)", WSRC-TR-98-00034, Rev. 0, January 31, 1998.
- M. G. Looper, "CIF Blowdown Treatment at ETF/Saltstone (U)", SWD-CIF-98-0054, March 31, 1998.
- W. R. Wilmarth, J. T. Mills, and V. H. Dukes, "Results of Sorption/Desorption Experiments with IONSIV® IE-911 Crystalline Silicotitanate", WSRC-TR-2000-00394, January 24, 2001.
- W. R. Wilmarth and J. T. Mills, "Results of Aluminosilicate Inhibitor Testing", WSRC-TR-2001-00230, March 31, 2001.