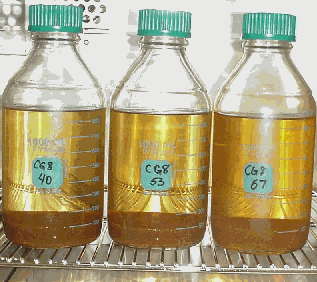
Cover Photo: CG8 Resins Heated to 37, 53, and 70°C (Left to Right).
WSRC-TR-2002-00091
Resin Longevity Studies
Kimberly R. Powell, Daniel I. Kaplan, and Fernando Fondeur
Westinghouse Savannah River Company
Aiken, SC 29808
This report was prepared as an account of work sponsored by an agency of the United States Government. Neither the United States Government nor any agency thereof, nor any of their employees, makes any warranty, express or implied, or assumes any legal liability or responsibility for the accuracy, completeness, or usefulness of any information, apparatus, product or process disclosed, or represents that its use would not infringe privately owned rights. Reference herein to any specific commercial product, process or service by trade name, trademark, manufacturer, or otherwise does not necessarily constitute or imply its endorsement, recommendation, or favoring by the United States Government or any agency thereof. The views and opinions of authors expressed herein do not necessarily state or reflect those of the United States Government or any agency thereof.
This report has been reproduced directly from the best available copy.
Available for sale to the public, in paper, from: U.S. Department of Commerce, National Technical Information Service, 5285 Port Royal Road, Springfield, VA 22161, phone: (800) 553-6847, fax: (703) 605-6900, email: orders@ntis.fedworld.gov online ordering: http://www.ntis.gov/support/index.html
Available electronically at http://www.osti.gov/bridge
Available for a processing fee to U.S. Department of Energy and its contractors, in paper, from: U.S. Department of Energy, Office of Scientific and Technical Information, P.O. Box 62, Oak Ridge, TN 37831-0062, phone: (865 ) 576-8401, fax: (865) 576-5728, email: reports@adonis.osti.gov
Key Words: Ion exchange Resin, GT73, Dowex 21K, CG8 Distribution Coefficients

Cover Photo: CG8 Resins Heated to 37, 53, and 70°C (Left to Right).
Executive Summary
This work is in support of the evaluation of the utility and safe disposal of 129I containing organic waste resins. Portions of the work reported herein have been summarized in an interim report (Powell et al., 2002). All of the conclusions in the interim report are consistent with the additional data presented in this final report.
Waste specific Kd values measured previously (Kaplan et al., 2000; Kaplan and Serkiz, 1999) do not account for potential degradation of these types of resin wastes over an extended period of time. Some degradation due to the high organic composition of the resins would be expected over thousands of years and could lead to additional release of radionuclides. The objective of this study was to carry out laboratory experiments to simulate aging of organic resin wastes in order to determine the functional life span of CG8, GT73 and Dowex 21K resins under field (trench) conditions, and to determine the expected performance of these resins as they degrade. These studies were designed to simulate trench disposal because previous studies demonstrated that waste specific Kd values were higher under acidic trench conditions than basic cementious disposal conditions (Kaplan et al., 2000; Kaplan and Serkiz, 1999).
In order to estimate the resin degradation rates under subsurface disposal conditions (~18 ° C), accelerated thermal-aging experiments were carried out with the three types of organic resins. In addition to these Arrhenius-type experiments, soil weathering tests designed to evaluate the microbial contribution to degradation were conducted. Relative rates of degradation were measured in terms of total carbon and iodine released from the resin.
An Arrhenius analysis of the total carbon data allowed for calculation of the first order rate constant (k) at subsurface temperature for the degradation of each of the three resins. First order rate constants were used to calculate the percentage of resin that would be released to an 18 ° C groundwater over 10,000 years, a duration of interest to Performance Assessment calculations. Less than 4 % of the resin was calculated to degrade over 10,000 years.
To evaluate the extent that the measured degradation rates (based on total carbon released from the resins) may influence waste disposal at this facility, the Kd values used by Collard (2001) in Special Analyses for the E-Area disposal site were recalculated to account for resin degradation. The resin-degradation-corrected-Kd values (Kdrdc) differed negligibly (<0.0004%) from the original Kd values; well within the uncertainty of the original Kd values. Consequently, there is no need to conduct additional Special Analysis calculations to account for the small effect of resin degradation on enhanced 129I release into the subsurface environment.
As a consequence of these results, Solid Waste has been released to dispose of 74 boxes of legacy resin wastes at SRS instead of repackaging and shipment to the Nevada Test Site (NTS). Onsite disposal in E-Area Low-Level Waste Facility trenches is less expensive than shipment to NTS.
1.0 Introduction
Radioactive resin waste has been generated at the Savannah River Site as a result of water treatment at F- and H-Areas. Key factors in the risk assessment of disposing of these materials in trenches include resin retention of 129I, a long-lived isotope, and the degradation rate of the organic resin itself.
The E-Area Low-Level Waste (LLW) Facility is the site selected to dispose of the low-level radioactive waste generated at SRS during the next 20 years. This facility is located on 200 acres, of which only 100 acres have been developed. The remaining 100 acres will allow for expansion of low-level waste disposal capacity.
Based on recent performance assessment (PA) modeling, 129I is a primary risk driver and constituent limiting the amount of 129I-bearing waste that can be buried in the facility (McDowell-Boyer et al. 2000). Stated in regulatory terms, 129I is a key radionuclide included in the Waste Acceptance Criteria (WAC) at this facility. The performance assessment modeling effort used the distribution coefficient (Kd value) construct to quantify aqueous 129I chemical interactions with the waste and the geological materials. The Kd is defined as the radionuclide concentration in the solid phase divided by the concentration in the aqueous phase. Waste specific Kd values measured previously (Kaplan et al, 2000 and Kaplan and Serkiz, 1999) do not account for potential degradation of these types of resins over an extended period of time. Some degradation due to the high organic composition of the resins would be expected over thousands of years and could lead to additional release of radionuclides.
In order to estimate the degradation of resin wastes during underground burial, simulated aging studies were carried out with Dowex 21K, CG-8, and GT-73 ion exchange resins. These resins have a polystyrene-base but bear different functional groups. The specific resins considered in this study include anion (Dowex 21K), cation (CG8), and neutral (GT73) resins with, respectively, quaternary ammonium, sulfonate, and thiol functionalities.
1.1 Objectives
The objective of this study is to carry out laboratory experiments to simulate aging of organic resin wastes in order to:
1.2 General Approach
Two separate aging studies were designed to simulate trench disposal of the resins.
Resins used in both studies were prepared in the same manner by first saturating with a non-radioactive sodium iodide solution to provide a cold simulant of the actual resin wastes containing 129I.
The first study was designed to provide qualitative information regarding the significance of any microbial degradation from microorganisms present in the soil. This microbial contribution to resin degradation was not accounted for in the design of the second more quantitative study. The thermal degradation studies will provide data for an Arrhenius analysis which will allow for calculation of the degradation rate of the resins under disposal conditions (~18 ° C). The two approaches together should provide a basis for evaluating the significance of both abiotic and biotic degradation.
1.2.1 Soil Weathering Tests
Of the two studies the soil weathering experiment most closely simulated actual burial because the resins were directly in contact with soil. Due of the nature of the experiment, it was necessarily a more qualitative experiment due to logistical problems of quantitatively recovering resins and their degradation products directly from soil.
The experiment was designed to enhance degradation of the resins by creating optimal conditions for microbial activity: by increasing the clay content of the soil, by providing a moist environment, and by providing an optimal temperature (30 ° C). Microbial activity is known to be related to the clay content of soil, and microorganisms are expected to thrive in a warm, moist environment.
1.2.2 Thermal-enhanced Degradation Studies
This study takes advantage of the Arrhenius relationship between temperature and rate constant to estimate the degradation of organic resins at subsurface SRS groundwater temperatures (~18 ° C). The rate of organic resin degradation is known to be extremely slow, and slow rates are generally difficult to measure accurately. An Arrhenius approach allows for the determination of the rate of a reaction at the temperature of interest based on measurement of the reaction rates in higher temperature regimes where that rate can be accurately measured. In the work reported herein, degradation of the organic resins in SRS surface water was carried out at a range of temperatures between 37- 87 ° C. Resin performance during degradation was measured as a function of the loss of carbon from the resin and also as a function of the loss of iodide. Results of these studies and Arrhenius treatment of the data are presented herein. A discussion of the Arrhenius equation is given below
1.2.2.1Arrhenius Approach
The rates of most reactions increase as the temperature is increased. The relationship between temperature and rate constant has been empirically observed, and numerous reactions have been shown to have rate constants that follow the Arrhenius equation:
![]() eq 1
eq 1
where,
k = first order rate constant (1/s),
A = pre-exponential factor (1/mol),
Ea = activation energy (J),
R = gas constant (J/K×
mol), and
T = temperature (K).
In reactions that follow the Arrhenius equation (eq 1), a plot of lnk against 1/T gives a straight line (where –Ea/R is the slope and lnA is the y-intercept). Therefore, the Arrhenius equation can be used to calculate the rate of the reaction at any given temperature. Because reactions at lower temperatures are slower, it is often impractical or impossible to measure their rates accurately. Measurement of the rates of the same reaction at a series of higher temperatures allows for the calculation of the activation energy (Ea) and the pre-exponential factor (A) that can be used to calculate the rate of the same reaction at the lower temperature.
2.0 Materials and Methods
Details of the experimental materials and methods for this set of experiments are found in Appendix A. The three resins used in this study, Dowex 21K, CG8, and GT73 were all obtained from the F- and H-areas Groundwater Treatment Facilities (GWTF) or the Effluent Treatment Facility (ETF) at SRS. These resins were "clean" resins not previously used for water treatment. Uncontaminated resins were used in this study because safety and cost issues prohibited a practical experimental design with radioactive samples.
GT73 resin was filtered to remove excess water prior to use. The resins were treated with a 0.1 M aqueous solution of sodium iodide (50 % resin wt/vol). Resins were agitated on a shaker table for 5 hours and allowed to stand overnight before filtering and rinsing with copious (10 fold excess) amounts of deionized water.
2.1 Soil Weathering Experiment
Details of the experimental setup for this study can be found in Appendix A. Briefly, resins were buried in a surface soil from an SRS forest that had been enriched two-fold in clay. A portion of each resin was buried in a porous polymer mesh for ease of retrieval, and a second portion was in direct contact with the soil. The experiment was carried out in a growth chamber where temperature was maintained at 30 ° C. Rainwater was added to pots containing soil and resins every 4-5 days to maintain moisture. At the end of 8 months the resins were retrieved and analyzed by optical microscopy and elemental or trace microanalysis for iodide.
2.2 Thermal Degradation Experiment
1 L glass bottles were charged with 60 g of air-dried resin and approximately 900 mL of filtered surface water from Upper Three Runs Creek. A control reaction with surface water only was prepared for each temperature. The bottles were loosely capped and placed in ovens at 37, 53, 70 and 87 ° C (Figure 1). Oven temperatures were recorded, and bottles were capped and shaken by hand each working day. A 30 mL aliquot of the aqueous phase was collected for analysis after the first day. For the remaining samples, deionized water was added to replace water lost due to evaporation on the day prior to sampling. 25 mL aliquots were collected after 1, 3, 6, and 10 months. After collecting the final aqueous sample, the resins were filtered and air-dried.
Each aqueous sample was analyzed for total carbon (total inorganic (TIC) plus total organic (TOC) carbon), pH, and iodide by ion selective electrode (ISE). First and last samples were analyzed for major ions by ICP-AES. Iodide analyses by liquid chromatography (LC) and capillary electrophoresis (CE) methods were tested on the initial samples along with ISE. Both LC and CE demonstrated that iodate was not present in solution although both methods suffered from other interferences. Therefore, ISE was ultimately selected as the analytical technique for iodide in the remainder of samples in order to minimize the volume of sample removed.
Resins were analyzed by optical microscopy, thermal gravimetric analysis (TGA), FT-IR, and elemental and trace microanalyses (C, H, N, S, I, and Cl). The moisture content of each resin was measured by using reported methods (Sharma, 1970). CG8 was heated to 105 ° C for 48 hours. Dowex 21K and GT73 were dried in vacuo for 12 hours at 50 ° C.
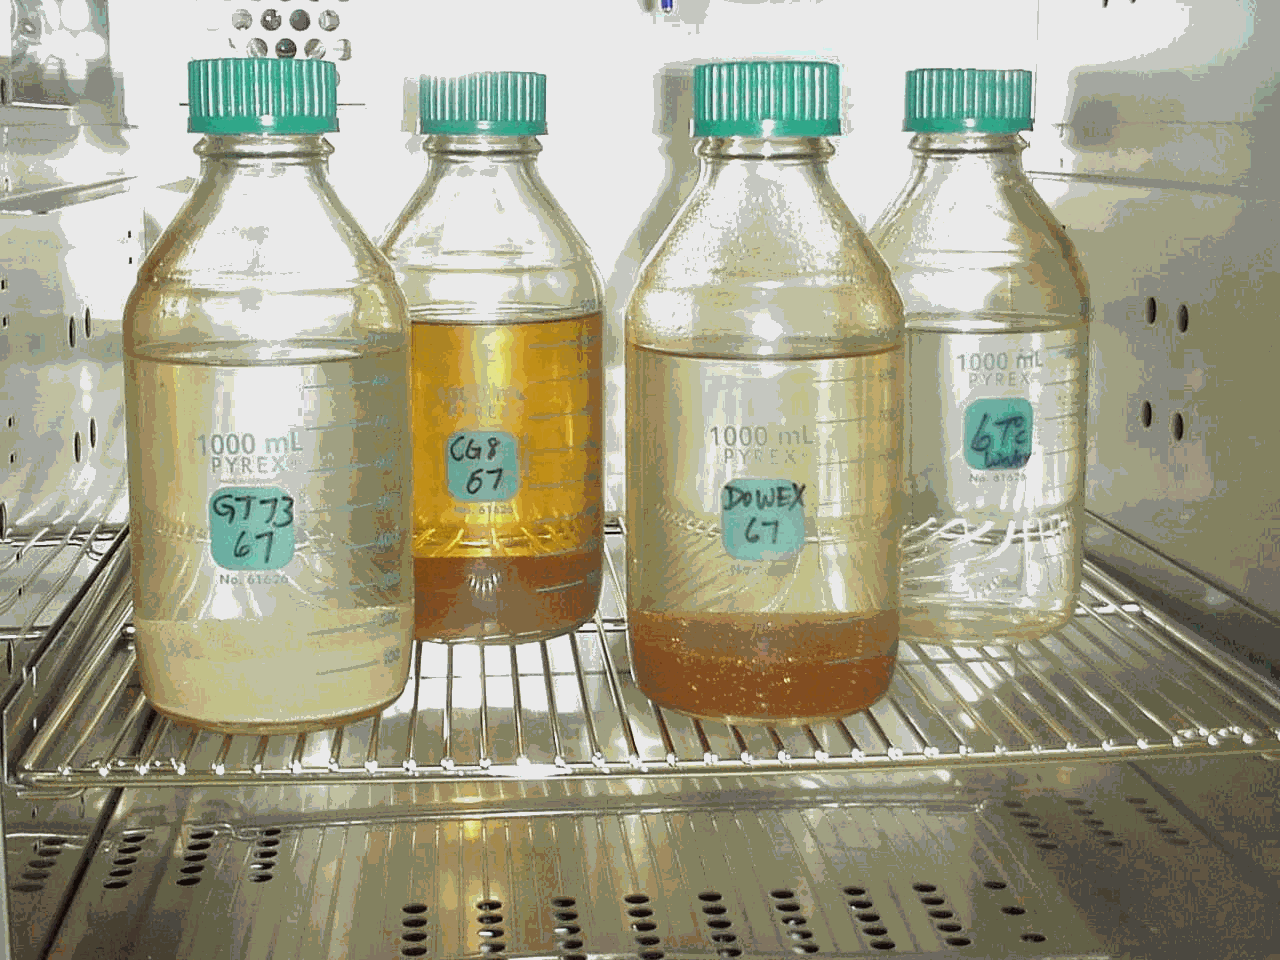
Figure 1. Experimental Setup at 70°
C with GT73, CG8, and
Dowex21K Resins and a Control with Water Only.
Total carbon analyses were performed by the SRTC Analytical Development Section (ADS) or UGA Analytical Services. LC and ICP-AES were performed by ADS. Elemental and trace analyses of the resins were carried out by Huffman Laboratories, Golden, CO. All other analyses were performed in house by Waste Processing Technology (WPT).
3.0 Results and Discussion
3.1 Soil Weathering Studies
After about eight months of incubation under ideal microbial growing conditions, no degradation of the surface of the resins was observed by optical microscopy in this more qualitative type of approach. In the case of the Dowex 21K resin the initial resin appeared much darker when compared to the resin recovered from the soil (Figure 2). Presumably, this was due to loss of iodide from the resin. Weathered GT73 resins were indistinguishable from the unweathered (Figure 3). Broken resin beads were observed in both the weathered and unweathered CG8 resins used in this study (Figure 4). A different batch of CG8 resins (used in the thermal degradation studies) contained no broken beads before or after heating.
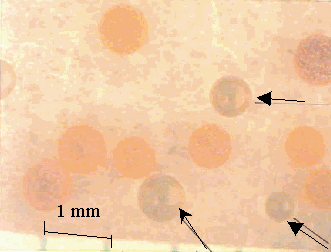
Figure 2. Dowex 21K Resin before (Arrows) and after Soil
Weathering
8 Months in Soil at 30° C. Soil is Adhered to
the Surface of the Weathered Resins.
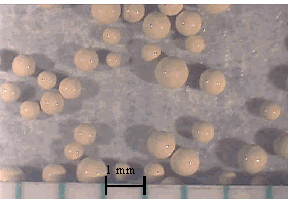
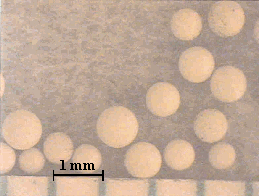
Figure 3. Unweathered (Left) and (Right) Weathered GT73 Resins
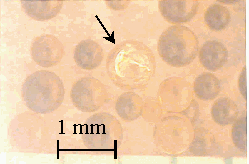
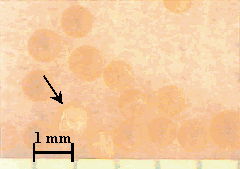
Figure 4. CG8 Resin before (Left) and after (Right) Weathering
8 Months in Soil at 30 ° C. Arrows Point to
Broken Resin Spheres.
Elemental and trace microanalyses reveal that the iodine concentration in the Dowex 21K resin (4.53 %) was over a thousand times greater than the loading of the CG8 or GT73 resins (0.0024 % and 0.0032 %, respectively)(Table 1). This high loading is not unexpected in light of the fact that the Dowex 21K is an anionic resin included in the F- and H-Area Ground Water Treatment Unit for the express purpose of removing 129I from the groundwater. The CG8 and the GT73 were included to remove various cations. During the eight month weathering period, the Dowex 21K retained iodide to a greater degree than either the CG8 resin or the GT73 resin, both of which retained less than half of the initial loading. The loss of iodide from the Dowex 21K resin was immeasurable by this technique, i.e., there was no significant difference in the iodide concentration at the start of the experiment and after eight months.
Table 1. Iodine Concentration in Unweathered and Weathered Resins.
SW-Initial
Denotes Unweathered Resins, SW-Geofab and SW-Soil Denote Weathered Resins
Collected
from the Geo-Fabric and Directly from the Soil, Respectively.
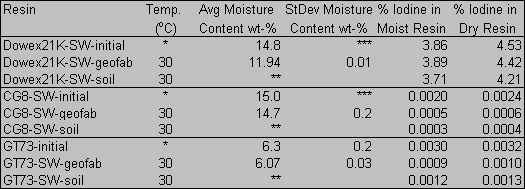
*initial air dried resin stored at ambient temperature without further treatment
**insufficient resin recovered for analysis; assumed moisture content equivalent
to SW-geofab
***not measured in replicate
3.2 Thermal Degradation of Resins in Groundwater
Visual inspection of the color of the aqueous solution, resin appearance, and solution turbidity (see Figure 5 ) is indicative that the three resins are not likely exhibiting the same degradation behavior. The CG8 aqueous solution becomes more highly colored with time and increasing temperature than either the Dowex21K or GT73 resins. Note that discoloration of the 87 ° C vessels (far right in each picture) is due to fouling of the PVC safety coating on the outside of the glass and not to observable changes in the aqueous phase.
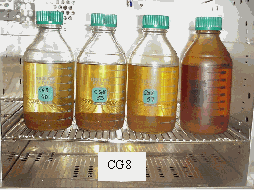
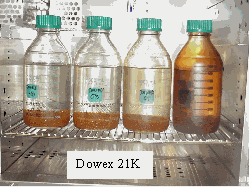
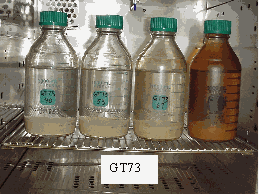
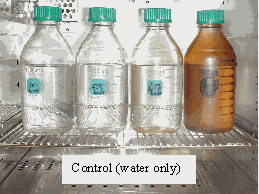
Figure 5. CG8, Dowex 21K, GT73, and Control Experiments (from Left to Right
in Each
Photo 37, 53, 70, and 87° C Temperatures Grouped
Together for Comparison) after Heating for 10 Months.
3.2.1 Resin Degradation as a Function of Total Carbon Released
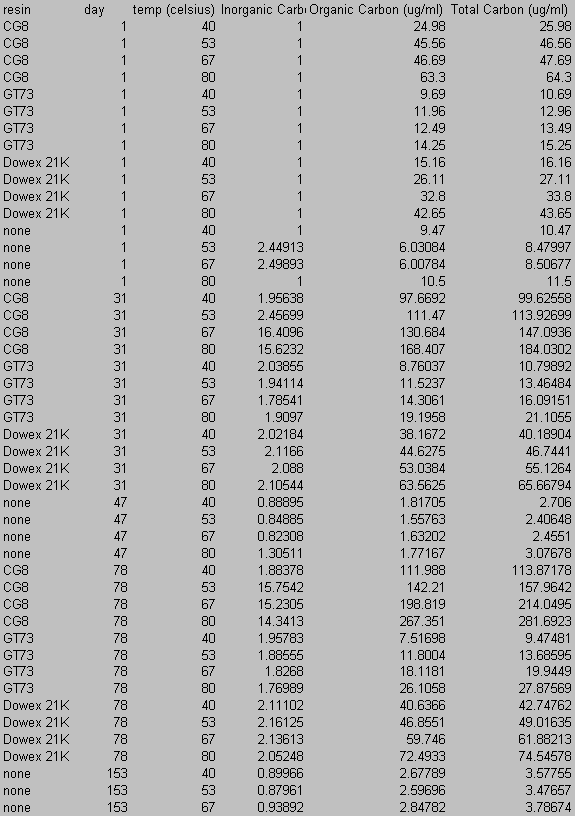
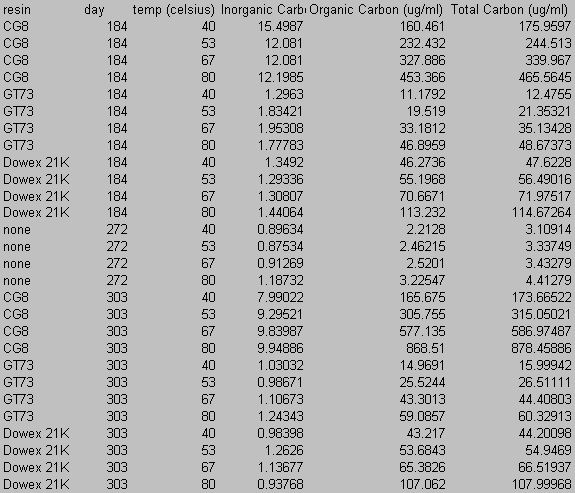
These visual observations were reflected by the aqueous total carbon data. As measured by total carbon released from the resins, the three resins degraded at measurably different rates as depicted in Figure 6 for the three resins equilibrated at 87 ° C. With the CG8 resin degrading faster than the Dowex21K or GT73 resins.
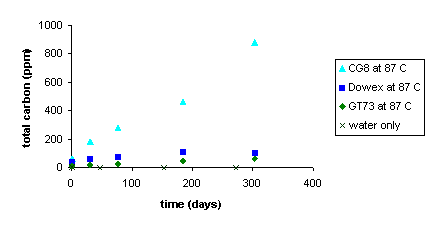
Figure 6. Total Organic Carbon Released from CG8, Dowex and
GT 73 Resins into SRS Water at 87 ° C as a Function
of Time.
Figure 7 shows total organic carbon released from the CG-8 resin as a function of time and temperature. Increasing slope with increasing temperature indicates a faster degradation rate. The degradation reaction for CG8 appears to follow first order behavior. A plot of ln(C/Co) (where C is the resin (solid phase) concentration at a given time and Co is the initial resin concentration) against time gives a straight line at all experimental temperatures (Figure 8). Rate constants for the degradation of GT73 and Dowex 21K resins were calculated similarly with the exception that for the Dowex 21K resin the first data point (t = 1 day) was not used. This data was omitted because there appeared to be an initial rate for the release of carbon that was at a different rate (faster) than the ultimate rate that was reached after one month and was constant for the duration of the study. One possible explanation for this initial large release of carbon may be that surface bound or carbon in the interstitial waters of the resins may have been initially flushed into the aqueous phase. This carbon likely did not enter the aqueous phase as a result of resin degradation as evidenced by its appearance after only one day and that it occurred at the lower, as well as the higher temperature treatments. Table 2 gives the rate constants for the degradation of each resin at each temperature studied.
According to the Arrhenius equation, a plot of ln k against 1/T gives a slope equal to –Ea/R with the intercept at 1/T = 0 equal to ln A (eq 1). See Figure 9 for the Arrhenius plot for the CG8 resin. Rate constants (kcalc) for the degradation of each resin were calculated using a subsurface temperature of 18.3 ° C (Table 2). The CG8 resin had the largest rate constant of the three.
Using the first order reaction rates calculated from the laboratory data for 18.3 ° C (Table 2), the amount of degradation can be calculated for various amounts of time using eq 2:
![]() eq 2
eq 2
where:
For example, for the CG8 resin, the fraction of the resin remaining at t = 10,000 years is 96.13 % corresponding to 3.83 % loss from the resin (see Table 7). This will be discussed later in Sections 0 and 0 which deal with the implications of the findings of these experiments on waste disposal calculations.
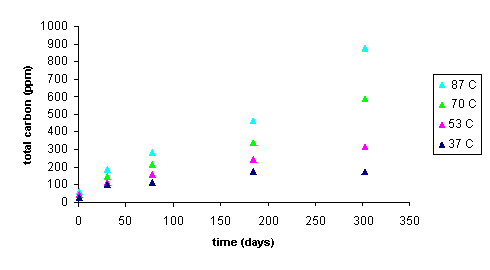
Figure 7. Total Organic Carbon Released into SRS Water from
CG8 Resin as a Function of Time at 37, 53, 70, and 87°
C Temperatures.
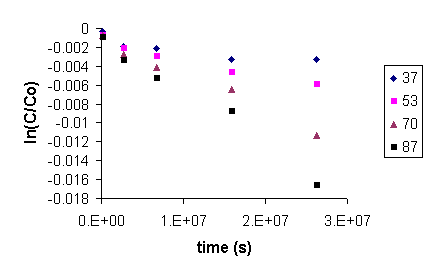
Figure 8. Plot of ln(C/Co) Against Time (s) for the Degradation of
CG8 Resin.
Slope of each Line Equals -k at that Temperature.
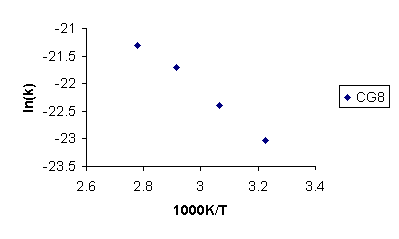
Figure 9. Arrhenius Plot of ln(k) Against 1/T(in Kelvin) for the CG8 Resin.
Table 2. Measured First-Order Rate Constants (k), and
Calculated Arrhenius Constants: Calculated First-Order Rate
Constants ([k(calc)], Activation Energy (Ea), and Pre-Exponential
Factor (A).

3.2.2 Iodide Released
Iodide released from the resin was measured as another indicator of resin performance. It is important to note that the magnitude of iodine release from these resins is not expected to be similar to that released from the actual waste resins because the conditions in which these resins were loaded with iodide were entirely different from those at the F- and H- Water Treatment Units. In particular, these resins were loaded to 100% holding capacity by adding high concentrations of NaI. A better measure of the release rate, or more specifically, the I-Kd value can be obtained from the Kd values measured using the actual waste (Kaplan et al. 1999 and Kaplan and Serkiz 2000). However, it was anticipated that the iodide data from these studies will permit some qualitative information about the changes in the ability of the resins to hold iodide as the resins degraded.
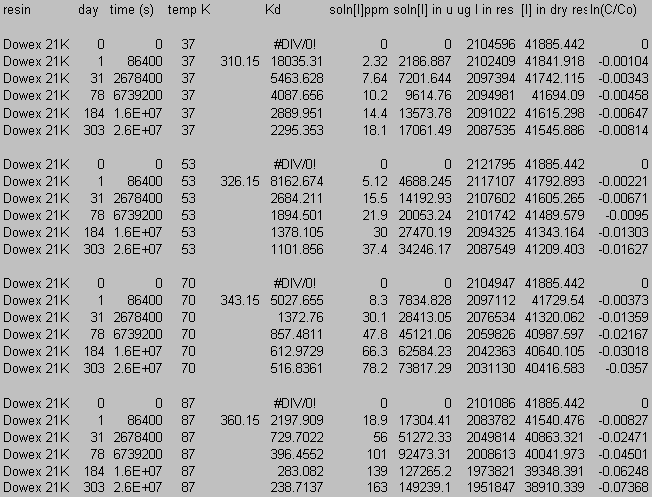
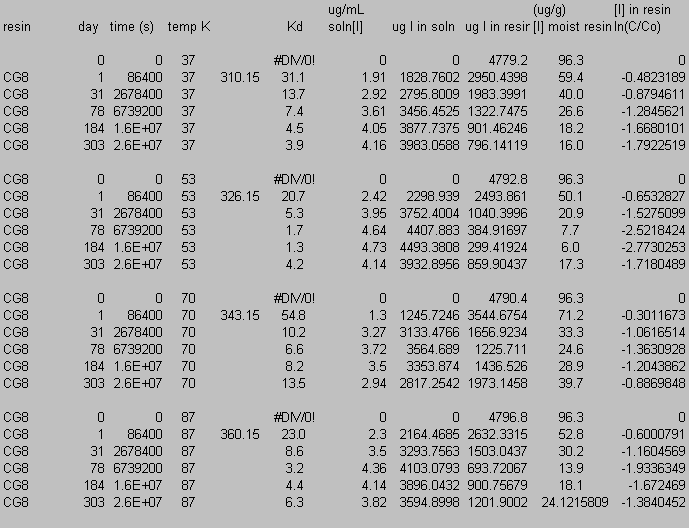
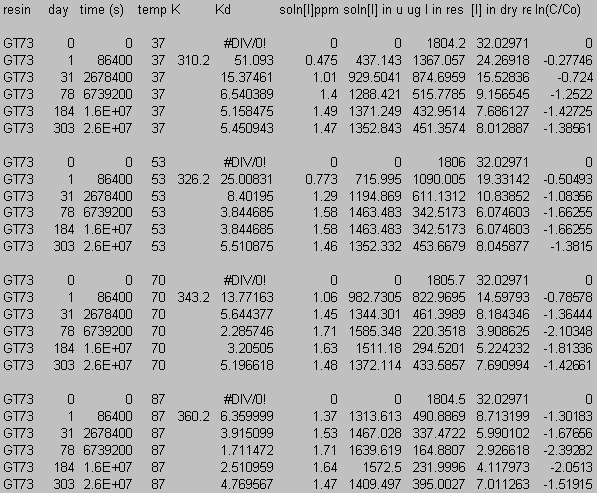
Ion selective electrode (ISE) for iodide provided a measurement of aqueous iodide concentration while elemental or trace microanalyses were used to analyze for iodine in all of the Dowex21K resins and the initial CG8 and GT73 resins used in the thermal degradation studies. Figure 10, Figure 11, and Figure 12 present iodide concentration in the resin as a function of time at 37, 53, 70, and 87 ° C. Loss of iodide from the Dowex 21K resin follows first order behavior. Rate constants for this reaction are given in Table 3 along with activation energy, Ea, and the pre-exponential factor, A, that follow from an Arrhenius analysis of the rate constants (eq 1). The rate constant, k, calculated at 18.3 ° C corresponds to a loss of 7.79 % of the iodine loaded onto the resin after 10,000 years. Comparison with the loss of organic carbon (0.08 % in 10,000 years; Table 7), suggests that a separate or additional mechanisms are present that are controlling the loss of iodine from the resins as compared to the loss of carbon from the resins. This is to be expected based on the anion exchange properties of the Dowex 21K resin.
The CG8 and GT73 resins did not follow first order behavior. For both resins after an initial release of iodide, iodide loss from the resin ceased, and iodide appeared to be reabsorbed by the resin. Clearly, a second mechanism was operable after the initial release. Thus, Arrhenius treatment of these data is not appropriate.
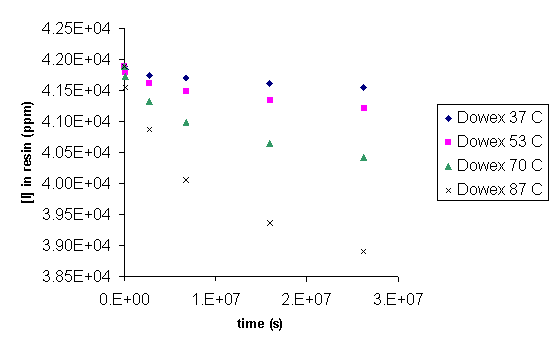
Figure 10. Concentration of Iodide in Dowex 21K as a Function of Time
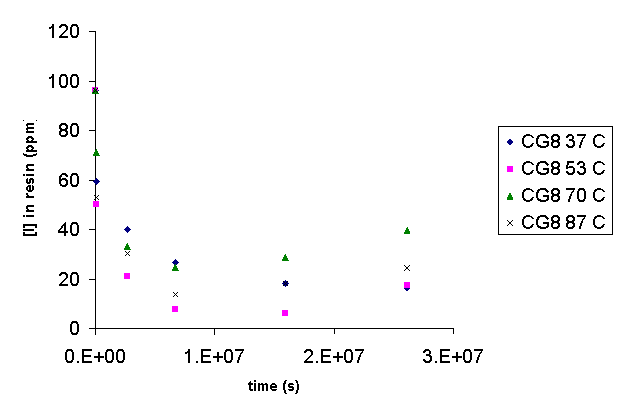
Figure 11. Concentration of Iodide in CG8 as a Function of Time.
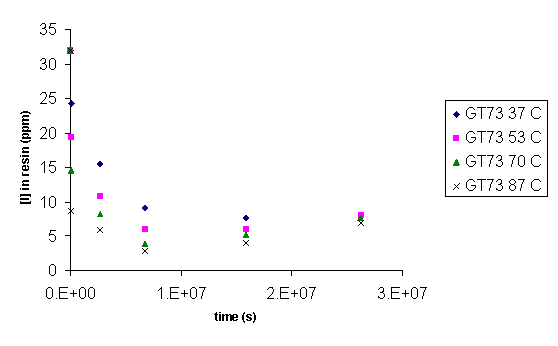
Figure 12. Concentration of Iodide in GT73 as a Function of Time.
Table 3. Measured First-Order Rate Constants (k) Based
on Loss of Iodide from
Dowex 21K Resin, and Calculated Arrhenius Constants: Calculated First-Order
Rate Constant ([k(calc)], Activation Energy (Ea), and Pre-Exponential
Factor (A)..

Elemental and trace microanalyses were used to determine the initial concentration of iodide in all resins prior to thermal degradation. Elemental microanalyses were also carried out on the Dowex 21K resins after heating for 10 months (Table 4). As with the soil weathering experiments, the loss of iodide from the Dowex 21K resin was immeasurable by this technique, i.e., there was no significant difference in the iodide concentration at the start of the experiment and after ten months of heating in groundwater.
In summary, only one of the three resins, Dowex 21K, permitted Arrhenius treatment of the data. Solutions in contact with the other two resins, GT-73 and CG-8, had appreciably lower aqueous iodide concentrations, approaching detection limits. This is not surprising in light of the fact that these are not anion resins and therefore little iodide would be exchanged onto their surfaces. Consequently, spurious iodide concentration data were obtained that did not follow well-known trends in chemistry (such as increased iodide concentrations with lower temperature). Based on the Dowex 21K, about 8% of the initial iodide would be released as a result of resin degradation and anion exchange after 10,000 years. Again, quantitative iodide data for special analysis calculations should be based on actual waste, rather than the prepared materials used in this study.
Table 4. Iodine Concentration in Resins Before and After
Thermal Degradation in Groundwater. (NM = Not Measured)
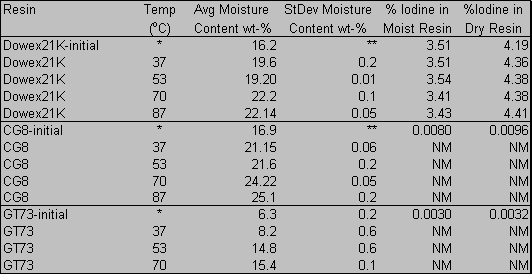
*initial air dried resin stored at ambient temperature without further treatment
**not measured in replicate
3.2.3 Other Analyses
Thermal Gravimetric Analyses and FT-IR Spectra for the Dowex 21K resin did not result in quantifiable data. These measurements are included in Appendix D.
3.2.4 Implications to E-Area Disposal
Collard (2001) reported a strong correlation between waste-form Kd values and the inventory limits that can be disposed in the slit trenches at the E-Area Low-Level Waste Facility (R2 = 0.9995). To evaluate the extent that the measured degradation rates (based on total carbon released from the resins) may influence waste disposal at this facility, the Kd values used by Collard (2001) were recalculated to account for resin degradation (Table 5). The resin-degradation-corrected-Kd values (Kdrdc) were calculated by two equations (eq 3 and eq 4):
![]() eq 3
eq 3
![]() eq 4
eq 4

Kdrdc-annual assumes that the Kd needs to be corrected for the amount of degradation that occurs in 1 year, the assumed length of time for steady state to be achieved (Table 5). In this calculation the fractional release rate of carbon from the resin is proportional to the fractional release rate of 129I from the resin. This assumption is reasonable insofar that it assumes that the 129I is evenly spread over the resin and that the carbon and 129I released are proportional. A conservative assumption associated with eq 3 is that the amount of 129I released in 1-yr from the resin is in equilibrium with the resin at a given time. Equation 4 drops this conservatism and assumes more realistically that the amount of 129I released from the resin is based on the residence time of water in contact with a resin waste and that 129I equilibrium can be achieved between the resins and the mobile aqueous phase during the time the water is in contact with the resin. Assuming a resin bulk density of 1.06 g/cm3 (Using a resin bulk density of 1.65 g/cm3 was less conservative, resulting in a residence time of 0.0156 yr. This difference resulted in essentially no real impact on calculated resin-degradation-corrected-Kd values).and a flow rate taken from the last performance assessment (McDowell-Boyer et al. 2000) of 40 cm/yr, the residence time was 0.024 yr (~9 days). Even though the carbon is not at equilibrium during the 9 day residence time, it is very likely that the aqueous I29I concentrations, which are controlled by anion exchange, do come into equilibrium within a day (Sposito 1994). Calculations based on eq 4 are presented in Table 6. As expected these corrections for resin degradation (Kdrdc-residence time) indicate an even smaller impact than those calculated using eq 3 (Kdrdc-annual; Table 5).
Table 5. Calculation of Kdrdc-annual (eq 3).
|
Original Kd Used in Special Analysis(a) |
Annual fractional |
Kdrdc-annual |
% decrease betw. Kd & Kdrdc-annual |
Kd decrease |
|
|
(mL/g) |
(mol/mol-t) |
(mL/g) |
(%) |
(mL/g) |
|
|
CG-8/FGWTU |
50 |
3.90E-06 |
49.9998 |
3.98E-04 |
0.00020 |
|
CG-8/HGWTU |
380 |
3.90E-06 |
379.9985 |
3.91E-04 |
0.00149 |
|
Dowex 21K /FGWTU |
6800 |
7.84E-08 |
6799.9995 |
7.84E-06 |
0.00053 |
|
Dowex 21K /HGWTU |
15600 |
7.84E-08 |
15599.9988 |
7.84E-06 |
0.00122 |
|
GT-73/ETF |
10000 |
2.30E-07 |
9999.9977 |
2.30E-05 |
0.00230 |
|
(a) Conservative waste-specific Kd values measured by Kaplan et al. (1999) and Kaplan and Serkiz (2000) |
|||||
Table 6. Calculation of Kdrdc-residence time (eq
4).
|
Original Kd Used in Special Analysis(a) |
Frational Release During 0.0236 yr |
Kdrdc-residence time |
% decrease betw. Kd & Kdrdc-residence time |
Kd decrease |
|
|
(mL/g) |
(mL/g) |
(%) |
(mL/g) |
||
|
CG-8/FGWTU |
50 |
9.21E-08 |
50.00000 |
9.3917E-06 |
0.00000 |
|
CG-8/HGWTU |
380 |
9.21E-08 |
379.99996 |
9.23178E-06 |
0.00004 |
|
Dowex 21K /FGWTU |
6800 |
1.85E-09 |
6799.99999 |
1.85004E-07 |
0.00001 |
|
Dowex 21K /HGWTU |
15600 |
1.85E-09 |
15599.99997 |
1.84988E-07 |
0.00003 |
|
GT-73/ETF |
10000 |
5.43E-09 |
9999.99995 |
5.43215E-07 |
0.00005 |
|
(a) Conservative waste-specific Kd values measured by Kaplan et al. (1999) and Kaplan and Serkiz (2000) |
|||||
One time of interest for performance assessment calculations is 10,000 years. Based on eq 2 and the calculated first order rate constants at 18.3 ° C obtained from the carbon-released data (Table 2), the percent of resin estimated to be degraded over 10,000 years was negligible, <3.85 wt-% (Table 7). The resin-degradation corrected Kd value (eq 3; Kdrdc-annual) is negligibly (<0.0004%) less than the original Kd values; well within the uncertainty of the original Kd values. Consequently, there is no need to conduct additional Performance Assessment or Waste Acceptance Criteria calculations to account for the small effect of resin degradation on enhanced 129I release into the subsurface environment.
Table 7. Resin Degradation Correction of the Kd Values.
|
Resin |
Waste Generating Facility |
% Resin released after 10,000 yr |
Original Kd Used in Special Analysis(a) |
%-D Kd |
Recommended Kdrdc |
|
(%) |
(mL/g) |
(%) |
(mL/g) |
||
|
CG-8 |
F-GWTU |
3.83 |
50 |
3.98E-04 |
50 |
|
CG-8 |
H-GWTU |
3.83 |
380 |
3.91E-04 |
380 |
|
Dowex 21K |
F-GWTU |
0.08 |
6,800 |
7.84E-06 |
6,800 |
|
Dowex 21K |
H-GWTU |
0.08 |
15,600 |
7.84E-06 |
15,600 |
|
GT-73 |
ETF |
0.23 |
10,000 |
2.30E-05 |
10,000 |
|
(a) Conservative waste-specific Kd values measured by Kaplan et al. (1999) and Kaplan and Serkiz (2000) |
|||||
4.0 Conclusions
Collard (2001) reported a strong correlation between waste-form Kd values and the limiting inventory that can be disposed in the slit trenches at the E-Area Low-Level Waste Facility (R2 = 0.9995). To evaluate the extent that the measured degradation rates (based on total carbon released from the resins) may influence waste disposal at this facility, the Kd values used by Collard (2001) were recalculated to account for resin degradation. The resin-degradation-corrected-Kd values (Kdrdc) differed negligibly (<0.0004%) from the original Kd values; well within the uncertainty of the original Kd values. The tests also indicate that <4 % of the resin would be released into the groundwater after 10,000 years. Consequently, there is no need to conduct additional calculations to account for the small effect of resin degradation on enhanced 129I release into the subsurface environment.
5.0 Acknowledgements
Bill Crooks and Beverly Wall from Actinide Technology initiated laboratory studies described in this report, and Cathy Coffey and Carl Black from Waste Processing Technology also assisted in the laboratory work. Anna Knox, of the Savannah River Ecology Laboratory, assisted in preparing and maintaining the soil weathering studies. Iodide analyses methods by Liquid Chromatography (LC) and Capillary Electrophoresis (CE) were tested by Robert Ray and Scott McWhorter, respectively, of the Analytical Development Section (ADS). Mike Summer of ADS provided assistance with optical microscopy.
6.0 References
7.0 Appendix A: Detailed Description of Materials and Methods
Materials and Methods for Resin Longevity Studies
General Approach: The exchange sites of fresh resins will be saturated with stable I-. Once the resins and I- reached equilibrium, they will be rinsed with deionized water, and dried before recording the initial weight of the resin. The air dried iodine saturated resins will then be placed in a vessel containing groundwater which is covered but not sealed, and placed in an oven at various temperatures: approximately 40, 53, 67, and 80 ° C. Additionally, a growth-chamber experiment, conducted at 30 ° C with SRS soil will be carried out in order to test the resins' performance when exposed to soil microbes.
Materials:
4 ovens
16 1-L containers that can be placed in an oven
CG8 resin
Dowex 21K resin
GT-73 resin
5-L 0.1-M NaI
16-L SRS groundwater
geo-fabric: Spectra/mesh fluorocarbon filter (mesh opening 105 mm,
32% open area, thickness155 mm)
SRS soil: Surface Clayey Forest Sediment (collected from an uncontaminated
area behind SREL)
Method:
For Thermal-enhance Degradation Studies:
|
Sample # |
Description |
|
1. |
40°C CG8 |
|
2. |
40°C Dowex 21K |
|
3. |
40°C GT-73 |
|
4 |
40°C groundwater only (no resin) |
|
5. |
53°C CG8 |
|
6. |
53° Dowex 21K |
|
7. |
53°C GT-73 |
|
8. |
53°C groundwater only (no resin) |
|
9. |
67° |
|
10. |
67°C Dowex 21K |
|
11. |
67°C GT-73 |
|
12. |
67°C groundwater only (no resin) |
|
13. |
80°C CG8 |
|
14. |
80°C Dowex 21K |
|
15. |
80°C GT-73 |
|
16. |
80°C groundwater only (no resin) |
For Soil Weathering Studies:
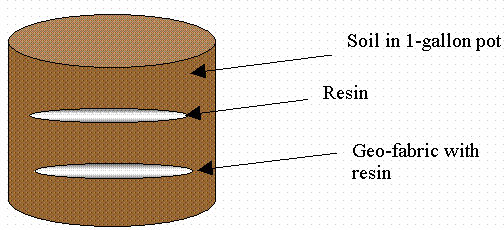
Figure A1. Growth-Chamber Set-Up.
8.0 Appendix B: Total Carbon Data


9.0 Appendix C: Iodide Data


10.0 Appendix D: TGA and FT-IR
10.1 Thermal Gravimetric Analyses
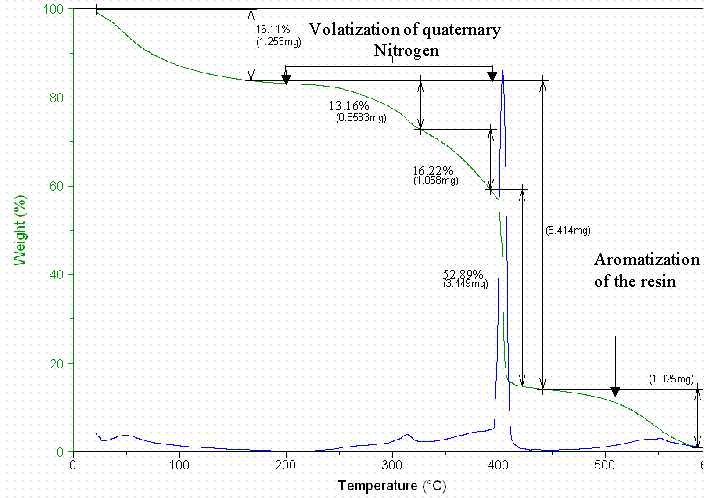
Figure D1. The Thermal Gravimetry Loss of the Dowex 21K-SW-Initial.
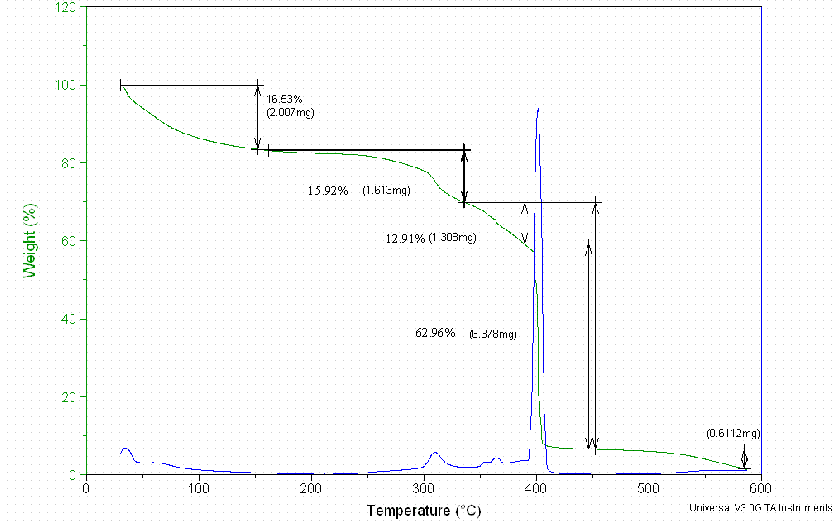
Figure D2. The Thermal Gravimetry Loss of the Dowex 21K Resin Treated at 37°C.
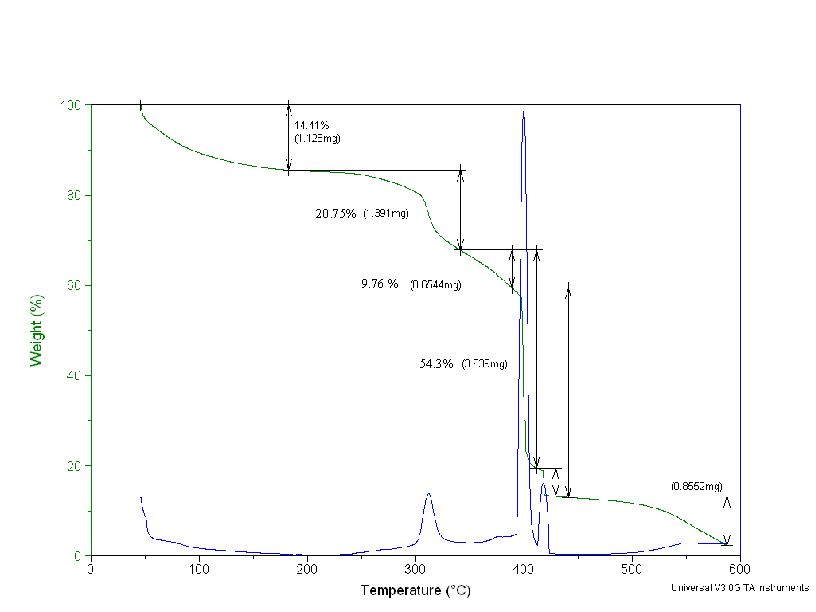
Figure D3. The Thermal Gravimetry Loss of the Dowex 21K Resin Treated
at 53°C.
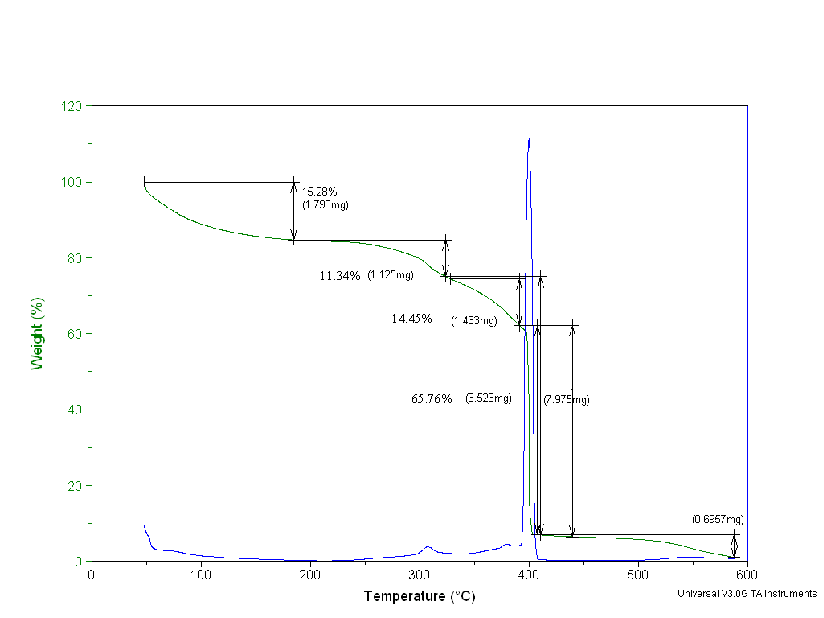
Figure D4. The Thermal Gravimetry Loss of the Dowex 21K Resin Treated
at 70°C.
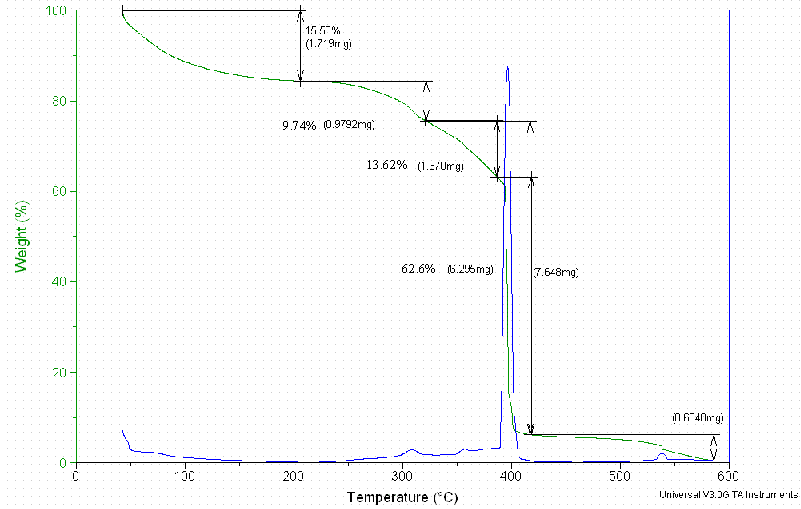
Figure D5. The Thermal Gravimetry Loss of the Dowex 21K Resin Treated at
87°C.
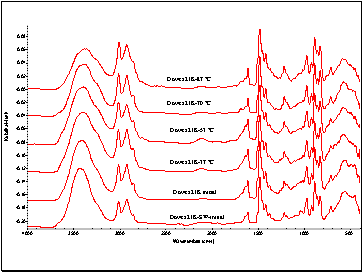
Figure D6. FT-IR Spectrum of the Dowex 21K Resins (2 mg of Resin to
250 mg of KBr). The Mixture was Placed in Diffuse Reflectance Accessory.
The Accessory was Placed in NICOLET 210 Spectrometer.
The Sample was Scanned 254 Times at a Resolution of 4 cm –1.