WSRC-TR-2001-00488
HT TCAP Loading Results for the Tritium Facility
Modernization
and Consolidation Project (S-7726)
G. C. Staack
Westinghouse Savannah River Company
Aiken, SC 29808
This report was prepared as an account of work sponsored by an agency of the United States Government. Neither the United States Government nor any agency thereof, nor any of their employees, makes any warranty, express or implied, or assumes any legal liability or responsibility for the accuracy, completeness, or usefulness of any information, apparatus, product or process disclosed, or represents that its use would not infringe privately owned rights. Reference herein to any specific commercial product, process or service by trade name, trademark, manufacturer, or otherwise does not necessarily constitute or imply its endorsement, recommendation, or favoring by the United States Government or any agency thereof. The views and opinions of authors expressed herein do not necessarily state or reflect those of the United States Government or any agency thereof.
This report has been reproduced directly from the best available copy.
Available for sale to the public, in paper, from:
U.S. Department of Commerce, National Technical Information Service, 5285
Port Royal Road, Springfield, VA 22161, phone: (800) 553-6847, fax:
(703) 605-6900
email: orders@ntis.fedworld.gov
online ordering: http://www.ntis.gov/help/index.asp
Available electronically at http://www.osti.gov/bridge
Available for a processing fee to U.S. Department of Energy and its contractors, in paper, from: U.S. Department of Energy, Office of Scientific and Technical Information, P.O. Box 62, Oak Ridge, TN 37831-0062, phone: (865 ) 576-8401, fax: (865) 576-5728, email: reports@adonis.osti.gov
Three production TCAP (Thermal Cycling Absorption Process) units were each loaded with approximately 18 kg Pd/k (nominally 53 weight percent palladium on kieselguhr) for the Tritium Facility Modernization and Consolidation (TFM&C) project, S-7726. The production HT TCAP units were loaded by SRTC/HTS personnel for Defense Programs.
While a loading demonstration performed on a single full-scale coil1 provided the basis for loading, no production units of this design (consisting of two foam-filled coils enclosed in a stainless steel jacket) had ever been loaded. As a result, each successive coil loading provided lessons learned, so the procedure evolved slightly between the first coil and the last. This report details the results of the successful loading of the units.
Keywords: S-7726, TCAP, Tritium
Introduction
The HT-TCAP units designed for the TFM&C Project will primarily be used to separate protium and tritium. The new HT-TCAP design addresses some of the energy inefficiencies observed in the existing TCAP units. The most notable improvement was the installation of aluminum foam (nominally 8-10 pores per inch) in the TCAP coil to improve heat transfer between the Pd/k and the hot or cold nitrogen (HCN).
Loading Methodology
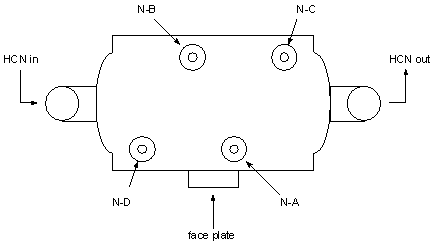
The three production HT TCAP units are designated Column C (H-233000-TCAP-VSL-HT.100), Column D (H-233000-TCAP-VSL-HT.200), and Column E (H-233000-TCAP-VSL-HT.300). Each unit contains two sections of coiled tubing loaded separately with Pd/k. The coils are loaded from each column end nozzle (with vacuum applied to the center nozzles) to ensure that the center of the column is completely filled with Pd/k. The nozzles are designated N-A, N-B, N-C, and N-D and each has a screen held in place with a retaining ring (316 stainless steel for nozzles N-A and N-C in column C, aluminum for the rest), and a Mott filter assembly. A sketch of the HT TCAP unit is given in Figure 1. Coil N-C to N-A is in the product side of the unit and N-D to N-B is the raffinate side.
Figure 1. Top TCAP View
Each unit was brought to the laboratory to perform the following operations:
The above operations were performed on coil N-C to N-A first then repeated on coil N-D to N-B. The manifold used is located in 773-A, room B-045, and is shown in Figure 2. The loading procedure2 details the steps listed above.
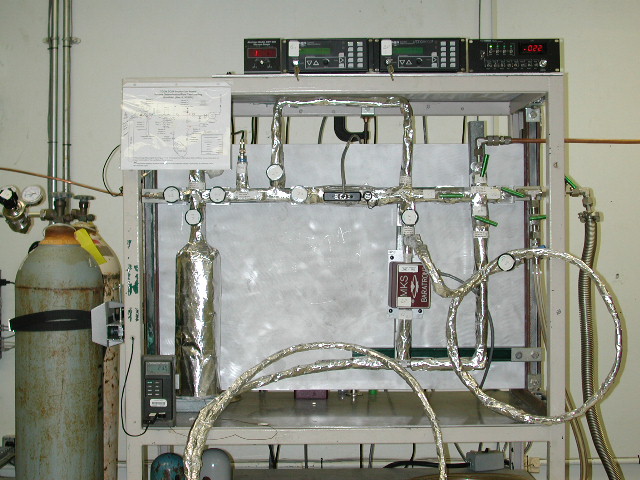
Figure 2. TCAP Manifold
HT TCAP Loading Criteria
The design of the HT TCAP units specifies that each coil is loaded with a minimum of 8 kg of Pd/k, based on nominal 55 weight percent palladium. Additional Pd/k should be used to completely fill the coil up to the screen. Kieselguhr may also be used to fill the end nozzle (to the screen) if necessary once the target Pd/k loading is achieved.
HT TCAP Loading Methodology
All coils were loaded at an 18° axial angle with the legs oriented vertically. Each coil was loaded by pouring Pd/k through a funnel into the designated nozzle (N-C or N-D) in 50 ml increments. A vacuum was applied to the mid-point nozzle (N-A or N-B) using an Edwards ESDP 30A dry scroll pump to facilitate transport through the aluminum foam in the coil. Mechanical vibration was applied at the loading nozzle using a device manufactured by Vibco. Eventually, Pd/k flow into the coil stopped, and tapping on the flanges with a rubber hammer was started in a successful, albeit slow attempt to add more material. An intermediate volume check and flow test were then performed (if needed) to try to move the Pd/k into the coil. Flange tapping was resumed and Pd/k was added to meet the loading requirements. Additional Pd/k and/or kieselguhr was added to fill the coil to screen level.
The most significant variation of the typical procedure occurred for the first coil of Column C. A helium push was performed on the first coil (N-C to N-A) in order to add Pd/k after initial attempts at vacuum and vibration left the coil short of the targeted amount. The helium push consisted of passing 2700 torr helium through the coil for 5 minutes three times. This had a considerable effect as the Pd/k level had shifted from just below the screen level to below foam level in the coil.
Pressure Drop Determination
The flow test consisted of measuring the pressure drop across the coil at six flow rates, using a MKS flow controller (100% = 20 SLPM H2) at 35-45 psig. Coil test gas flow direction was from the outer flanges toward the center (N-C to N-A or N-D to N-B) and column testing was performed from raffinate to product (N-D to N-C). Test gas output was vented to atmosphere. The pressure drop was measured using a MKS differential pressure transducer. Upon test completion, the column was back filled with argon and crated for shipment to Tritium.
Results
HT TCAP Column Loading
All coils were demonstrated to be leak free and empty coil free volumes varied from 10,398 to 10,517 cc. In addition, each coil (two coils per column) was loaded with between 8,887.1 and 10,238.2 g of Pd/k. See Appendix A for a detail of volume determinations (empty and filled) and Pd/k loading values3. Free volumes were measured by gas expansion. Appendix B contains Pd/k lot/coil information as well as specifications and test results4. Table 1 below lists Pd/k weights and lot numbers used in each column.
Table 1. HT TCAP Loading Summary
|
Vessel #
|
Column
Total Pd/k Weight (g) |
Pd/k Lot # |
| H-233000-TCAP-VSL-HT.100 |
19125.3
|
SOC00023
|
| H-233000-TCAP-VSL-HT.200 |
18444.4
|
SOC00023
|
|
SOC00193
|
||
| H-233000-TCAP-VSL-HT.300 |
18956.0
|
SOC00193
|
Successive coil loading operations yielded a number of procedural changes. Perhaps the most significant was the decision to begin tapping on the flange at the start of the loading process. It is thought that the impulse this provides jars frees some Pd/k that had become trapped in the foam, allowing it to travel further through the coil. Another discovery was the need to add the Pd/k slowly to the coil. This allows the material already in to travel as far as possible before any additional load is placed on the vacuum. The helium push performed on the first coil produced fines that were observed on the screen of nozzle N-A. Subsequently push conditions were relaxed for the second coil (relaxed push did not aid loading process), and discontinued altogether afterwards. No partial fill testing was performed on the last three coils due to improved loading technique and a lack of observed benefits. A filled coil (with vibration unit attached) is shown in Figure 3.
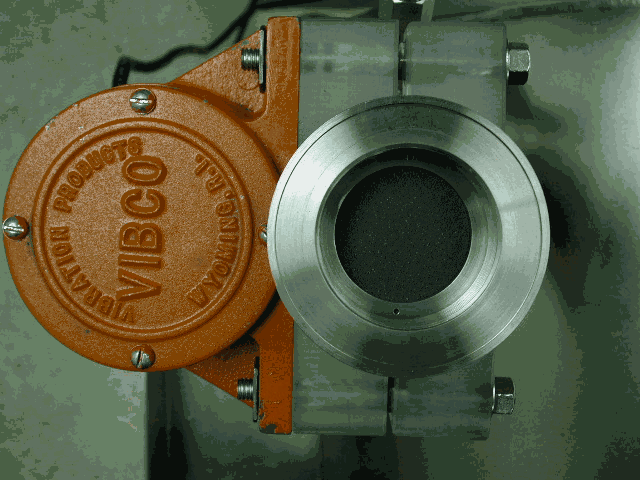
Figure 3. Filled Coil and Vibration Unit
It was observed that it is possible for the hand tightened aluminum retaining ring to loosen sufficiently for Pd/k to migrate under the retaining screen onto the ridge that contains the screen pin supports. It is believed that Pd/k would also be able to migrate around the screen, however the Mott filters (Figure 4) would prevent any Pd/k from leaving the TCAP assembly (Figure 5) and entering the process stream.
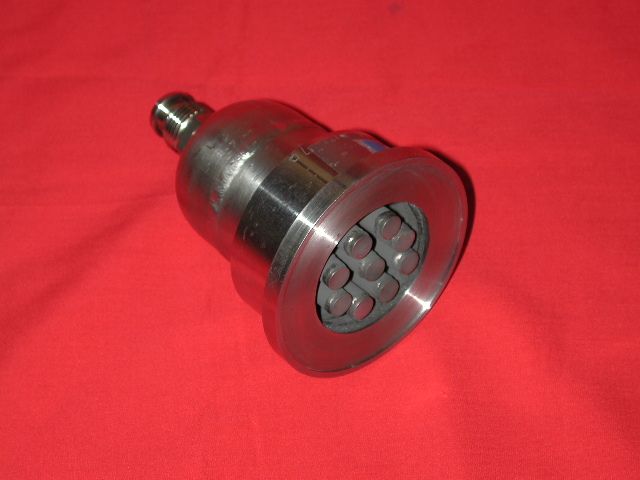
Figure 4. Mott Filter Figure
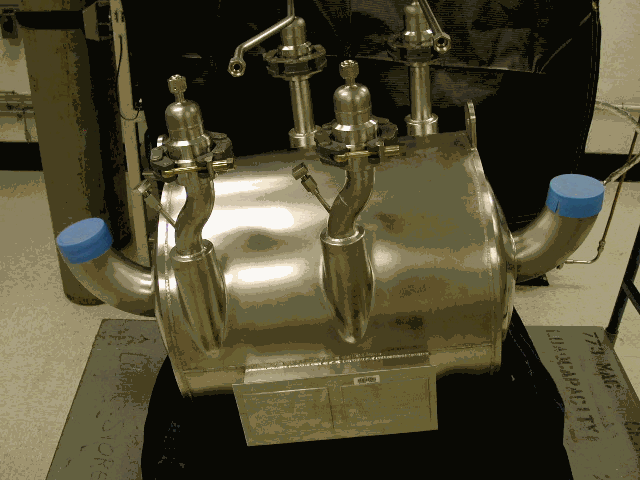
Figure 5. TCAP Assembly
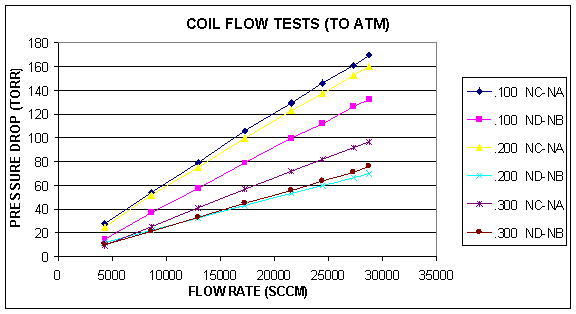
Pressure Drop Results
The pressure drop across each coil and column was measured in order to compare the effect of the various loading conditions on its performance. This information may also be used to compare with other TCAP units (i.e. TnT TCAP).
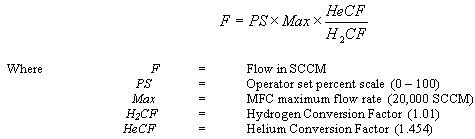
After coil and column testing was complete, it was observed that the flow controller used had been partially insulated (potentially impacting flow meter performance) and calibrated for hydrogen (our test gas was helium). A second, not insulated, flow meter (also calibrated for hydrogen, one for helium was not available) was placed downstream of the first and set at 100% flow. Helium was passed through the first controller at the same rates used to test the TCAP units and compared to readings taken from the downstream controller. Then the insulation was removed from the first controller and the process was repeated. No effect was observed due to the insulation. Test data are presented in Appendix C. An example calculation converting flow rates measured by the hydrogen-calibrated flow meter to actual helium flow is presented in Appendix D.
Consecutive loadings yielded generally decreasing pressure drops across coils and columns. Flow test results for each column is given in Figure 6. Test data and a graph of individual coil results are presented in Appendix E.
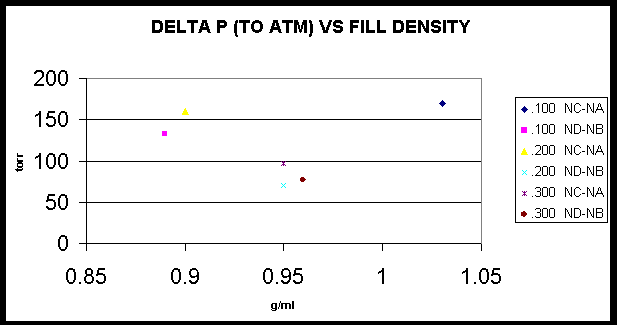
The fill density for each coil was calculated by dividing the free volume of the coil by the volume of Pd/k added (assuming a tap density of 1 g/cc3). A plot of pressure drop vs. fill density is given in Appendix F. Disregarding the data for the coil in which the helium push produced Pd/k fines, the plot indicates that loading technique did, in fact improve from coil to coil (increased fill densities at lower pressure drops).
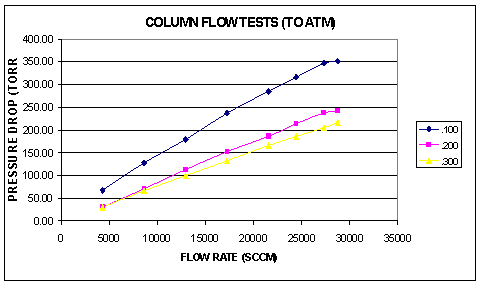
Figure 6. HT TCAP Column Pressure Drop at Various Flow Rates
Conclusions
Acknowledgments
Many thanks for the diligent efforts of W.D. Jacobs (SRTC/HTS) who provided the initial column loading and verified that TCAP loading (through aluminum foam) was achievable and to M.G. Scott and N. Wallace (both of SRTC/HTS) who provided the majority of the manual labor that made this task successful.
References
Appendices
A: TCAP Volume Determination and Loading Results
B: Pd/k Analysis
C: Flow Meter Insulation Check Data
D: Sample Calculation for Gas Calibration Correction
E: Flow Test Results
F: Coil Fill Density and Pressure Drop Through Successive Loadings
Appendix A. TCAP Volume Determination and Loading Results
|
|
NC-NA |
|||
|
|
Volume Empty |
Volume Full |
Pd/k Fill |
Fill Density |
|
Vessel # |
Coil (cc) |
Coil (cc) |
Weight (grams) |
(grams/cc) |
|
H-233000-TCAP-VSL-HT.100 (C) |
10398.3160 |
7727.7247 |
10238.2 |
1.03 |
|
H-233000-TCAP-VSL-HT.200 (D) |
10452.0408 |
8117.7762 |
8984.3 |
0.90 |
|
H-233000-TCAP-VSL-HT.300 (E) |
10450.4500 |
8065.1113 |
9466.2 |
0.95 |
|
|
|
|
|
|
|
|
ND-NB |
|||
|
|
Volume Empty |
Volume Full |
Pd/k Fill |
Fill Density |
|
Vessel # |
Coil (cc) |
Coil (cc) |
Weight (grams) |
(grams/cc) |
|
H-233000-TCAP-VSL-HT.100 (C) |
10517.894 |
8178.2705 |
8887.1 |
0.89 |
|
H-233000-TCAP-VSL-HT.200 (D) |
10488.537 |
8056.8002 |
9460.1 |
0.95 |
|
H-233000-TCAP-VSL-HT.300 (E) |
10481.5801 |
8044.6634 |
9489.8 |
0.96 |
|
|
|
|
|
|
|
|
Column |
|
|
|
|
|
Total Pd/k |
|
|
|
|
Vessel # |
Weight (g) |
|
|
|
|
H-233000-TCAP-VSL-HT.100 (C) |
19125.3 |
|
|
|
|
H-233000-TCAP-VSL-HT.200 (D) |
18444.4 |
|
|
|
|
H-233000-TCAP-VSL-HT.300 (E) |
18956.0 |
|
|
|
Appendix B. Pd/k Analysis
|
|
Pd/k Lot # |
Specifications |
|
|
SOC00023 |
SOC00193 |
||
|
% Palladium |
53.7 |
51.75 |
52-58% |
|
Chlorides |
110 |
130 |
250 ppm max |
|
30-50 mesh |
92.3 |
82.25 |
80% min |
|
|
.100 NC-NA |
.200 ND-NB |
|
|
Coil(s) used in |
.100 ND-NB |
.300 NC-NA |
|
|
|
.200 NC-NA |
.300 ND-NB |
|
Appendix C. Flow Meter Insulation Check Data
|
MFC #1 Setpoint |
MFC #2 Reading
|
MFC #1 Setpoint |
MFC #2 Reading
|
|
0 |
0 |
0 |
0 |
|
15 |
15 |
15 |
15 |
|
30 |
30 |
30 |
30 |
|
45 |
45 |
45 |
45 |
|
60 |
60 |
60 |
60 |
|
75 |
75 |
75 |
75 |
|
85 |
85 |
85 |
85 |
|
95 |
96 |
95 |
96 |
|
100 |
101 |
100 |
101 |
Appendix D. Sample Calculation for Gas Calibration Correction
Flow rates were calculated by multiplying the operator-set percent scale by the stated MFC maximum flow rate. This number, representing SCCM of hydrogen, was then divided by the hydrogen conversion factor, then multiplied by the helium conversion factor, both provided in the MKS Instruction Manual.
Appendix E. Corrected Flow Test Results
|
FLOW RATE |
Pressure Drop (torr) |
||||||||
|
Column 100 |
Column 200 |
Column 300 |
|||||||
|
(SCCM) |
NC-NA |
ND-NB |
ND-NC |
NC-NA |
ND-NB |
ND-NC |
NC-NA |
ND-NB |
ND-NC |
|
4311 |
27.76 |
14.82 |
67.56 |
25.17 |
12 |
30.19 |
9.61 |
10.28 |
30.16 |
|
8621 |
54.05 |
37.13 |
127.72 |
51.74 |
22.31 |
70.71 |
25.33 |
21.45 |
66.44 |
|
12932 |
79.24 |
57.59 |
179.22 |
75.16 |
32.65 |
112.86 |
41.16 |
33.18 |
99.32 |
|
17243 |
105.85 |
79.14 |
237.10 |
99.63 |
43.20 |
152.54 |
56.81 |
45.07 |
132.54 |
|
21554 |
129.33 |
99.70 |
284.95 |
122.85 |
53.30 |
185.98 |
72.01 |
55.80 |
165.87 |
|
24427 |
146.09 |
111.99 |
316.23 |
137.30 |
59.87 |
214.01 |
81.98 |
63.83 |
185.88 |
|
27301 |
160.97 |
126.28 |
346.55 |
152.73 |
66.47 |
237.61 |
91.82 |
71.22 |
204.95 |
|
28738 |
169.60 |
132.17 |
351.50 |
159.94 |
70.09 |
241.73 |
96.61 |
76.30 |
216.05 |
Appendix F. Coil Fill Density and Pressure Drop Through Successive Loadings
|
|
FILL DENSITY |
DELTA P |
|
(g/cc) |
||
|
.100 NC-NA |
1.03 |
169.6 |
|
.100 ND-NB |
0.89 |
132.17 |
|
.200 NC-NA |
0.9 |
159.94 |
|
.200 ND-NB |
0.95 |
70.09 |
|
.300 NC-NA |
0.95 |
96.61 |
|
.300 ND-NB |
0.96 |
76.3 |