Figure 1. Strontium-90 Removal from Tank 37H/44F
Composite Radioactive Waste Sample by Monosodium Titanate.
WSRC-TR-2001-00223
Demonstration of Caustic-Side Solvent Extraction with Savannah River Site High Level Waste
S. G. Campbell, M. W. Geeting, C. W. Kennell,
M. A. Norato, R. A. Pierce, D. D. Walker, and W. R. Wilmarth
Westinghouse Savannah River Company
Aiken, SC 29808
J. D. Law and T. A. Todd
Idaho National Engineering and Environmental Laboratory
Idaho Falls, ID
R. A. Leonard
Argonne National Laboratory
Chicago, IL
This report was prepared as an account of work sponsored by an agency of the United States Government. Neither the United States Government nor any agency thereof, nor any of their employees, makes any warranty, express or implied, or assumes any legal liability or responsibility for the accuracy, completeness, or usefulness of any information, apparatus, product or process disclosed, or represents that its use would not infringe privately owned rights. Reference herein to any specific commercial product, process or service by trade name, trademark, manufacturer, or otherwise does not necessarily constitute or imply its endorsement, recommendation, or favoring by the United States Government or any agency thereof. The views and opinions of authors expressed herein do not necessarily state or reflect those of the United States Government or any agency thereof.
This report has been reproduced directly from the best available copy.
Available for sale to the public, in paper, from: U.S. Department of Commerce, National Technical Information Service, 5285 Port Royal Road, Springfield, VA 22161, phone: (800) 553-6847, fax: (703) 605-6900, email: orders@ntis.fedworld.gov online ordering: http://www.ntis.gov/support/ordering.htm
Available electronically at http://www.osti.gov/bridge/
Available for a processing fee to U.S. Department of Energy and its contractors, in paper, from: U.S. Department of Energy, Office of Scientific and Technical Information, P.O. Box 62, Oak Ridge, TN 37831-0062, phone: (865 ) 576-8401, fax: (865) 576-5728, email: reports@adonis.osti.gov
Key Words: Cesium, Waste processing
List of Acronyms
|
AA |
Atomic Absorption |
|
ANL |
Argonne National Laboratory |
|
BOBcalix |
Calix[4]arene-bis-(tert-octylbenzo-crown-6) |
|
CF |
Concentration Factor |
|
CSSX |
Caustic-Side Solvent Extraction |
|
DBP |
dibutyl phosphate |
|
DF |
Decontamination Factor |
|
GC-MS |
Gas chromatography – mass spectrometry |
|
HLW |
High Level Waste |
|
ICP-ES |
Inductively coupled plasma emission spectroscopy |
|
ICP-MS |
Inductively coupled plasma mass spectroscopy |
|
O/A |
organic-to-aqueous volume ratio |
|
ORNL |
Oak Ridge National Laboratory |
|
SRS |
Savannah River Site |
|
SRTC |
Savannah River Technology Center |
|
TBP |
tributyl phosphate |
|
WPTS |
Waste Processing Technology Section |
1.0 Summary
Researchers successfully demonstrated the chemistry and process equipment of the Caustic-Side Solvent Extraction (CSSX) flowsheet for the decontamination of high level waste using a 33-stage, 2-cm centrifugal contactor apparatus at the Savannah River Technology Center. This represents the first CSSX process demonstration using Savannah River Site (SRS) high level waste. Three tests lasting 6, 12, and 48 hours processed simulated average SRS waste, simulated Tank 37H/44F composite waste, and Tank 37H/44F high level waste, respectively. Conclusions from this work include the following.
A solvent extraction process for removal of cesium from alkaline solutions has been developed utilizing a novel solvent invented at the Oak Ridge National Laboratory. This solvent consists of a calix[4]arene-crown-6 extractant dissolved in an inert hydrocarbon matrix. A modifier, an alkylphenoxy alcohol, is added to the solvent to enhance the extraction power of the calixarene and to prevent the formation of a third phase. An additional additive, trioctylamine, is used to improve stripping performance and to mitigate the effects of any surfactants present in the feed stream. The recently recommended solvent system and results of its performance in batch tests using a simulant of the SRS waste are described in a recent publication.
A number of laboratory studies have been performed to determine the stability of the solvent system in the presence of the chemicals in the SRS high-level waste tanks and under radiation fields. To proceed with the design of a plant for caustic-side solvent extraction of high level waste, extended operation of a small process on actual SRS waste was required.
The results from simulated SRS waste tests at Argonne National Laboratory (ANL) needed to be validated with Tank 37H/44F waste to be sure that there is no unexpected serious perturbation of system behavior due to the presence of minor components in the waste. These are components that might not have been present in adequate quantities in the simulated waste to affect test results. This test will verify that the flowsheet performance during Tank 37H/44F waste testing is similar to the performance demonstrated during simulant testing and that there are no significant changes in kinetic behavior in the extraction, scrubbing or stripping sections of the process. As some effects due to minor components are normally encountered in hydrometallurgical processes, data from the real-waste testing will be used together with data from ongoing solvent-degradation testing to determine the best cleanup process, as well as to provide an indication of solvent life before total replacement is required.
This report summarizes the results of tests at SRTC with non-radioactive simulated waste, radioactively spiked simulated waste, and Tank 37H/44F radioactive waste. Non-radioactive tests with CSSX simulated waste were needed to calibrate the control instrumentation, test hydraulic operation of the system including contactor stage efficiency, provide training for operators, and ensure the system could be operated inside the shielded cells. The CSSX simulated waste composition is similar to CSSX waste and contains noble metals and trace organic compounds. A test with CSSX simulated waste spiked with radioactive 137Cs was needed to demonstrate that the contactor system could be operated in the shielded cells to give results similar to those observed in the proof-of-concept test performed at ANL.4 In addition, the simulant test allowed practice in taking samples of decontaminated streams prior to the Tank 37H/44F waste test. A test with simulated Tank 37H/44F waste spiked with 137Cs was performed to demonstrate operation with a feed similar to the Tank 37H/44F waste.
This work fulfills a request from P. L. Rutland, Technical Task Request HLW-SDT-TTR-2000-00010, August, 2000. The work complies with the following plan: R. A. Peterson, "Task Technical and Quality Assurance Plan for Solvent Extraction Real Waste Contactor Testing," WSRC-RP-2000-00889, Rev.0, April 30, 2001.
The need for radioactive waste testing by SRTC is documented in the following work scope matrix: High Level Waste Disposition Systems Engineering Team, Applied Technology Integration Scope of Work Matrix for Caustic-Side Solvent Extraction, HLW-SDT-2000-00051, Rev. 4, November 9, 2000.
Requirements for the test are recorded in the following document: M. A. Nadeau, "Task Requirements and Criteria, Salt Waste Processing Facility, Real Waste Testing for the CSSX Alternative (U)," G-TC-A-00011, Rev. 2, March 1, 2001.
3.0 Tank 37H/44F Waste Test RequirementsRequirements for the Tank 37H/44F waste tests are defined by the Salt Processing Program in the real waste feasibility document for solvent extraction. The most important requirements follow:
4.0 Experimental
4.1 Simulant Feed Makeup and Compositions
Two different non-radioactive high level waste (HLW) simulants were prepared for use during the CSSX Tank 37H/44F waste testing. One simulant represented SRS average high level waste including minor organic compounds and noble metals. The other simulant chemically approximated a composite of waste from Tanks 37H and 44F. The purpose of the simulants was to provide non-radioactive feed for verifying proper hydraulic operation of the contactor test apparatus and for "spiking" known amounts of 137Cs to verify decontamination and concentration factors. Each simulant was prepared as a cesium-free solution. Once prepared and filtered, approximately one fourth of each simulant batch was separated from the batch and maintained cesium free. The purpose of maintaining the cesium-free portions of the simulants was to provide a solution that contained no cesium that could be pumped through the test apparatus while solution flows are being established during startup. Cesium chloride was added to the remaining solutions to provide cesium (non-radioactive) at the amounts specified in the recipe for each specific simulant.
4.1.1 CSSX Simulated Waste
Some blending of high level wastes is expected prior to transfer to the salt decontamination process. The average solution formulation represents a blend of all soluble waste in the tank farm. The nominal sodium ion concentration is 5.6 M for the feed to the solvent extraction option for salt disposition.
Table 1 lists the concentrations of 14 major components.5 The soluble salt values were derived from the average salt concentration as specified by Dimenna et al. These average values were produced by analysis of the High Level Waste characterization database system (WCS), the chemical composition database for High Level Waste Tank Farms. The computer program SpeedupÔ was used to calculate feed compositions for the various options. In doing this, an average feed composition was developed based on the data found in WCS. Currently this composition is the best estimate of an average feed solution for the various processes. The average feed composition, including dilution with 2 M sodium hydroxide solution to prevent aluminum precipitation, produced a total soluble Na+ concentration of 5.6 M.
Table 1. Composition of Simulated Waste Solutions
|
Component |
Average (M) |
Component |
Average (M) |
|
|
Na+ |
5.6 |
SO42- |
0.14 |
|
|
K+ |
0.015 |
Cl- |
0.024 |
|
|
Cs+ |
0.00014 |
F- |
0.028 |
|
|
OH- |
2.06 |
PO43- |
0.007 |
|
|
NO3- |
2.03 |
C2O42- |
0.008 |
|
|
NO2- |
0.50 |
SiO32- |
0.03 |
|
|
AlO2- |
0.28 |
MoO42- |
0.00007 |
|
|
CO32- |
0.15 |
NH3 |
0.001 |
Trace metals were also added to the CSSX simulated waste. The metals may cause additional degradation of the solvent system and should, therefore, be included in simulant testing. Table 2 contains the concentrations of the metals used, which were added from prepared concentrated stock solutions. It should be noted that analyses of waste solutions also included chromium, lead, mercury, and silver. However, these RCRA listed metals were omitted from the CSSX simulated waste used in this study due to waste disposal concerns. Studies conducted at ORNL have not shown any solvent decomposition attributable to any of these metals.
Table 2. Soluble Metals in Simulated Waste
|
Component |
Concentration (mg/L) |
|
Copper |
1.44 |
|
Ruthenium |
0.82 |
|
Palladium |
0.41 |
|
Rhodium |
0.21 |
|
Iron |
1.44 |
|
Zinc |
8 |
|
Tin |
2.4 |
The values for the soluble metals are based on data obtained for Tank 48H during the analysis of the tetraphenylborate decomposition that occurred in late 1995 and early 1996 at ITP startup. Since these values are well documented and occurred in plant processing, they were chosen for the simulant composition. They are not bounding but represent average values that could be expected over the life of the plant.
Table 3 provides a list of organic components that were also added to the salt solution.
Table 3. Organic Components in Simulated Waste
|
Component |
Concentration (mg/L) |
|
tri-n-butyl phosphate (TBP) |
0.5 |
|
di-n-butyl phosphate (DBP) |
25 |
|
mono-n-butyl phosphate (MBP) |
25 |
|
n-butanol |
2 |
|
formate |
1500 |
|
tri-methylamine |
10 |
The primary constituents of the organics in the waste tanks are byproducts of the hydrolysis of TBP and the digestion of ion exchange resins. Trimethylamine is a decomposition product of ion exchange resins. The concentrations listed in Table 3 are based on solubility limits in salt solutions and analyses of tank farm samples. Most of the resin organics processed into the tank farm appear in very small quantities, and are not included in this simulant.
4.1.2 Tank 37H/44F Simulant
A composite waste solution was prepared by blending approximately equal volumes of waste from SRS High Level Waste (HLW) Tanks 37H and 44F. A non-radioactive simulant solution was then specified based on chemical analyses of the blended waste solution. Table 4 shows the components of the Tank 37H/44F simulants with their corresponding concentrations.
Table 4. Composition of Simulated Tank 37H/44F (5.6 M Na+) Salt Solution
|
Component |
Concentration (M) |
Component |
Concentration (M) |
|
|
Na+ |
5.6 |
CO32- |
0.10 |
|
|
K+ |
0.030 |
SO42- |
0.007 |
|
|
Cs+ |
0.00021 |
Cl- |
0.012 |
|
|
OH- |
4.31 |
F- |
0.005 |
|
|
NO3- |
0.48 |
PO43- |
0.0054 |
|
|
NO2- |
0.41 |
SiO32- |
0.0031 |
|
|
AlO2- |
0.15 |
MoO42- |
0.0007 |
CSSX simulated waste was used during the 6-hour non-radioactive hydraulic verification tests performed in the SRTC Shielded Cells mockup. Both simulants were used in the "spiked" 137Cs tests in the SRTC Shielded Cells. In the latter tests, decontamination and concentration factors from the process operation were verified by spiking a known quantity of Tank 37H/44F HLW waste into each of the two simulant solutions.
Samples of both types of simulants were submitted to the Analytical Development Section of SRTC for analysis to verify concentrations of the various components. Analytical results are contained in Laboratory Notebook WSRC-NB-2001-00006.
4.2 High Level Waste Solution Composition
SRS tank farm personnel provided samples of liquid radioactive waste from Tanks 37H and 44F. These tanks are currently inactive and store predominantly salt cake with a layer of concentrated salt solution. Portions of the supernatant liquid were obtained in 40-L samplers. The samples were received, stored, and processed in the SRTC Shielded Cells in Bldg.
773-A. The two tank samples were combined in a loosely covered stainless steel tank in Cell Block A. Table 5 summarizes source information for each sample.
Table 5. Origin of Tank 37H/44F Composite Sample
|
Source |
Tank 37H |
Tank 44F |
|
Date Sampled |
10/10/2000 |
9/27/2000 |
|
Tank Farm Identification |
HTF-358 |
(no identification) |
|
Date received at SRTC |
10/12/00 |
9/28/00 |
|
Approximate volume (L) |
39 |
32* |
|
|
||
The solution density was measured in 50-mL volumetric flasks and weighed on a balance sensitive to ± 1 mg. Unfiltered portions (1 mL) were diluted in 99 grams of water or 0.2 M nitric acid and sent to the SRTC Analytical Development Section for routine analyses. The exact dilution factors were calculated from the density, weight of the nominal 1-mL sample, and weight of the water, assuming ideal mixing of the waste and water
The sodium ion concentration of the as-received composite solution was approximately
12.5 M. However, during transfer of the solution between storage tanks, researchers discovered a mass of crystallized salt at the bottom of the tank. The crystallized material likely formed upon cooling after removal from the waste tanks. The waste tank temperatures are typically 35 °
C and the Shielded Cells are <25 °
C. Approximately 10 L of water was added to dissolve the solids.
The solution of dissolved solids was added to the composite sample. A subsequent analysis indicated the sodium ion concentration remained approximately 12 M. A portion of the salt solution (~50 L) was transferred to a new tank and was diluted with 2.0 M NaOH solution (~85 L) to achieve a final sodium ion concentration of 5.6 M. Table 6 lists the composition of the diluted salt solution.
Table 6. Composition of the Tank 37H/44F Composite Sample
|
Component |
Concentration (Molar) |
Component |
Concentration (Mg/L) |
|
|
Na+(M) |
5.61 |
Ag |
<6 |
|
|
K+(M) |
0.037 |
Ba |
<3 |
|
|
Rb+(mM) |
0.092 |
Ca |
<20 |
|
|
Cs+(mM) |
0.17 |
Cd |
<2 |
|
|
Cr |
31 |
|||
|
Free OH- |
3.9 |
Mg |
<1 |
|
|
NO3- |
0.65 |
Pb |
<30 |
|
|
NO2- |
0.51 |
Sr |
0.048 |
|
|
AlO2- |
0.17 |
|||
|
SO42- |
0.002 |
Component |
Concentration (d/m/mL) |
|
|
CO32- |
0.072 |
Cs-137 |
1.6E+09 |
|
|
PO43- |
0.003 |
Sr-90 |
2.2E+05 |
|
|
F- |
<0.01 |
Tc-99 |
2.5E+05 |
|
|
Cl- |
0.012 |
Pu-238 |
1.7E+03 |
|
|
Oxalate |
<0.01 |
Pu-239/240 |
<1.2E2 |
|
|
Formate |
<0.02 |
|||
|
Component |
Concentration (mg/L) |
|||
|
Table shows composition after dilution with 2M NaOH to achieve 5.6 M Na+. Analyses performed on unfiltered samples. |
M-235 |
0.074 |
||
|
M-236 |
<0.003 |
|||
|
M-237 |
<0.003 |
|||
|
M-238 |
3.9 |
|||
|
M-239 |
<0.003 |
|||
|
Density (g/mL) |
1.217 |
|||
|
pH |
>14 |
|||
The waste composition is typical of tank supernates. Crystallization of less soluble salts leaves the supernate highly concentrated in sodium hydroxide. In these solutions the free hydroxide accounts for half or more of the total sodium concentration. Dilution with 2 M NaOH also contributes to the high hydroxide concentration in the final waste solution. After dilution, the Tank 37H/44F composite contained 3.9 M free hydroxide compared to 2.0 M free hydroxide in average waste. Nitrate (0.65 M) is correspondingly low compared to the expected average concentrations (1.7 M). Cesium also tends to concentrate in the supernate. This is reflected in the high 137Cs activity of the undiluted sample (5.5x10⁹ d/m/mL or
0.7 Ci/L) compared to average waste (0.37 Ci/L). Potassium ion (0.037 M), which competes with cesium during extraction, is also higher than average (0.014 M). The high concentrations of these two components makes decontamination of the Tank 37H/44F composite more challenging than average waste.
4.3 Batch Equilibration Test
Prior to the Tank 37H/44F waste demonstration using the 33-stage centrifugal contactors, the cesium distribution coefficients for the extraction, scrub, and strip operations were measured on the actual Tank 37H/44F composite in a batch experiment following the MST strike for alpha removal. Testing was performed in duplicate and at targeted organic-to-aqueous (O/A) volume ratios of 0.33 for the extraction step and 5 for the scrub and strip steps. Polypropylene tubes (40-mL or 15 mL) were used during the batch contacts.
Table 7 shows the extraction distribution (DCs) value for cesium was in agreement with previously published work on SRS simulants by ORNL researchers.9 The scrub distribution coefficient was slightly higher than expected. Difficulty was experienced in obtaining the correct pH of the scrub aqueous phase in the shielded cell environment. The pH was high (~10) and indicated some aqueous carryover from the extraction step, which could account for the high scrub DCs value. The strip aqueous phase tested around pH 4. A high degree of variance in the duplicate tests was observed in the DCs values for the first strip step. The data shows the DCs values for the second and third strip were in line with predictions.
Table 7. Cesium Distribution Coefficients for Tank 37H/44F Composite Sample
|
|
|
|
DCs Corrected to 25 ° C |
DCs for CSSX Simulant at 25 ° C |
|
Extraction |
27.4 ± 0.4 |
20.8 |
19.0 |
16.9 |
|
Scrub |
2.93 ± 0.7 |
19.2 |
1.76 |
1.59 |
|
Strip 1 |
0.28 ± 0.22 |
21.8 |
0.20 |
0.15 |
|
Strip 2 |
0.15 ± 0.04 |
20.8 |
0.10 |
0.09 |
|
Strip 3 |
0.11 ± 0.06 |
20.8 |
0.07 |
0.07 |
4.4 Radioactive Waste Pretreatment with Monosodium Titanate
The purpose of the monosodium titanate pretreatment is to sorb strontium and actinides and reduce their concentrations below the Saltstone feed specifications. The current flowsheet specifies treatment using 0.4 grams of MST solids per liter of waste at 5.6 M Na+.12 Table 8 lists the Saltstone feed limits and the initial and final concentrations in the Tank 37H/44F composite sample.
Table 8. Monosodium Titanate Pretreatment Requirements and Results
|
Component |
Sr-90 |
Total Alpha |
|
Saltstone Limit: |
40 nCi/g |
18 nCi/g |
|
Initial concentration |
81 nCi/g |
<1 nCi/g |
|
After MST strike After Cs-removal |
39 nCi/g 5.8 nCi/g |
<1 nCi/g -- |
The monosodium titanate was manufactured by AquaAir and has been stored at ambient laboratory temperatures. A portion was obtained and characterized for use in the radioactive waste test. Qualification of the material requires two tests: particle size distribution and Sr-removal. Particle size distribution was measured using a Microtrac Model SRA150 particle size analyzer. Sr removal was measured in a standard distribution coefficient (Kd) test by gamma counting Sr-85 tracer in average SRS simulated waste. The MST failed both qualification tests. Table 9 lists the results. The particle size distribution included too many large and small particles and the strontium-removal ability was low. Although the Sr-removal index was lower than desired, researchers expected it to provide a decontamination factor significantly greater than the factor of 2 required for the Tank 37H/44F composite to meet the Saltstone limit.
Due to limited tank space, researchers treated the Tank 37H/44F composite sample in two equal-sized batches. The AquaAir MST was added in the required quantity of 0.4 grams of MST solids per liter of waste. An air-driven mixer agitated the waste for 24 hours. Researchers removed and filtered samples after 2, 4, and 24 hours of mixing. The samples were filtered through 0.45 micron disposable filters, diluted 100-fold (to reduce gamma dose rates), and analyzed for strontium-90.
Figure 1 shows the results of strontium analyses during the MST strike. Both batches performed similarly. The MST achieved, albeit barely, sufficient strontium removal to meet the Saltstone limit. The poor performance was likely due to inadequate suspension of the MST particles by the mixer. The performance may have been exacerbated by the large particle size and low Sr-removal index of this particular batch of MST. In the Small Tank Tetraphenylborate process demonstration, portions from the same batch of MST achieved greater strontium decontamination in similar waste – reaching DF values as high as 77 - when used in smaller sized equipment with better mixing. Following cesium removal, the composite sample of processed waste was analyzed for Sr-90 in the absence of large concentrations of 137Cs and a higher DF was obtained. The significantly improved DF may be due to changes during storage and processing (which included a second filtration), but could also be due to Sr-90 analytical problems in the presence of high gamma activity. Further analyses are planned to examine this possibility.
Table 9. Monosodium Titanate Qualification Results
|
Particle Size |
Sr-Removal Index |
|
|
Specification |
<1% of particles |
>150 |
|
Found |
1.5% |
63 |
|
Specification |
<1% of particles |
|
|
Found |
~15% |
Figure 1. Strontium-90 Removal from Tank 37H/44F
Composite Radioactive Waste Sample by Monosodium Titanate.
4.5 Contactor Configuration
4.5.1 Physical Configuration
The process equipment used for these tests centered on 33 stages of 316 stainless steel, 2-cm annular centrifugal contactors designed and fabricated by ANL. The contactors were grouped into one solvent wash stage, 15 extraction stages, two scrub stages, and 15 strip stages in a two-tiered configuration (Figure 2). This configuration of the stages placed the solvent wash, extraction, and scrub stages at higher elevation than the strip stages (Figure 3). Inter-stage lines were stainless steel to promote improved wetting and flow characteristics. The tubing run between the second scrub stage (stage 17) and first strip stage (stage 18) was made of polypropylene to allow for visual verification of flow between the two contactor sections.
Figure 2. Flow Diagram
Figure 3. General Contactor Configuration.
Physical dimensions of the contactors are specified on ANL print number CMT-E1265 titled "2-cm Contactor" and dated 1/6/94. To improve stage efficiency, the hole at the bottom of each rotor was modified to make the rotor partially pumping4. The aqueous weirs for the rotors in the extraction section (stages 1 through 15) were increased from 0.481/0.482 inches to 0.491/0.492 to support total flow rates of approximately 60 mL/min. Motor shafts were extended from previous designs to allow visual verification of rotation.
To maintain the temperature of the extraction section below 25 ° C, stainless steel cooling channels were welded to the base of the solvent wash and extraction sections and, chilled water from a computer controlled, Laudab Brinkman Ecoline RE206 circulating bath was pumped through them. Type K (Omega Engineering) thermocouples were attached to eight extraction stages, two scrub stages, and eight strip stages to provide temperature monitoring and, for extraction stages, feedback input to the control system. During the Tank 37H/44F waste test, a heating lamp was placed in front of first two strip stages (Stages 18 and 19) to increase the temperature of those stages above 28 oC.
Liquids were fed to the contactors using pumps manufactured by Fluid Metering, Inc. (FMI). All feed streams were monitored by Rheothermb flow instruments providing data to the computer-based process control system. Additionally, the feed rates of the waste, strip, and scrub liquids were measured using Mettlerb balances. Temperature, flow, and balance data were logged to the workstation running Intellution FIX 7.0 process control software. Data was written to the computer hard drive every four hours and manually backed up to a second hard drive every six hours. The data was further archived to a CD every 24 hours.
The waste feed for the spiked simulant tests and Tank 37H/44F waste test were filtered through a 0.45-micron (1000 cm2) Wattman cartridge filter prior to being placed in the Waste Feed Tank. The exit streams from the contactors were equipped with aqueous-solvent decanters (fabricated in the SRTC glass shop) to disengage the liquid phases and measure second-phase carryover.
The hydraulic verification tests using the non-radioactive CSSX simulated waste were performed in the SRTC Shielded Cells mockup facility (Figure 4 and Figure 5). The spiked simulant and Tank 37H/44F waste tests were performed in Cells 3 and 4 of the SRTC Shielded Cells Facility (Figure 6). General configuration of the tanks and decanters is shown in Figure 7.
Figure 4. Contactor Apparatus in SRTC Shielded Cells Mockup Facility (View
A)
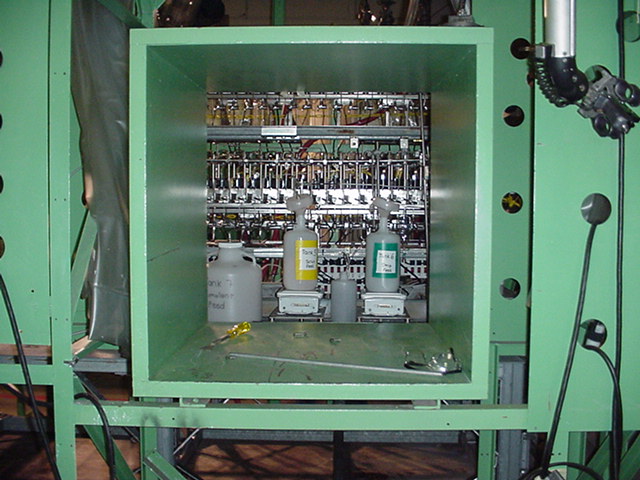
Figure 5. Contactor Apparatus in SRTC Cells Mockup Facility (View B).
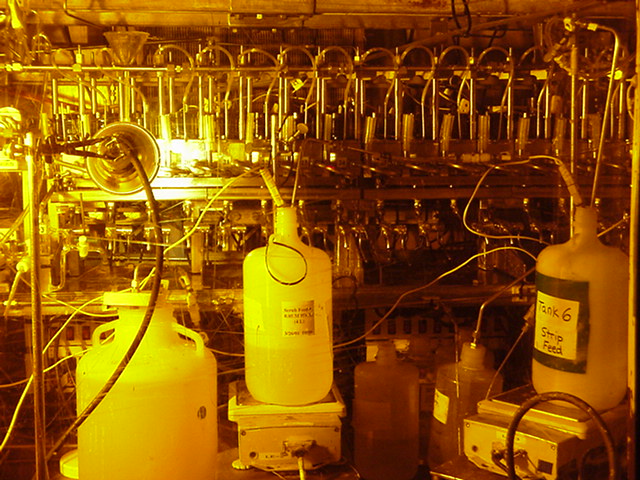
Figure 6. Contactor Apparatus in SRTC Shielded Cells Facility
Figure 7. Equipment Layout Diagram
4.5.2 Control System Description and Operation
The Control System for the CSSX System consists of a Modicon Quantum PLC controller model 113-02, associated Quantum I/O modules, and an industrial hardened workstation. The PLC programming used Taylor ProWORX Plus, version 1.55 software. The PLC code is standard 984LL, ladder block diagram with the enhanced Quantum instruction set. The 18 PLC networks utilized for this test consists of latch logic for the motor run signals, high temperature selection for chiller temperature control scaling, and seven single loop PID controllers with associated logic for setpoint tracking and bumpless transfer. The PLC logic is commanded through the HMI using the Modbus Plus communications protocol, an SA85 adapter, and associated cabling (Figure 8).
Figure 8. Control System Functional Block.
The HMI is an industrial hardened workstation running Microsoft Windows NT Workstation version 4.0 and the Intellution Fix32 version 7.0 HMI software. The HMI uses "poke points" to initiate motor START / STOP commands, collect and display process data, provide alarms, and allow the operator to change setpoints for various process parameters.
The HMI also collects serial data via the workstations four RS232 Communication ports using the Taltech, WinWedge Pro 32 version 3.0c software.
Serial data consist of three balances, and one chiller. Chiller communications are bi-directional, utilizing closed loop setpoint control. If chiller communications are lost, the HMI will place the chiller loop in manual mode, preventing integral windup in the PLC, and sounds an alarm.
The HMI Graphical User Interface (GUI) consists of 10 operator displays showing a system overview (Figure 9), alarm messages, and process graphs in both real-time and historically data (Figure 10). The HMI uses simple point and click functionality for commandable devices, setpoint changes, and moving between the process graphics.
Figure 9. HMI Main Overview Screen.
Figure 10. Typical Historical Display.
4.5.2.1 Instrumentation Calibrations and Control Loop Tuning
The process instrumentation consists of thermocouples, temperature transmitters, flowmeters, and positive displacement metering pumps as the final control elements. The temperature loops were calibrated and verified using NIST traceable M&TE equipment. The flow transmitters and final control elements were "barrel tested" with graduated glassware verified by laboratory personnel and the Techmation Protuner 32 software.
Protuner 32 is a software package used for process analysis and system tuning. This version runs under Windows NT and uses OPC client server software to communicate directly with the PLC State Ram, using the Modbus protocol that provides faster data collection and the ability to analyze conditioned signals and setpoints not traditionally available at the I/O. Following calibration / verification of all instrumentation, all loops were characterized by stepping each of the final control elements through its full range of operation looking for hysteresis and system nonlinearity. A series of tuning steps were made and tuning parameters were calculated (Figure 11).
Figure 11. Typical Loop Analysis Report.
4.5.2.2 System Validation and Integration Testing
The CSSX Tank 37H/44F waste test system was staged in a mockup area and tested in a fully integrated setup. Initial system checkout was performed using water. After successful completion of water runs, simulant was added and extended testing was performed to verify and validate functionality of both hardware and software components in an integrated configuration.
4.6 Experimental Operations
Researchers operated the solvent extraction contactor apparatus following a WPTS operating procedure. The portions of this procedure relating to normal test operation are summarized below.
The solvent extraction process operates with the aqueous phase continuous. To initiate an experiment, the contactor rotors were started and the wash, scrub, and strip stages were filled with wash (0.01 M NaOH), scrub (0.05 M HNO3), and strip (0.001 M HNO3) solutions. With the wash, scrub, and strip feeds running, startup simulant flow was initiated into the extraction bank at Stage 15. The startup simulant was a simulated waste solution containing no cesium. After achieving steady aqueous flow through the extraction stages (Stages 1 to 15), the solvent feed to the wash stage was initiated. When solvent was observed exiting the final strip stage (Stage 32) the aqueous feed was switched from the startup simulant solution to the test solution (containing cesium).
During tests, researchers monitored the test apparatus for the following. Monitoring intervals are indicated in parentheses.
Samples were taken by placing sample containers at the outlet points of the continuously-flowing streams. Samples of the solvent feed stream were not taken during the test (as specified in the sampling plan) to avoid disrupting the hydraulic flow conditions.
At the end of each test, the motor rotation and feed pumps were stopped as quickly as possible to minimize disruption of the contents of each stage for the post-test stage samples. For the test using high level waste, they were stopped simultaneously. Stage samples were obtained by draining each stage into polypropylene bottles.
Following each test, the equipment was rinsed. The extraction stages were rinsed with 2 M NaOH solution to prevent precipitation of aluminum hydroxide in the waste. The Strip stages were rinsed with the remaining strip feed solution (0.001 M HNO3). After flushing with NaOH or strip feed, all stages were flushed with water.
4.7 Sampling and Analysis
Three contactor test runs occurred, each with its own objectives and sampling plan. Appendix A provides a copy of the sampling plan developed prior to the test. A Timekeeper Run Sheet containing sample identification, sampling location, and timing was prepared as described in the test procedure.
Samples taken during the tests were initially taken in 20-mL glass vials with Teflon-lined screw-on caps. During the second test, several vials containing the waste raffinate samples leaked. It was discovered that this particular stream caused the caps to loosen. For the radioactive waste test, the sample containers for this stream were changed to 35-mL polyethylene bottles. The following summarizes the analytical methods that supported each objective.
4.7.1 Stage Efficiency
At the end of each test, researchers drained the contents of each stage into polypropylene bottles. Selected samples were transferred to glass separatory funnels, shaken at ambient temperature for 1 minute, then allowed to separate for approximately 36 hours. The final temperature was measured and portions of each phase were analyzed for Cs. For non-radioactive solutions, inductively coupled plasma mass spectroscopy (ICP-MS) proved more sensitive than flame emission spectroscopy. The salt solutions required dilution in water to reduce the sodium ion concentrations prior to analysis. Because of the dilution, the limiting decontamination factor measured was 200 instead of the pre-test target of 1000.
Non-radioactive solvent samples were digested (0.1 mL sample in 3 mL concentrated HNO3) by heating at 155 °
C for 2 hours in new TeflonÒ
pressure vessels. The digested sample was diluted to 10 mL with water prior to analysis. For the tracer and radioactive waste tests, 137Cs was counted by gamma ray spectroscopic techniques. For low activity samples (<1x10⁷ d/m/mL), portions were removed from the shielded cell and counted using routine methods in the SRTC Analytical Development Section (ADS). The ADS method counts
3 mL of sample for 1000 seconds using an intrinsic germanium solid state detector.
For moderate activity aqueous samples (107 to 108 d/m/mL),
aliquots were diluted x10 or x100 with water in the shielded cell, and a portion
removed for gamma counting. Moderate activity solvent samples were diluted with
a solution of 0.5 molar modifier in ISOPARb
L solvent. For the high activity samples from the radioactive waste test (>1x10⁸
d/m/mL), 5-mL aliquots were counted using an in-cell, sodium iodide detector.
The sodium iodide detector was calibrated with samples that were diluted, removed
from the cell, and counted by the ADS.
4.7.2 Decontamination and Concentration Factors
During each test, researchers obtained 5- or 10-mL samples of the three process streams (waste raffinate, strip effluent, and stripped solvent) at intervals of ½, 1, 2, or 3 hours. Non-radioactive samples were analyzed for cesium by ICP-MS and radioactive samples were analyzed by 137Cs gamma counting techniques described above. The pH was measured on all strip effluent samples using either a pH meter and glass combination electrode (non-radioactive test) or with wide range pH paper (radioactive waste test).
4.7.3 Solvent Entrainment and Degradation
Solvent or aqueous entrainment was measured primarily by the decanters. In addition, periodic samples of the effluent from the decanters were analyzed for modifier and BOBCalixC6 by high performance liquid chromatography (HPLC). Due to the high 137Cs activity of the strip raffinate samples in the radioactive waste test, they were extracted with dodecane (5 mL of dodecane to 5 mL of sample) in the Shielded Cells and the extract removed for analysis.
Solvent degradation was measured on solvent samples taken periodically during the test. Modifier and BOBCalixC6 were measured by HPLC. Trioctylamine was measured by
GC-MS. The results of these analyses will be reported in a revision to this document.
4.7.4 Minor Components
Minor inorganic components in the aqueous streams were measured by ICP-ES, ICP-MS, and AA methods. For highly radioactive samples from the radioactive waste test, 137Cs was removed using ammonium phosphomolybdate hydrate on acrylonitrile polymer (AMP-PAN sorbent). The sample (20 mL) was stirred with AMP-PAN sorbent (2 g) at ambient temperature for 2 hours and filtered using a 0.45 micron disposable filter. The results of these analyses will be reported in a revision to this document.
Minor organic components were measured as follows: tri-n-butyl phosphate, trimethylamine, trioctylamine, dioctylamine, 4-sec-butylphenol, and n-butanol were measured by GC-MS; and di-n-butyl phosphate by ion chromatography. The results of these analyses will be reported in a revision to this document.
5.0 Results
5.1 Non-Radioactive Simulant Testing
5.1.1 Hydraulic Performance
Hydraulic performance verification tests were conducted in the SRTC Shielded Cells mockup facility with CSSX simulated waste containing non-radioactive cesium. The objective of the tests was to verify that the system performed as designed. Two six-hour tests were performed. In each test approximately 14.5 liters of cesium-containing CSSX simulated waste was run through the system. The feed rate setpoints and the observed feed rates as determined by weight changes are included in Table 10.
Table 10. Feed Rate Setpoints and Observed
Flowrates for Non-Radioactive Simulant Tests
|
Process Feed |
Flow Setpoint |
Observed Flow |
|
Waste Simulant |
43.0 mL/min |
41 mL/min |
|
Solvent |
14.1 mL/min |
- - - - - - |
|
Strip |
2.85 mL/min |
2.9 mL/min |
|
Scrub |
2.82 mL/min |
3.0 mL/min |
|
Solvent Wash |
2.85 mL/min |
- - - - - - |
The first test experienced one interruption at 1.5 hours. The second test ran without disruptions. More important are the disruptions that occurred during the approach to steady state operation prior to the first test, subsequent observations, and the means taken to configure the system for successful operation.
During initial start-up the system had to be shut down three times due to flow restrictions in the strip section. In each case, the solvent backed up and was observed flowing into the strip raffinate decanter (D-3). Analysis of the liquid volumes in the stage samples showed a restriction occurring in either Stage 25 or 26. In each case, the total liquid volume in Stages 18-25 ranged from 30-45 mL per stage, and the volume in Stages 26-32 was 15-20 mL per stage. The greater liquid volume in Stages 18-25 was primarily organic, indicating a restriction in the organic flow. Furthermore, emulsions were observed at the aqueous-organic interface for samples taken from Stages 19-24.
It was determined that flow restrictions were caused by inter-stage lines in the strip section that became bent during either the assembly or transfer of the contactor process rack. A bent inter-stage line could require liquid flowing between stages to flow uphill. Since there is very little head pressure driving the flow between stages, this caused a flow restriction, resulting in the flooding of the stages upstream of the restriction. The stages with the most noticeable bends on the organic side of the contactors were the lines between Stages 25 and 26, and between Stages 19 and 20.
After all the organic phase inter-stage lines were adjusted (i.e. realigned), the first non-radioactive simulant test was performed with only one interruption. This interruption was remedied by further realignment of the inter-stage lines, after which operation resumed. Following the first test, the aqueous inter-stage lines were also examined and several were found to be in need of adjustment. Inspection of the extraction section indicated adequate alignment of the inter-stage lines. The second non-radioactive simulant test was then performed without interruption.
5.1.2 Waste Decontamination
Two tests were performed in the Shielded Cells mockup facility with non-radioactive CSSX simulated waste containing cesium. Due to analytical limits for detecting non-radioactive cesium, the measurable DF for the extraction section was approximately 200. Both non-radioactive simulant tests demonstrated a DF in excess of 200.
5.1.3 Solvent Decontamination
Because of analytical detection limits, measurable DF value for the strip section during non-radioactive testing was approximately 50. As a result, no useful conclusions can be drawn from the solvent recycle data from the test in the mockup cells.
5.1.4 Concentration Factors
Concentration factors provide some insight into behavior of the process. In the first test, prior to the process upset at 1.5 hours, low concentration factors of 11.0-11.5 were observed. After the inter-stage lines were adjusted and the process restarted, the concentration factor averaged 14.3 from two to five hours of run time. The second non-radioactive simulant test, which ran without interruptions, had an average CF of 14.1 for the entire test.
5.1.5 Second Phase Carryover
Second phase carryover for the first non-radioactive test was not accurately measured. Second phase carryover rates for the second experiment are shown in Table 11. Accumulated volume of second phase in each decanter was visually estimated.
Table 11. Non-Radioactive Test Estimated Second Phase Carryover Rates
|
D-1: |
2.5 mL of a total flow of 15000 mL (0.02%) (waste raffinate) |
|
D-2: |
1.0 mL of a total flow of 5100 mL (0.02%) (solvent effluent) |
|
D-3: |
1.5 mL of a total flow of 1050 mL (0.14%) (aqueous strip effluent) |
|
D-4: |
no detectable second phase (aqueous wash effluent) |
5.1.6 Stage Data
The amount of cesium in the various process fluids and available analytical limits allowed for the determination of only a few distribution coefficients in the extraction and strip sections. Distribution coefficients were measured for extraction stages 12-15 and found to range between 13 and 22. Distribution coefficients in the strip stages were 0.07 in Stage 19 and 0.05 in Stages 20 and 22. Distribution coefficients listed in Table 12 were measured on stage samples at 21 oC following the test. The DCs values were corrected to the stage temperatures measured near the end of the test (Section 5.1.7).
Table 12. Distribution Coefficients
|
Temperature Corrected |
|||||||
|
D(Cs) |
D(Cs) |
D(Cs) |
D(Cs) |
D(Cs) |
D(Cs) |
||
|
Non-Rad |
Spiked |
Real |
Non-Rad |
Spiked |
Real |
||
|
Section |
Stage # |
Simulant |
Simulant |
Waste |
Simulant |
Simulant |
Waste |
|
Wash |
W |
9.4 |
|||||
|
Extraction |
1 |
0.9 |
15.0 |
0.68 |
12.6 |
||
|
2 |
1.0 |
13.1 |
0.79 |
11.0 |
|||
|
4 |
19.9 |
14.5 |
16.0 |
12.2 |
|||
|
6 |
18.9 |
12.5 |
15.2 |
10.5 |
|||
|
8 |
10.6 |
12.4 |
8.5 |
10.5 |
|||
|
10 |
22.9 |
13.1 |
18.5 |
11.0 |
|||
|
12 |
16.0 |
19.0 |
13.4 |
13.4 |
15.3 |
11.3 |
|
|
13 |
22.9 |
21.0 |
14.4 |
19.2 |
16.9 |
10.7 |
|
|
14 |
20.7 |
19.6 |
14.2 |
17.4 |
15.8 |
10.2 |
|
|
15 |
26.2 |
13.2 |
12.3 |
22.0 |
10.7 |
8.8 |
|
|
Scrub |
16 |
2.24 |
5.82 |
1.52 |
3.67 |
||
|
17 |
2.08 |
1.63 |
|||||
|
Strip |
18 |
0.30 |
0.79 |
0.21 |
0.46 |
||
|
19 |
0.23 |
0.23 |
0.31 |
0.07 |
0.15 |
0.17 |
|
|
20 |
0.16 |
0.21 |
0.28 |
0.05 |
0.13 |
0.15 |
|
|
22 |
0.16 |
0.13 |
0.32 |
0.05 |
0.08 |
0.18 |
|
|
24 |
0.12 |
0.24 |
0.04 |
0.07 |
0.14 |
||
|
26 |
0.10 |
0.34 |
0.06 |
0.21 |
|||
|
28 |
0.09 |
0.24 |
0.05 |
0.14 |
|||
|
30 |
0.09 |
0.10 |
0.35 |
0.06 |
|||
|
32 |
0.10 |
0.07 |
|||||
The data were also used to calculate stage efficiencies using the SASSE modeling program developed at Argonne National Laboratory. The calculations showed extraction stage efficiencies of 86+6%. Strip section stage efficiencies were calculated to be 96+6%.
5.1.7 Stage Temperatures
Due to the lack of airflow in the mockup area, stage temperatures without temperature control ran higher than expected. For both non-radioactive simulant tests, the extraction stage temperatures were controlled at 22-23 oC. The scrub stages began at ambient temperature (approximately 20-22 oC) and heated up to steady state values of 32-34 oC. The strip stages operated at steady state between 38 oC and 40 oC.
5.1.8 Solvent Condition and Impurities
Analyses of solvent reservoir and solvent recycle samples show no cesium above the detection limit of 7 mg/L. The cesium levels in the solvent wash samples were measured to be below the detection limit of 0.075 mg/L.
5.2 Shielded Cells Simulant Tests
5.2.1 Hydraulic Performance
During radioactive simulant testing, two back-to-back six-hour tests were performed as a continuous 12-hour experiment. In the first test, approximately 15 liters of spiked CSSX simulated waste was run through the system. The second test processed approximately 13 liters of spiked Tank 37H/44F simulant. The feed rate setpoints and the observed feed rates as determined by weight changes from the balances are included in Table 13.
Table 13. Feed Rate Setpoints and Observed Feed Rates for Shielded Cells Tests
|
Process |
Flow |
Observed |
Observed |
|
Waste – Spiked Simulant |
43.0 mL/min |
38-41 mL/min |
35-38 mL/min |
|
Solvent |
14.1 mL/min |
- - - - - - |
- - - - - - |
|
Strip |
2.85 mL/min |
2.9 mL/min |
2.9 mL/min |
|
Scrub |
2.82 mL/min |
2.9 mL/min |
2.9 mL/min |
|
Solvent Wash |
2.85 mL/min |
- - - - - - |
- - - - - - |
The entire 12-hour experiment was performed without interruption. A small amount of emulsion was observed growing in the solvent wash decanter (D-4) throughout the 6-hour test with CSSX simulated waste. Its growth was minimal when the feeds were switched. Overall hydraulic performance for the test was viewed as excellent.
It is important to note that adjustments were made to two organic inter-stage lines in the strip section prior to the test because it was judged that they had become bent during transfer of the system into the shielded cells. Due to the location of the aqueous inter-stage lines in the strip section and all of the lines in the extraction section (located on the back side of the apparatus), it was impossible to either observe or adjust those lines.
5.2.2 Waste Decontamination
Data from the first six hours using the CSSX simulated waste show typical DF values in excess of 40,000 for the first three hours and then a gradual decline from four to six hours. At the introduction of the Tank 37H/44F simulant, the DF values exceed 60,000 for the next two hours. A brief decline in DF values at nine and ten hours can likely be attributed to sampling errors and/or contamination. The DF values at the end of the test were approximately 36,000.
Due to the detection limits and the potential for sample contamination, it is difficult to determine if the gradual decline in DF from 4-6 hours is a trend or simply sample variability. There are distinct differences between the two feeds, particularly the presence of organic impurities in the CSSX simulated waste that are not present in the Tank 37H/44F simulant. Experience can be used to make a case for both views, yet insufficient data exist to make a strong case for either.
Averaging the DF values from 1.5 to 6.0 hours yields a value of 43,000 for the spiked CSSX simulated waste. Similarly, averaging the results for the spiked Tank 37H/44F simulant portion of the test (data from 7 to 12 hours) yields an average DF of 63,000. A plot of the DF value as a function of time is shown in Figure 12.
5.2.3 Solvent Decontamination
Testing with radioactive simulants showed that the stripping section performed extremely well. If the strip section does not adequately remove cesium from the loaded solvent, performance of the extraction section will be adversely affected. The strip section performance must equal or exceed the extraction section performance. Thus, the target value for strip section performance is a DF of 40,000.
Results from both spiked simulant tests indicate strip decontamination factors well in excess of 40,000. For the first six hours with the spiked CSSX simulated waste, the average strip DF value was 281,000 with a minimum of 72,400. The final six hours using spiked Tank 37H/44F simulant produced an average strip DF of 256,000 with a minimum of 102,000. A plot of the DF value as a function of time is shown in Figure 13.
Figure 12. Waste Decontamination DF Value as a Function of Time.
Figure 13. Solvent Decontamination DF Value as a Function of Time.
5.2.4 Concentration Factors
Concentration factors for each of the spiked simulant tests show behavior similar to that of the non-radioactive simulant tests. For the first six hours, the spiked CSSX simulated waste yielded an average CF of 14.8 and exceeded 15 during hours 4 through 6. The spiked Tank 37H/44F simulant produced a six-hour average of 13.8 for the CF. It is important to note that while the test with Tank 37H/44F simulant produced consistent cesium values in the strip raffinate (indicative of steady state), the CF data for the CSSX simulated waste exhibited a gradual increase up to the time the CSSX simulated waste was discontinued. A plot of the CF value as a function of time is shown in Figure 14.
Figure 14. CF Value as a Function of Time.
5.2.5 Second Phase Carryover
Second phase carryover for the radioactive simulant test was estimated based on solvent heights in the process decanters. For this reason, accurate measurements are extremely difficult. Estimated second phase carryover rates for the radioactive simulant test are shown in Table 14.
Table 14. Radioactive Simulant Test
Estimated Second Phase Carryover Rates
|
D-1: |
2.5 mL of a total flow of 28,000 mL (0.01%) (waste raffinate) |
|
D-2: |
2.0 mL of a total flow of 10,100 mL (0.02%) (solvent effluent) |
|
D-3: |
2.0 mL of a total flow of 2,100 mL (0.10%) (aqueous strip effluent) |
|
D-4: |
24 mL of a total flow of 1,050 mL (2.3%) for the first six hours |
5.2.6 Stage Data
The amount of cesium in the various process fluids and available analytical limits allows for the determination of distribution coefficients (DCs) for most of the extraction and strip stages. Distribution coefficients for the extraction stages were 10.7 in Stage 15 and 15-17 in Stages
4-14. The aqueous phase sample for stages 1 and 2 appear to have been contaminated based on lower values in stages 4 and 6. The temperature corrected distribution coefficients in the strip stages were 0.21 in Stage 18 and systematically decreased from 0.15 in Stage 19 to 0.05 in Stage 28. Distribution coefficients listed in Table 12 were measured on stage samples at 21 oC following the test. They were corrected to the stage temperatures near the end of the test (see Section 5.2.7).
The data were also used to calculate stage efficiencies using the SASSE modeling program.15 These calculations showed extraction stage efficiencies of 94+6%. Strip section stage efficiencies were calculated to be 82+6%. A plot of the stage activity data for the end of the radioactive simulant test is attached as Figure 15.
5.2.7 Stage Temperatures
The presence of high airflow in the shielded cells caused contactor temperatures to be much lower than those observed in mockup. For both radioactive simulant tests, the extraction stage temperatures were controlled at 23-24 oC. The scrub stages began at ambient temperature and heated up to steady state values of 26-28 oC. The strip stages operated at steady state between 28 oC and 31 oC.
Figure 15. Stage Data – Spiked Simulant
5.2.8 Solvent Condition and Impurities
The solvent reservoir sample at the end of the test measured 367 dpm/mL. Solvent recycle samples for the last seven hours of the test had a similar average activity of 410 dpm/mL. The solvent wash sample at the end of the test showed 1936 dpm/mL.
5.3 Tank 37H/44F Waste Demonstration
5.3.1 Hydraulic Performance
Forty-eight hours of testing with an actual Tank 37H/44F composite waste was performed over a 65-hour period. Approximately 106 liters of waste were treated during the test. The feed rate set points and the observed feed rates as determined by weight changes from the output of the balances for the first 25 hours and the final 10 hours are included in the table. Variable conditions were applied between 25 and 38 hours and are discussed below.
Table 15. Hydraulic Performance Feed Rate Setpoints and Observed
Feed Rates
|
Process |
Flow Setpoint |
Observed |
Flow Set |
Observed |
|
Waste |
43.0 mL/min |
36 mL/min |
43.0 mL/min |
36 mL/min |
|
Solvent |
12.8 mL/min |
- - - - - - |
12.8 mL/min |
- - - - - - |
|
Strip |
2.85 mL/min |
2.9 mL/min |
2.45 mL/min |
2.4 mL/min |
|
Scrub |
2.82 mL/min |
3.4 mL/min |
2.82 mL/min |
3.4 mL/min |
|
Solvent Wash |
2.85 mL/min |
- - - - - - |
2.85 mL/min |
- - - - - - |
Consistent with the spiked simulant test, the Tank 37H/44F waste test exhibited excellent hydraulic performance for the first 27 hours of the test. However, at approximately 23 hours into the test, it was determined that the waste flow rate indicated by the process flowmeter did not match the rate determined by the balance output trend or the total waste volume collected. Analyses indicated that the waste flow was approximately 36 mL/min compared to the set point of 43 mL/min. This produced a concentration factor of 12.5-13.0 during that portion of the test.
At 25.5 hours, the waste feed rate was gradually raised to an indicated value of 48 mL/min (approx. 41 mL/min) in order to meet the target concentration factor of 15. At 27 hours, the waste feed rate was again increased to an indicated value of 49.5 mL/min. At 27.5 hours, solvent was observed backing up in the extraction section into the waste raffinate decanter (D-1). System operation was shut down.
The system was successfully restarted at the original flow conditions. Based on the behavior prior to the first process upset, a target waste flow of 48 mL/min as shown by the readout was established. The test was restarted at the original condition of waste feed at 43 mL/min at the readout. It was increased to 44 mL/min at 45 minutes. At 75 minutes the flow was increased to 45 mL/min, and again to 46 mL/min at 105 minutes. After an additional
60 minutes, the flow was increased to 46.7 mL/min. After two more hours the flow was increased to 47.1 mL/min (five hours after restart). Six hours after restart, solvent was again observed backing up in the extraction section into the waste raffinate decanter (D-1). It is important to note that liquid was observed in the standpipe of Stage 4 a few minutes before solvent was seen in D-1.
Conditions prior to the first two upsets were used to establish conditions for restart. It was estimated that a maximum indicated waste flow of 46 mL/min would produce stable flow. The system was successfully restarted at 46 mL/min. The process ran for 3.5 hours with Tank 37H/44F waste feed before solvent was again observed in the D-1 decanter. As before, liquid was observed in the Stage 4 standpipe just before solvent was seen in D-1. However, because of the inability to adequately observe or adjust the extraction stages, no changes could be made to the system. It was during this shutdown that the strip sections became alkaline (instead of slightly acidic) and the solvent reservoir was contaminated with cesium.
The system was restarted at the initial waste flow conditions and reduced strip flow conditions to achieve the desired concentration factor of 14.5-15.0. The system was operated at these conditions for 10.5 hours without incident. The successful operation at the initial waste flow conditions indicates that the hydraulic performance of the system had not changed significantly from its condition during the first 26 hours of the Tank 37H/44F waste test. The process upsets could be attributed to a physical flow capacity limit inherent in the extraction section. It is unclear whether any extraction section inter-stage lines were bent during transfer of the equipment rack into the shielded cells. However, it is important to note that emulsions were observed in the Stage 13-15 samples at the end of the test.
5.3.2 Waste Decontamination
Data for the Tank 37H/44F waste test show strong performance relative to the target DF values throughout the entire test, including the performance following the first two process upsets. Prior to the first process upset after 27 hours of operation, the average DF was 1.46 million with a low value of 326,000. These are well above the target value of 40,000 and the Tank 37H/44F waste requirement of 13,000. During testing after the first two disruptions, the average DF was 461,000 with a low value of 48,800. It is only after the third process upset that contamination of the solvent reservoir reduced the DF to a minimum of 8,600. However, the data show that the process gradually recovered from this upset, and the DF steadily increased throughout the remainder of the test to values in excess of the 13,000 requirement and the 40,000 target. The composite waste DF averaged 804,000 for the first 26 hours (prior to the first process upset), 511,000 for the first 34 hours (prior to the second upset), and 40,000 for the entire 48-hour test. A plot of the waste DF value as a function of time is shown in Figure 12.
5.3.3 Solvent Decontamination
The Tank 37H/44F waste test showed that the strip section performed extremely well throughout the test. The data show that the process upsets, because they occurred in the extraction section, did not adversely affect the strip DF. The strip section produced a composite DF of 182,000 for the first 34 hours and 154,000 for the entire 48-hour test with a minimum of 45,000 coming immediately after the final restart. These values are well in excess of the target DF of 40,000. A plot of the solvent DF value as a function of time is shown in Figure 13.
5.3.4 Concentration Factors
Concentration factors for the Tank 37H/44F waste test depict 1) the attainment of steady-state operation during the first 26 hours and the final 10 hours of the experiment; and 2) attempts after 26 hours to increase the CF. The concentration factor from 2-26 hours is essentially constant and has an average value of 12.8. Efforts to increase the concentration factor produced three process upsets over an 11-hour period. During that time the concentration factor varied from 13.7 to 15.5. The final 10.5 hours of stable operation was performed at an average CF of 14.4. A plot of the CF value as a function of time is shown in Figure 14.
5.3.5 Second Phase Carryover
Second phase carryover for the Tank 37H/44F waste test was estimated based on solvent heights in the process decanters. For this reason, accurate measurements are extremely difficult. Estimated second phase carryover rates for the Tank 37H/44F waste test is shown in Table 16.
Table 16. Tank 37H/44F Waste Test Estimated Second Phase Carryover Rates
|
D-1: |
2.5 mL of a total flow of 30,000 mL (0.01%) for the first 14 hours (waste raffinate) |
|
D-2: |
3.0 mL of a total flow of 37,000 mL (0.01%) (solvent effluent) |
|
D-3: |
19 mL of a total flow of 9,000 mL (0.21%) (aqueous strip effluent) |
|
D-4: |
no measurable carryover for the first 27 hours |
5.3.6 Stage Data
The amount of cesium in the experiment allowed for measurement of distribution coefficients in all stages. Distribution coefficients were calculated for extraction stages 1-15 and found to be 8.8 in Stage 15 and 10-13 in Stages 1-14. The temperature corrected distribution coefficients in the strip stages were 0.46 in Stage 18, 0.14-0.21 in Stages 19-28, and 0.06-0.07 in Stages 30 and 32. Distribution coefficients are listed in Table 12 as measured on stage samples at 21 oC following the test. These were corrected to the stage temperatures near the end of the test (see Section 5.3.7).
The data were also used to calculate stage efficiencies using the SASSE modeling program.15 These calculations showed extraction stage efficiencies of 84+4%. Strip section stage efficiencies were calculated to be 82+4%. A plot of the stage activity data for the Tank 37H/44F waste test is attached as Figure 16.
5.3.7 Stage Temperatures
Some fluctuation of temperatures occurred throughout the test as a result of engineering decisions. The primary decision related to the objective to maintain the temperatures in Stage 18 and 19 above 28 oC. When the temperature in these stages began to slowly decline, the temperature in the extraction section was increased. This occurred 21 hours into the experiment. When it was apparent that the extraction section change was having little effect on Stages 18 and 19, a heat lamp was placed in front of these two stages. The heat lamp was introduced after 26 hours of testing. When the heat lamp was introduced, the extraction section temperatures were returned to their original set points. An extended process downtime that affected contactor block temperatures occurred after the third process upset at 37 hours. Table 17 shows the general shift in temperatures throughout the test.
Figure 16. Stage Data – Tank 37H/44F Waste
Table 17. Shift in Temperature Throughout Test
|
0-16 hours |
16-21 hours |
21-26 hours |
26-38 hours |
38-48 hours |
|
|
Stages 1-15 |
22-25 oC |
22-25 oC |
23-27 oC |
22-25 oC |
22-25 oC |
|
Stage 16 |
25-28 oC |
26-27 oC |
26-27 oC |
26-29 oC |
27-29 oC |
|
Stage 17 |
24-27 oC |
24-25 oC |
24-25 oC |
24-25 oC |
26-28 oC |
|
Stage 18 |
27-29 oC |
27-28 oC |
27-28 oC |
33-34 oC |
32-33 oC |
|
Stage 19 |
29-32 oC |
30-31 oC |
29-30 oC |
33-35 oC |
33-35 oC |
|
Stages 21-31 |
28-33 oC |
29-32 oC |
28-31 oC |
28-32 oC |
31-34 oC |
|
Stage 32 |
26-28 oC |
26-27 oC |
26-27 oC |
26-27 oC |
28-30 oC |
5.3.8 Solvent Condition and Impurities
The solvent reservoir sample analyzed at the end of the test measured 25,800 dpm/mL of cesium activity. Solvent recycle samples for the last six hours measured similar cesium levels of 19,000-20,000 dpm/mL. During the experiment, solvent recycle samples show a steady-state value for the first 10 hours of 15,000-17,000 dpm/mL. As the Stage 18 and 19 temperatures decreased, the activity in the recycle solvent increased from 17,000 at 10 hours to 22,000-61,000 dpm/mL during 13-25 hours of operation. After the heat lamp was introduced into the system at Stages 18 and 19, the activity levels immediately drop until the third process upset at 36.5 hours. During the third process upset, the solvent reservoir became contaminated due to alkalinity in the strip section. The data trend, as reflected in the solvent decontamination data, is shown in Figure 13.
Solvent wash data reflect a trend similar to the solvent recycle data. Activity values are below 11,000 dpm/mL at 12, 24, and 48 hours. The sample at 36 hours, which is taken just before the third process interruption, shows 68,700 dpm/mL of cesium.
6.0 Discussion
6.1 Hydraulic Performance
Large-scale centrifugal contactors have been operated at the Savannah River Site for many years without hydraulic performance problems. Hydraulic performance of centrifugal contactors tends to improve with increasing overall dimensions. Large contactors are easier to operate because 1) they promote better phase separation, 2) there are higher head pressures and liquid momentum for transferring liquids between stages, 3) process liquid flow rates are high enough for accurate pumping and measurement, and 4) surface-to-volume effects are reduced.
Hydraulic performance in 2-cm centrifugal contactors provides an overall indication of flowsheet behavior. Experience indicates that when the system hydraulics are acceptable, overall flowsheet performance will match expectations. Hydraulic performance is particularly important in 2-cm centrifugal contactors because of small head pressures and high surface-to-volume ratios. Even minor process anomalies or configuration changes can completely disrupt process operations. This was illustrated in this program by the need to realign strip section inter-stage lines prior to successful operation with non-radioactive simulants.
Furthermore, experiments at ANL using CSSX simulated waste in similar 2-cm centrifugal contactors reported that the maximum attainable flow rates were 60 mL/min in the extraction section and 40 mL/min in the strip and scrub sections. At SRTC, the non-radioactive CSSX simulated waste and spiked CSSX simulated waste ran at extraction section total flow rates of 55-58 mL/min. These are very close to the maximum throughput measured at ANL. Therefore, the contactors employed in this study were operated at the upper extreme of their effective operational range.
It is also important to note that when the feed was switched from CSSX simulated waste to Tank 37H/44F simulant during the spiked simulant test that a process change occurred. The indicated waste flow rate remained the same but the measured flow rate (based on mass change in the feed tank as a function of time) immediately decreased from 38-41 mL/min to 34-37 mL/min. These data point to the reality that the Tank 37H/44F waste has physical properties that differ somewhat from the CSSX simulated waste, and that the maximum attainable flow rates for the Tank 37H/44F waste might be lower than those measured at ANL using CSSX simulated waste. Table 18 shows the differences between the two simulants that would likely affect both the hydraulic performance and the accuracy of the Rheotherm® flowmeters. F. F. Fondeur obtained the data and evaluated the effect on flowmeter readings.
Because the measured flow rates dropped approximately 4 mL/min with the change in simulant feed, a simple estimation places the maximum allowable flow rate in the extraction section for Tank 37H/44F waste at 56 mL/min. This assumes that the Tank 37H/44F waste behaves in a similar manner as the Tank 37H/44F simulant.
Table 18. Differences Between Two Simulants and Tank 37H/44F
Waste
|
|
|
|
Thermal Conductivity (W/m oC) |
Heat Capacity |
|
CSSX Simulated Waste |
1.236 |
2.5 |
0.649 |
0.859 |
|
Tank 37H/44F Simulant |
1.212 |
3.2 |
0.713 |
0.871 |
|
Tank 37H/44F Waste |
1.217 |
3.2 (estimate) |
0.713 (est.) |
0.871 (est.) |
Examination of the Tank 37H/44F waste data indicates that successful steady operation with Tank 37H/44F waste occurred at a total extraction section flow rate of 52 mL/min. The process failed to operate at steady state when the total extraction section flow rates were
55-58 mL/min, which is near or above the maximum flow capacity estimated from the spiked simulant tests. As a result, the hydraulic performance and the associated interruptions observed are not unexpected. The data indicate that the process interruptions occurred because the maximum hydraulic throughput of the system was exceeded due to physical property differences between the Tank 37H/44F waste and the CSSX simulated waste.
Future studies should consider a closer measurement of stage organic and aqueous volumes. The startup work in the mockup facility showed that location of flow restrictions in the strip section could be seen in the total liquid volumes and O/A ratios in the stages. The data indicated the location of the primary restriction occurred where the O/A ratios and total liquid volumes showed a noticeable shift. Because it is possible that reduced hydraulic performance for the Tank 37H/44F test is attributable to a flow restriction, better stage data in the future can be instrumental in determining if a flow restriction caused the reduced flow capacity and process upsets in the extraction section.
6.2 Second Phase Carryover
Second phase carryover is defined as an unwanted phase observed exiting in a primary product stream (e.g. the organic solvent entrained in the aqueous strip raffinate stream). Second phase carryover is directly related to hydraulic performance. It is addressed here separate from the other hydraulic performance factors because of the requirement to maintain second phase carryover below 1.0 vol %. Excessive second phase carryover of organic in aqueous streams is indicative of poor hydraulic performance and can lead to large losses of valuable solvent.
Second phase carryover values reported represent data from steady state conditions. Based on the data for all four decanters for each test, second phase carryover at steady state was consistently maintained well below 1.0 vol %. For example, solvent carryover in the waste raffinate decanter (D-1) at steady state was at or below 0.02 vol % for all tests (Table 11). Excessive solvent carryover occurred during the process upsets in the Tank 37H/44F waste test due to flooding of the contactors caused by exceeding the maximum operating throughput of the contactors.
Aqueous carryover in the solvent recycle decanter (D-2) was also at or below 0.02 vol % for all experiments. Solvent carryover in the strip raffinate (D-3) at steady state was at or below 0.21 vol %. Larger amounts of carryover were observed in the early stages of non-radioactive testing, but after the strip section inter-stage lines were realigned the carryover values were all below the 1.0 vol % requirement. Excessive carryovers did not occur in the final non-radioactive test, either spiked simulant tests, or the Tank 37H/44F waste test.
Solvent carryover in the solvent wash decanter (D-4) was at or below 0.37 vol % for all steady state operations. Steady state conditions occurred during the non-radioactive simulant test, the Tank 37H/44F portion of the spiked simulant tests, and much of the Tank 37H/44F waste test. Throughout the non-radioactive simulant test and during the first 27 hours of the Tank 37H/44F waste test, the liquid in the D-4 decanter was clear. The clear liquid suggests that Stage W (solvent wash stage) was running an organic continuous phase. At other times the liquid was cloudy, implying that Stage W ran aqueous phase continuous. When the process runs aqueous phase continuous, small amounts (0.37 vol %) of second phase carryover are observed. Tests at ANL have exhibited both conditions4, but the clear, organic continuous phase is the one that is both expected and preferred.
Excessive second phase carryover (2.3 vol %) was observed for the CSSX simulated waste portion of the spiked simulant test. However, the gradual increase in waste raffinate and strip raffinate activity (Figure 17), and the CF (Figure 14) suggest that the system was not at steady state for the first six hours of the spiked simulant tests. The possible causes of this are discussed in the next section.
Figure 17. Spiked Simulant Data.
6.3 Waste and Solvent Decontamination
One leading measure of system performance is the waste decontamination factor (DF) in the extraction section. The waste enters Stage 15 where it is combined with scrub solution, and it exits Stage 1. Extraction is primarily affected by hydraulic performance, stage temperatures, and cesium concentration in the solvent feed stream. The DF required for the demonstration is 13,000. This represents the decontamination required to take the tank 37H/44F waste below 45 nCi/g. Below 45 nCi/g, cesium-lean salt waste can be immobilized in the SRS Saltstone facility. A higher waste DF of at least 40,000 was established as a goal for comparison with other technologies.
Solvent decontamination in the stripping section is also critical. The stripping section decontaminates cesium-loaded solvent that will be recycled back to Stage 1 of the extraction section. If sufficient stripping does not occur (low solvent DFs), cesium in the solvent recycle is fed to Stage 1 and reduces the maximum attainable waste DF. A solvent DF of 40,000 or greater is necessary to sustain a steady-state waste DF of 40,000 and quickly recover from process upsets.
6.3.1 Non-Radioactive Simulant Testing
Testing in the SRTC Shielded Cell mockup facility provided little insight into a steady-state waste DF due to analytical detection limits for non-radioactive cesium. Using CSSX simulated waste, the maximum measurable DFs for waste and solvent were 200 and 50, respectively. Unfortunately this did not provide sufficient sensitivity to assess whether the system was operating properly. Instead, the stage efficiency and associated DCs values were used to determine that the equipment could be transferred from the mockup facility into the Shielded Cells. The DCs and stage efficiency data, to be discussed below, showed that the system was operating correctly.
6.3.2 Radioactive Simulant Testing
Once the system was assembled in the Shielded Cells, the spiked simulant test was conducted with two separate simulants (as described in Section 5.0). The purpose of the experiment was to provide correlation with the results observed in mockup using CSSX simulated waste and to validate the performance of the flowsheet for the actual Tank 37H/44F waste using the spiked Tank 37H/44F simulant. The spiked simulant test also allowed for a comparison with the ANL "Proof-of-Concept" tests that successfully demonstrated the flowsheet and equipment using spiked CSSX simulant.4
Both tests demonstrated that the extraction and strip sections of the process were working properly. In the extraction section, the average waste DF value for the CSSX simulated waste was 53,000 and the Tank 37H/44F simulant averaged 63,000; the ANL proof-of concept tests had an average value of 69,000.4 The stripping section performance exceeded the extraction section. In the stripping section, the average solvent DF value for the CSSX simulated waste was 281,000 and the Tank 37H/44F simulant averaged 256,000; the ANL tests measured an average solvent DF of 74,000.4 All of the decontamination factors measured in the shielded cells exceeded the target of 40,000.
A closer look at the data shows that the waste decontamination data for the first six hours using the CSSX simulated waste show a different behavior than the data from the final six hours using the Tank 37H/44F simulant (see Figure 12). The waste DF values are well in excess of 40,000 for the first three hours and then gradually decrease from four to six hours. Upon introduction of the Tank 37H/44F simulant, the DF values exceed 60,000 for the next two hours. A brief decrease in DF values at nine and ten hours can likely be attributed to contamination. The DF values at the end of the test are approximately 36,000.
The cesium activity data for the waste raffinate, strip raffinate, and solvent recycle are included in Table 19. A plot of the waste raffinate activity values (Stage 1 aqueous) with strip raffinate activity (Stage 18 aqueous) and solvent recycle activity (Stage 32 organic) shows an apparent correlation between the waste raffinate and the strip raffinate for the first eight hours and the final two hours (Figure 17). This apparent correlation between waste activity and strip raffinate activity provides a basis for suspecting that the waste raffinate DF values at 9 and 10 hours are distorted by sampling errors or contamination.
Table 19. Cesium Activity Data for Radioactive Simulant Test
|
Spiked CSSC Simulated Waste |
|||
|
Time |
Strip Raffinate |
Waste Raffinate |
Solvent Recycle |
|
1.5 |
7.87E+07 |
29 |
207 |
|
2.0 |
8.14E+07 |
188 |
212 |
|
3.0 |
7.95E+07 |
111 |
169 |
|
4.0 |
8.56E+07 |
393 |
1126 |
|
5.0 |
8.89E+07 |
1032 |
362 |
|
6.0 |
9.22E+07 |
1984 |
585 |
|
Spiked Tank 37H/44F Simulant |
|||
|
7.0 |
7.40E+07 |
82 |
407 |
|
8.0 |
6.85E+07 |
23 |
180 |
|
9.0 |
7.41E+07 |
443 |
199 |
|
10.0 |
6.97E+07 |
1510 |
236 |
|
11.0 |
7.23E+07 |
144 |
727 |
|
12.0 |
7.25E+07 |
144 |
508 |
Solvent decontamination data for the full test show no correlation with the other activity data. This behavior could indicate that the CSSX simulated waste feed was not well mixed and had a cesium concentration gradient within the waste feed tank. The data may also imply a slow build-up of cesium in the extraction section during the first six hours that begins to exit Stages 1 and 18 between four and six hours.
Distinct differences exist between the two simulant feeds, particularly the presence of organic impurities in the CSSX simulated waste. The changing of feeds effectively purged the system of whatever caused the apparent cesium retention because waste DF and CF values quickly achieve steady state after the change. This shows consistency with the second phase carryover data for decanter D-4. In the D-4 decanter, the growth of an emulsion layer was observed only during the feeding of the spiked CSSX simulated waste. Analyses of the emulsion layer are pending.
While a trend may exist, detection limits and the potential for sample contamination make it difficult to determine if the gradual decrease in DF from 4-6 hours is a trend or simply sample variability. There are constituents, particularly organic impurities in the CSSX simulated waste, that are not present in the Tank 37H/44F simulant. It is also feasible to have a cesium concentration gradient in the CSSX simulated waste feed that produces an increasing waste DF and CF until the waste feed is changed to one where no gradient exists. Experience can be used to make a case for all three views, yet insufficient data exist to make a strong case for any particular one.
6.3.3 Tank 37H/44F Waste Testing
The waste and solvent decontamination factors show strong validation of the process flowsheet, chemistry, and equipment. In the extraction section, the waste DF data exceed the required DF throughout the test, except for the period following the third process upset. The composite waste cesium DF was 804,000 for the first 26 hours, 511,000 for the first 34 hours (prior to the second upset), and 40,000 for the entire 48-hour experiment (including all process upsets), which is greater than the 13,000 requirement. The performance of the strip section, once again, exceeded the extraction section. The strip section produced an average solvent cesium DF of 182,000 for the first 34 hours and 152,000 for the entire 48-hour test with a minimum of 45,000 coming immediately after the third process interruption. It should be noted that the process upsets, because they occurred primarily in the extraction section, did not significantly affect the solvent cesium DF.
Examination of the data reveals that the waste DF for the Tank 37H/44F waste test was a function of the cesium concentration in the solvent being fed to the extraction section. As was stated above, if sufficient stripping does not occur (leading to low solvent DFs), cesium in the solvent recycle is fed to Stage 1 and reduces the maximum attainable waste DF in the extraction section. Figure 18 depicts the relationship between waste DF and solvent DF. The figure clearly illustrates that whenever the solvent DF decreases (an increase in cesium to Stage 1) there is a corresponding decrease in the waste DF.
Prior to the first process upset after 27 hours of operation, the arithmetic average waste DF was 1.46 million with a low value of 326,000. During testing after the first two disruptions the arithmetic average DF decreased to 461,000 with a low value of 48,800. It is after the third process upset that contamination of the solvent reservoir reduces the waste DF to below 13,000 and greatly impacts the composite waste DF. However, the data show that the process recovered from this upset, and the waste DF steadily increased throughout the remainder of the test to values well in excess of the 13,000 requirement. These data clearly depict a process that can achieve the required DFs at steady state and can recover quickly from unexpected process interruptions while maintaining the overall DF.
Solvent wash data reflect a trend similar to the solvent recycle data. Activity values are below 11,000 dpm/mL at 12, 24, and 48 hours. The sample at 36 hours, which is taken just before the third process interruption, shows 68,700 dpm/mL of cesium.
Figure 18. Extraction DF vs. Solvent DF
The data also demonstrate the dependence of strip section behavior on temperature. Figure 19 plots Stage 18 temperature and the solvent raffinate (from Stage 32) activity as a function of time. Through the first 32 hours of operation, which includes the first process interruption, the effectiveness of stripping corresponds directly to the strip section temperatures. After initial start up, the activity in the solvent slowly increases as the Stage 18 (and all other stages) temperature decreases. Just before 26 hours the heat lamp is placed in front of Stages 18 and 19. The response of the strip section to more efficient decontamination (with corresponding increase in temperature) of the solvent is immediate. This behavior is expected and shows the importance of strip section temperature on successful operation and implies that temperature of the strip section should be maintained >30 oC during operation, which suggest temperature control of the strip section may be desirable for pilot and process plant operation.
Figure 19. Effect of Temperature at Stage 18 on
Stripping of Solvent at Stage 32 during Tank 37H/44F Test.
6.4 Concentration Factor
To reduce the volume of liquid waste sent to the DWPF, a target concentration factor (CF) of 15 was established. When the process chemistry is properly controlled and both waste and solvent DFs are adequate, the concentration factor is controlled by the ratio of the waste feed to the strip feed.
6.4.1 Non-Radioactive Simulant Testing
The concentration factors for the non-radioactive simulant tests reflected the hydraulic behavior that was observed and demonstrated adequate cesium concentration. During the first 1.5 hours of the initial test, a flow restriction existed in solvent side of the strip section. Up until 1.5 hours, when a process disruption occurred, low concentration factors of 11.0-11.5 were observed even though flow rates measured with the balances indicated a CF
of 14.1.
After the interruption and realignment of the solvent inter-stage lines, the concentration factor for the final 4.5 hours of the test averaged 14.3. The second non-radioactive simulant test, which ran without interruptions, had an average CF of 14.1 for the entire test.
6.4.2 Radioactive Simulant Testing
Concentration factors for each of the spiked simulants were similar to those of the non-radioactive simulant tests. Using strip raffinate activity values from 1.5 to 6.0 hours, the spiked CSSX simulated waste yields an average CF of 14.8, which is the same as the average of 14.9 obtained in Proof-of-Concept tests. In comparison, the CF as measured by the feed balances was 13.1-14.1. After feeds are switched, strip raffinate activities from 7 to 12 hours for the spiked Tank 37H/44F simulant produced a six-hour average of 13.8 for the CF. In comparison, the feed balance data projected a CF of 12.1-13.1. The difference between what was measured from activity data and the balance data can be attributed to error in the analysis of the feed solutions.
Once again, while the test with Tank 37H/44F simulant produced consistent cesium values in the strip raffinate (indicative of steady state), the CF data for the CSSX simulated waste exhibited a gradual increase up to the time the CSSX simulant feed was discontinued. The CF data for the CSSX simulated waste reflects the gradual increase in activity observed in the waste raffinate data. This behavior is shown in Figure 17 using strip raffinate activity instead of the calculated CF and Figure 14. As discussed above, it is unclear whether this difference is sample variability, or if it is a trend that can be tied to either cesium stratification in the waste feed or cesium reflux in the extraction section.
6.4.3 Tank 37H/44F Waste Testing
Due to the lack of steady state operation just before, during, and immediately following the three process upsets, discussion of concentration factors will be limited to the two regions of steady state operation. Steady state operation occurred between 2 and 24 hours, and between 40 and 48 hours. The concentration factors measured using strip raffinate activity data from 2-24 hours ranged from 11.8 to 13.0 and had an average value of 12.8. The CF for the same time frame measured from the feed balances shows a CF ranging from 11.8 to 13.5 and averaged 12.6. The two data sets produce consistent results.
It is interesting to note that the CF data for the first six hours of high level waste testing shows a trend similar to the six-hour spiked simulant test using CSSX simulated waste (Figure 14). While the CF behavior for these two tests is similar, the waste DF behaviors are not similar (Figure 12). Insufficient data exists to determine the cause of this behavior, but the potential effect of organics should not be ruled out.
Efforts to increase the concentration factor up to the target of 15 produced a period of non-steady state operation. Steady state operation was achieved at approximately 40 hours. Between 40 and 48 hours, the concentration factor as measured using strip raffinate activity data varied between 14.2 and 14.8 with an average value of 14.4. The CF for the same time period as measured from the feed balances shows a CF between 14.3 and 15.8 with an average value of 15.2. Considering the potential for a 10% error in the cesium activity in the feed, the two values are within 10% of each other and within 5% of the target value of 15.
6.5 Stage Samples
Stage samples can be used to measure distribution coefficients in each of the contactor stages. The distribution coefficients are a measure of the chemistry occurring within the contactors and can be an indicator of processing problems. Typical DCs values measured at ORNL using the CSSX simulated waste at 25 oC are: extraction = 16.9; scrub = 1.59; Stage 18 = 0.148; Stage 19 = 0.089; Stage 20 = 0.067; Stages 21-32 < 0.06.10 Similarly, temperature-corrected batch equilibrium data using Tank 37H/44F waste showed the following DCs values at 25 oC (see Table 7): extraction = 19.0, scrub = 1.76, first strip = 0.20, second strip = 0.10; third strip = 0.07. While the distribution coefficients for extraction will vary between waste streams, the values for the strip section should be relatively independent of the waste composition. The assumption for the strip section is not valid if an ionic organic species, such as dibutylphosphate, is extracted into the solvent.
In general, if temperature-corrected distribution coefficients in the extraction section are less than 8, then 15 extraction stages will not be sufficient for achieving the required decontamination factors. Similarly, if the temperature-corrected distribution coefficients in the strip section are consistently greater than 0.2, then 15 strip stages will not be sufficient to adequately decontaminate the solvent. The batch equilibrium data indicates that the test with Tank 37H/44F waste should meet the required DFs, provided the hydraulic performance is satisfactory.
Once measured, the distribution coefficients help determine the operating efficiency of the contactor stages. Poor stage efficiency can usually be attributed to poor hydraulic performance. Testing at ANL has shown that stage efficiencies of 80% or greater (assuming proper distribution coefficients) will provide sufficient extraction and stripping capacity to produce the necessary decontamination within 15 contactor stages. For this reason, 80% was established as a requirement for all tests.
6.5.1 Non-Radioactive Simulant Testing
The distribution coefficients for both the strip and extraction sections were comparable to those measured at ANL and ORNL, and within ranges necessary for successful operation of the process. An analysis of the distribution coefficients (Table 12) and stage data was performed using the SASSE computer model developed at ANL. The model showed that the extraction section operated at 86+6% efficiency and the strip section operated at 96+6% efficiency. As a result, the stage data from the non-radioactive simulant test show the contactors will attain the required efficiency.
6.5.2 Radioactive Simulant Testing
The radioactive simulant testing allowed for adequate measurement of decontamination factors to determine whether or not the test succeeded. However, the measurement of distribution coefficients and the calculation of stage efficiencies still provide valuable insight into the chemistry and hydraulic behavior of the system. It should be noted that stage data were collected only at the end of the Tank 37H/44F simulant portion of the test. Therefore, stage data do not exist for the CSSX simulated waste portion of the experiment.
The stage data calculations yield temperature-corrected distribution coefficients for extraction Stages 4-14 ranging between 15.2 and 16.9 and a value of 10.7 for Stage 15. The value for Stage 8 is low and the value for Stage 10 is high with an average value (13.0) in the proper range. This could be attributed to sampling error or to the inability to shut down all pumps and contactor motors simultaneously – the capability was available for the Tank 37H/44F waste test. The DCs values for Stage 1 and 2 are disregarded because the cesium activities in those two samples are being affected by cesium in the recycle solvent and the analytical detection limits for cesium activity. The distribution coefficients in the scrub section (Stages 16 and 17) are in the expected range.
In the strip section, the stage DCs values also look acceptable. A high value in Stage 18 followed by a gradual decline in DCs values to below 0.10 is expected. A review of stage data at the end of the test shows strip distribution coefficients (DCs) starting at 0.21 in Stage 18 and slowly declining to 0.05 by Stage 28. The Stage 26 and 32 samples were compromised during sampling. These values are consistent with expected results.
Analysis of the data was once again conducted using the SASSE computer model. A plot of the actual data against the model prediction is shown in Figure 20. The stage efficiency for the extraction section was 94% ± 6%. For the strip section, it was 82% ± 6%. The model gives a reasonable fit of the data considering that it was difficult to measure Cs at the lower concentrations. The DCs, stage efficiency, and decontamination factor data all predicted a successful performance of the Tank 37H/44F waste test.
6.5.3 Tank 37H/44F Waste Testing
Testing with Tank 37H/44F waste made it possible to measure the distribution coefficients for all process stages. The Tank 37H/44F waste stage data provided a valuable comparison with the data from the radioactive simulant test. The data clearly show that the extraction and strip section distribution coefficients are closer to the acceptable limits than those measured using simulant. The distribution coefficients for extraction Stage 1-15 were all between 10.2 and 12.6. The DCs values for the Tank 37H/44F waste test were greater than the required value of 8, but were considerably lower than those measured using Tank 37H/44F Simulant (15.2–16.9). This is likely a function of the differences between the actual waste and the simulant. It is also substantially lower than those measured during the batch equilibrium tests (19.0). The reason for this is unknown at this time.
Figure 20. Comparison of Data from the Stage and Effluent Samples at the
End
of the Radioactive Simulant Test with Values Calculated using the SASSE Worksheet.
The strip section DCs data from the Tank 37H/44F waste were also clearly different from the data measured from the Tank 37H/44F simulant and batch equilibrium tests. First, the Stage 18 distribution coefficient is much higher for the Tank 37H/44F waste (0.46) than the simulant (0.21) or the batch equilibrium data (0.20). The DCs becomes so high relative to the O/A ratio that ineffective stripping of cesium occurs where cesium levels are highest in the strip section. As a result, cesium moves through the strip section and exits in the solvent recycle stream, thereby leading to decreased waste DFs. This validated the decision to use a lower solvent flow rate for the Tank 37H/44F waste test (12.8 mL/min vs. 14.1 mL/min) and a heat lamp on Stages 18 and 19. If these changes had not been made, it is possible that the Tank 37H/44F waste test would have failed to meet the waste decontamination requirements due to inadequate solvent decontamination.
In addition to the high value in Stage 18, the Tank 37H/44F waste DCs values are much higher in Stages 19-28 than those for the simulant or the batch equilibrium tests. Last, the DCs values for the Tank 37H/44F waste test do not fall below 0.13 until Stages 29-30 compared to Stages 21-22 for the Tank 37H/44F simulant. Analysis of the strip section pH shows that Stage 18 was within the proper range of 3-4 throughout the test. Also, the difference in the known components of the simulant compared to the Tank 37H/44F waste indicates nothing that should cause the high DCs values in the strip section. The most likely explanation is that an unknown ion, such as DBP or a similar lipophilic organic anion, is present in the Tank 37H/44F waste and not the simulant. The presence of such an ion can increase the overall ionic strength in the stripping section enough to cause the observed behavior. Nonetheless, in spite of the unexpected high DCs values in the strip section, the solvent DF value at the end of the experiment was at the average value of 1.2 million, which is 30 times greater than the target value of 40,000.
The DCs for Stage 16 of the scrub section is also higher than expected. However, because the Stage 17 sample was compromised, it is difficult to develop conclusions about whether the Stage 16 distribution coefficient is a trend or simply an anomaly. The DCs for the solvent wash stage (Stage W) was also higher than expected (9.4 measured vs. 0.3-0.4 expected). However, using the solvent reservoir activity of 25,800 at the end of the test (the activity level fed to Stage W) and the expected extraction factor (DCs x O/A ratio) yields an expected Stage W aqueous activity of 8600-10300 dpm/mL. The actual aqueous activity value in Stage W was measured at 8870 dpm/mL. Since the Stage W organic was measured at 83,100 dpm/mL, which is well above the actual incoming solvent stream, it is reasonable to assume the high DCs value for Stage W can be attributed to contamination of the solvent sample.
Analysis of the data was again conducted using the SASSE computer model.15 A plot of the actual data against the model prediction is shown in Figure 21. The stage efficiency for extraction section was 84% ± 4%. For the strip section, it was 82% ± 4%. The model gives a reasonable fit of the data considering that the process was still recovering from cesium contamination in the strip section following the last process interruption. This contamination was caused by the inadvertent introduction of alkalinity in the strip section during recovery operations.
Figure 21. Comparison of Data from the Stage and Effluent
Samples at the End
of the Tank 37H/44F Waste Test with Values Calculated using the SASSE Worksheet.
It is interesting to note that the model curves show lower concentrations in the aqueous waste raffinate, giving values close to what was observed during the first 24 hours of the Tank 37H/44F waste test. As is typical, the process was controlled and limited by cesium removal from the strip section. The model also shows that if the solvent flow rate was lower, the strip section would work even better, that is, until the flow rate got so low that the operation of extraction section starts to limit process performance.
It should be noted that the stage efficiencies for the strip section dropped a statistically-significant amount once the contactors were placed in the cell, while no statistically-significant difference was observed for the extraction stages (See Table 20.). This may be attributed to the fact that visual inspection of the strip section organic inter-stage lines detected that some of the lines had been bent during the transfer. This would change the overall hydraulic performance of the strip section. As a result, some of the lines had to be realigned. However, because the ability to inspect and adjust the organic inter-stage lines was greatly limited n the Shielded Cells, there was no way to ensure that the condition of the inter-stage lines in the cells matched those prior to the transfer.
Table 20. Stage Efficiencies
|
Test |
Extraction Stage Efficiencies |
Strip Stage Efficiencies |
|
Mockup |
86+/-6% |
96+/-6% |
|
Spiked Simulant |
94+/-6% |
82+/-6% |
|
Tank 37H/44F Waste |
84+/-4% |
82+/-4% |
6.6 Solvent Turnover
A review of the stage data from the radioactive simulant tests showed distribution coefficients in the strip section that raised concerns that the strip section might not perform adequately in the Tank 37H/44F waste test under the same conditions. High DCs values lead to ineffective removal of cesium in the first few strip stages (i.e., Stages 18 to 20). This causes high cesium concentrations in the first several strip stages and can lead to high cesium levels in the solvent recycle, thereby leading to low waste decontamination. Because of this, the total solvent flow was reduced within the allowed limits from 14.1 mL/min to
12.8 mL/min. Also, because of the series of process upsets, the test was run only 48 hours instead of an initial target of 50 hours. Consequently, over the duration of the Tank 37H/44F waste test, an estimated 25 solvent turnovers were performed.
A total solvent turnover requirement of 28 was established for the Tank 37H/44F waste test. The intent of this requirement is to subject the solvent to sufficient contact with Tank 37H/44F waste to determine what negative effects, if any, would result from the high radiation field in a processing environment. Experiments at ORNL and SRTC have shown that the solvent has excellent radiation and chemical stability such that there should be no long-term effects associated with exposing the solvent to the Tank 37H/44F waste. As a result, the likely difference in the data associated with performing 25 solvent turnovers instead of 28 should be minimal, and should have little or no impact on the solvent quality data produced from the Tank 37H/44F waste test.
7.0 Conclusions
The CSSX process flowsheet for the decontamination of high level waste was demonstrated in a 33-stage, 2-cm contactor apparatus at the Savannah River Technology Center. Simulated average SRS waste, simulated Tank 37H/44F composite waste, and actual Tank 37H/44F high level waste were processed in three tests lasting 6, 12, and 48 hours, respectively. Results of the three tests support the following conclusions.
Waste Decontamination: The CSSX process is capable of reducing 137Cs in high level radioactive waste to concentrations below the Saltstone process requirement of 45 nCi/g. The Tank 37H/44F composite sample required a decontamination factor of 13,000 to meet the Saltstone process requirement. During the test, 106 liters of Tank 37H/44F high level waste were processed and the composite met the Saltstone requirement. DFs as high as
2 million resulted during stable hydraulic conditions in the 2-cm contactor apparatus. The composite waste DF averaged 804,000 for the first 26 hours (prior to the first process upset), 511,000 for the first 34 hours (prior to the second upset) and 40,000 for the entire 48-hour test. ANL researchers previously demonstrated the process meets this requirement with simulated wastes. The Tank 37H/44F test also confirms that minor components in the Tank 37H/44F waste do not impact the process DFs compared to simulated wastes.
Hydraulic Performance: Hydraulic capacity of the 2-cm contactor apparatus differs between simulated CSSX simulated waste and either the Tank 37H/44F simulant or high level waste. Under stable hydraulic conditions, the maximum flow achievable with the Tank 37H/44F high level waste was 10% lower than with CSSX simulated waste. This is likely due to differences in viscosity and density between the two waste compositions. Disruptions of the Tank 37H/44F waste test are attributed to attempts to unknowingly operate beyond the maximum flow limit for the small-scale equipment. The process readily recovered from the disruptions and achieved the required decontamination levels. This issue is not expected to be significant in larger scale equipment. Hydraulic stage efficiencies in the extraction and strip sections were greater than the 80% design requirement for all tests.
Solvent Recycle: The test showed that the solvent could be stripped of cesium and recycled with an average solvent DF of 182,000 for the first 34 hours and 154,000 for the entire test with a minimum of 45,000. Heating the strip section above 30 ° C increases stripping efficiency. This effect was predicted from batch test results and was demonstrated during the high level waste test. Design of the facility should consider adding temperature control to the strip section as a process improvement.
Solvent Retention: Carryover of organic solvent in aqueous streams (and aqueous in organic streams) is much less than 1% when processing Tank 37H/44F high level waste. Minor components in the high level radioactive waste did not affect the ability of the contactors to efficiently separate the solvent and aqueous phases. Low carryover was previously demonstrated with simulated wastes.
Cesium Concentration: A steady-state concentration factor (CF) of 14.4 was achieved with Tank 37H/44F high level waste. Uncertainties in process flow rate measurements prevented the test from achieving the target CF of 15. Adjustments to flow rates during the final hours of the high-level waste test approached the target CF without exceeding the maximum flow capacity of the apparatus. Knowledge of actual process flow rates will allow future tests to achieve a CF of 15.
8. Future WorkIt is recommended that future work for the Caustic-Side Solvent Extraction high level waste demonstration follow several parallel paths. A demonstration with Tank 37H/44F composite waste should be performed to demonstrate that the desired concentration factor (CF) of 15 can be achieved and maintained. The CF will be achieved by reducing the strip feed flow rate to correspond with the reduced waste feed flow rates observed in the present study. A test duration of 8 to 12 hours will demonstrate the desired CF can be operationally maintained once achieved. If a CF of 15 cannot be achieved, then additional work to determine the cause of the hydraulic limit is recommended. This work should attempt to link hydraulic performance with the fluid properties of the Tank 37H/44F waste.
A second high level waste demonstration should be performed employing waste supernatant solutions of relatively low hydroxide concentrations to verify that system performance is comparable to that using the waste solutions of higher hydroxide concentrations employed in this study. Further demonstrations should also be performed using waste solutions containing dissolved salt cake in addition to tank supernatant solutions.
Since some inconsistency was observed in decontamination and stripping behavior in the spiked simulant tests of the present study, it is recommended that this issue be studied in more detail. The most notable difference between the CSSX simulated waste and the Tank 37H/44F simulant was the presence of organic compounds in the former. A series of tests should be performed where several spiked simulant feeds containing controlled amounts of organics are fed to the test apparatus. All feeds should be based on a single batch of the same stock salt solution and have varying amounts (within the concentration range expected in high level waste solutions) of organics systematically added to them before being fed to the system. Hydraulic and decontamination behavior can then be evaluated as a function of the organic content of the feed solution.
9.0 Appendix A
Analytical Plan for the CSSX Contactor Tests
|
This Appendix documents SRT-LWP-2001-0009, Rev.1, publication date: March 17, 2001 |
9.1 Summary
This memorandum describes the analytical plan for the Caustic Side Solvent Extraction (CSSX) contactor tests.
9.2 Test Objectives and Methods
Three contactor test runs are planned. These are described below, highlighting the major objective of each test and the analytical sampling and analyses required to meet the objectives. A summary is given in Table 1.
9.2.1 Test #1 Simulant Test in Mockup
Objective: Demonstrate stage efficiency is >80%.
Method: At the end of the test, all 33 stages will be drained and saved. The first 5 extraction stages (11-15) and strip stages (17-21) will be removed to a lab and the phases separated. Samples of both phases will be sent for analysis of Cs using atomic absorption spectroscopy (AA). The other stage samples will be saved pending the results of the first 10 samples. Ralph Leonard will use the cesium concentration data and a computer model to determine the stage efficiency. The pH will be measured on all strip effluent samples.
Objective: Demonstrate a decontamination factor >1000.
Method: Three process streams (waste raffinate, strip effluent, and stripped solvent) will be analyzed for cesium content throughout the test. Samples will be taken after 0, ½, 1, 1 ½, 2, 3, 4, 5, and 6 hours (9 samples for each stream, total 27 samples). These samples will be sent for Cs by AA.
Objective: Determine minor components in product streams.
Methods:
9.2.2 Tracer simulant test in Shielded Cells
Objective: Demonstrate low-activity samples are not contaminated during cell manipulations, provide baseline data to compare to previous tests by Ralph Leonard (SRS simulant) and the Tk 37H/44F rad waste test, and demonstrate the apparatus achieves DF > 40,000.
Method: The process streams (waste raffinate, strip effluent, and stripped solvent) will be sampled throughout the test (after 0, ½, 1, 1 ½, 2, 3, 4, 5, 6, 7, 8, 9, 10, 11, and 12 hours, or 15 samples per stream). The solvent hold tank will be sampled after 0 and 12 hours (2 times). All samples will be analyzed for 137Cs by gamma scan. The 0.01 M NaOH wash solution will be sampled at 0 and 12 hours and analyzed for 137Cs by gamma scan. At the end of the test, all 33 stages will be drained. Half of these samples will be separated in the Shielded Cells and portions of each phase removed for 137Cs analysis. The other half will be removed from the cell and taken to a radiohood for separation under less contaminated conditions.
9.2.3 Tank 37H/44F Rad Waste Test (Cells 3 & 4)
Objective: Demonstrate waste raffinate meets Saltstone specification
(<45 nCi/g) and strip effluent achieves 15X concentration factor.
Method: The two aqueous process streams (waste raffinate and strip effluent) will be sampled initially and every ½ hour for 2 hours (5 samples). These samples will be removed from the cell promptly and analyzed for 137Cs to verify the process is operating correctly. After the first two hours, samples will be taken each hour. Every second sample will be analyzed for 137Cs. The organic solvent stream will be analyzed after 0, ½, 1, 1½, and 2 hours, removed promptly and analyzed for 137Cs. After the first two hours, this stream will be sampled at 3, 4, 5, and 6 hours, then every 3 hours for the duration of the test (total 20 samples). These will all be analyzed for 137Cs by gamma scan. The pH of the strip raffinate samples will be analyzed in the cell prior to dilution.
Objective: Demonstrate entrainment of organic solvent is <1%.
Method: This will be achieved by measurements of separated solvent in the decanter in the waste raffinate and strip effluent streams. In addition, these two streams and the 0.01 M NaOH wash solution will be analyzed for entrained solvent. Samples taken at the start and every 12 hours (5 samples for each stream) will be analyzed for modifier and BOBCalixC6 by HPLC. Because of the high activity of the strip raffinate, it will be extracted with dodecane in the Shielded Cells and the extract removed for analysis.
Objective: Measure degradation of solvent system and minor components.
Method: The solvent tank will be sampled initially and every twelve hours during the test (5 samples). All five samples will be analyzed for 137Cs by gamma scan. The initial and final samples will be analyzed for the solvent components and impurities. The organic components of interest are: modifier and BOBCalixC6 (by HPLC), TBP/trimethylamine/n-butanol (GC-MS), and DBP (IC). The following inorganic components will be measured in digested portions of the samples: metals (ICP-ES and ICP-MS) and K(AA). The 137Cs will be measured on undigested portions.
Objective: Measure solvent degradation and minor components in aqueous streams.
Method:
Objective: Measure stage efficiencies.
Method: At the end of the test, all 33 stages will be drained and saved. The hottest phases will be separated in the Shielded Cells and the others may be removed and separated in a radiohood. Both phases will be sent for analysis of Cs by gamma scan.
9.2.4 Miscellaneous
Objective: Determine background cesium contamination in the apparatus after the simulant test in mockup (Test #1) and after the simulant tests in the Shielded Cells (Test #2).
Method: Obtain a sample of the water flush solutions from Stages 1, 8, 15, 18, 25, and 32. Analyze by AA after the test in mockup; analyze by gamma scan after tracer test in cell.
Objective: Determine whether amines accumulate in Stage 15
Method: At the end of Tests 1 and 3, analyze the solvent phase from Stage 15 for organic compounds: HPLC (modifier, BOBCalixC6), GC-MS (trimethylamine, trioctylamine, dioctylamine, 4-sec-butylphenol), and IC (DBP).
Objective: Determine if Scrub Stages are adequately adjusting pH prior to stripping.
Method: Measure pH of Scrub Stages (16 and 17) and first strip stages (18 and 19) using pH paper.
9.3 Stage Sample Handling
Stage samples will be obtained from all stages at the end of each test. However, not all of the samples will be analyzed. Samples that are not analyzed initially will be saved as backups in case the initial samples are compromised. All stage samples will be taken in polypropylene bottles.
Stage samples will be shaken in the polypropylene bottles for approximately one minute and then transferred to separatory funnels. The solutions will be allowed to separate for a minimum of 24 hours, whereupon the two phases will be separated. The intermediate portions containing aqueous and solvent will be discarded.
9.4 Highly Radioactive Samples
During the radioactive waste test (Test #3), some samples will be too radioactive to remove from the Shielded Cells. Results from the tracer simulant test (Test #2) will provide guidance on which samples require special handling. The aqueous concentrate and some of the stage samples will contain 137Cs in excess of 5x10⁷ d/m/mL which prior experience has shown to be a practical limit for removal of a few milliliters of sample. For aqueous samples requiring gamma scans, dilution in nitric acid in the cell will be used to reduce dose rates to safe levels. For aqueous samples requiring organic analyses for carryover of solvent, the samples will be extracted with 1-dodecane in the cell and the extract removed for analysis. For aqueous samples requiring inorganic analyses, the 137Cs will be removed by treating the solution with AMP-PAN resin (1 g resin/15 mL sample). For solvent samples requiring gamma scan, the sample will diluted in an appropriate solvent (Isopar L, Isopar L with modifier, or 1-octanol) prior to removal from the cells.
Table 21. Summary of Sampling and Analytical Plan
References