
WSRC-TR-2000-00459
Batch Studies of Sodium Tetraphenylborate Decomposition
on Reduced Palladium Catalyst
L. N. Oji and M. J. Barnes
Westinghouse Savannah River Company
Aiken, SC 29808
This report was prepared as an account of work sponsored by an agency of the United States Government. Neither the United States Government nor any agency thereof, nor any of their employees, makes any warranty, express or implied, or assumes any legal liability or responsibility for the accuracy, completeness, or usefulness of any information, apparatus, product or process disclosed, or represents that its use would not infringe privately owned rights. Reference herein to any specific commercial product, process or service by trade name, trademark, manufacturer, or otherwise does not necessarily constitute or imply its endorsement, recommendation, or favoring by the United States Government or any agency thereof. The views and opinions of authors expressed herein do not necessarily state or reflect those of the United States Government or any agency thereof.
This report has been reproduced directly from the best available copy.
Available for sale to the public, in paper, from: U.S. Department of Commerce, National Technical Information Service, 5285 Port Royal Road, Springfield, VA 22161, phone: (800) 553-6847, fax: (703) 605-6900, email: orders@ntis.fedworld.gov online ordering: http://www.ntis.gov/support/ordering.htm
Available electronically at http://www.osti.gov/bridge/
Available for a processing fee to U.S. Department of Energy and its contractors, in paper, from: U.S. Department of Energy, Office of Scientific and Technical Information, P.O. Box 62, Oak Ridge, TN 37831-0062, phone: (865 ) 576-8401, fax: (865) 576-5728, email: reports@adonis.osti.gov
Summary
In these batch experiments we obtained preliminary information on palladium based catalytic decomposition of sodium tetraphenylborate (NaTPB). These preliminary data provide necessary data to design subsequent catalytic decomposition experiments for NaTPB using a continuous stirred tank reactor (CSTR). Conclusions from these batch tests include the following.
Recommended conditions and reagents for the CSTR system include the following.
Keywords: Sodium tetraphenylborate, Palladium catalyst,Salt processing facility
Introduction
One process option under consideration for the Salt Waste Processing Facility uses a continuous stirred tank reactor with added sodium tetraphenylborate precipitation to replace the In-Tank Precipitation facility at the Savannah River Site (SRS). Researchers in previous studies,2 used laboratory-scale stirred tank reactors to acquire cesium precipitation data and other information needed for a full-scale continuous stirred tank reactor operation. Those studies, however, did not include reactive slurry of tetraphenylborate.
This study uses batch tests as summarized in Tables 1 and 2 to evaluate relative reactions for sodium tetraphenylborate decomposition under varying experimental and reagent conditions. The test variables include temperature, palladium catalyst concentrations, antifoam agents, monosodium titanate (MST), sludge, and mercury concentration and form. These batch experiments seek to identify a reactive system capable of generating the most NaTPB decomposition products within the first eight hours of reaction time3. We need such a reactive system in the next phase of this work, which examines operation of a laboratory-scale CSTR at different temperatures. In these batch tests, we intend to use the amount of NaTPB decomposition products, triphenylborane (3PB) and diphenylborinic acid (2PB), produced within the first eight hours of reaction as a measure of extent of reaction.
Experimental
Tables 1 and 2 show a series of 21 batch test designed to evaluate the influence of the following reagents and conditions on sodium tetraphenylborate decomposition rates:
Solutions used reagent grade chemicals, and the SRTC Standards Laboratory calibrated the balances, and monitoring equipment used in this study. The sodium tetraphenylborate (Na[B(C6H5)4]; 99.5% purity; lot # 05711AU) came from Aldrich Chemical. The 5 wt. % reduced palladium on alumina powder (lot # C23D08) came from from Alpha Aesar. The monosodium titanate (lot # 33407) came from Optima chemical. The sludge used is high iron metal oxide sludge without noble metals or known catalyst. We prepared this sludge by acid dissolution of metal nitrates followed by caustic adjustment to a pH of 10.5 and washing of the resulting metal sludge. Table 4 shows the sludge composition.
In these batch tests, we used 250-mL Teflonâ reaction vessels equipped with Teflonâ lined rubber septa for sampling and for nitrogen purging of the vessel before and after sampling. We charged each of the reaction vessels with 100-mL portions of NaTPB slurry(4 mL of 0.54 Molar stock solution of NaTPB per 100-mL portion). With this level of NaTPB, we maintained NaTPB concentration at 60% in excess of the potassium concentration. Table 3 shows the SRS average waste simulant composition (target sodium concentration of 4.85 M). We then added the required amount of each catalyst or reagents to the vessels to meet the prescribed amounts of each reagent as summarized in Tables 1 and 2 for each individual test design. We added proprietary antifoaming agents, designated as PM, B-52 and DF-110p, at concentrations of 1000 mg/L to some of the batch tests as summarized in Tables 1 and 2. After adding all the reagents, we sealed each reaction vessel and purged the headspace with nitrogen (approximate purge rate of 0.2 liters per minute) for five minutes before sampling for initial concentrations.
We also wrapped high temperature tape around the cap of each reaction vessel to further reduce the chances for air leaks. We maintained the reaction vessels at selected temperatures as specified in Tables 1 and 2 by putting them into equilibrated water baths at the required temperatures. We provided stirring of the reaction vessel contents during reaction by shaking the entire water bath continuously for the duration of the tests.
Note that we added 1PB into each reaction vessel at the beginning of the tests. Hence, the 1PB measured during reactions did not all come from the decomposition of NaTPB.
We observed the batch test, respectively, for approximately 73, 32, 74 and 66 hours for test designs BS-1 to BS-9, BS-10 to B-S11, BS-12 to BS-17 and BS-19 to BS-21. Once every 2 to 4 hours, within the first twenty hours of starting the batch experiments, technicians retrieved samples from the sealed reaction vessels for analysis. We carried out subsequent sampling every 8 to 10 hours. We chose these sampling time intervals because our primary interest in the system involved ascertaining which system reacts fastest within the first 8 hours. The eight hours represents the residence time for the next phase of the work involving CSTRs.
We based the method of quantifying the rate for NaTPB decomposition, within the first 8 hours, on a linear interpolation of the comparative amounts of 3PB and 2PB generated in each of the batch experiments.
Table 1. Test conditions and reagents for batch test BS-1
through BS-11.
|
Condition |
BS-1 |
BS-2 |
BS-3 |
BS-4 |
BS-5 |
BS-6 |
BS-7 |
BS-8 |
BS-9 |
BS-10 |
BS-11 |
|
Pd conc. |
X |
3X |
10X |
10X |
10X |
10X |
10X |
10X |
10X |
10X |
10X |
|
Temp. ° C |
45 |
45 |
45 |
25 |
45 |
45 |
45 |
45 |
45 |
45 |
45 |
|
Hg (11) |
-- |
-- |
-- |
-- |
Hg(11) |
-- |
-- |
-- |
-- |
-- |
-- |
|
j Hg |
j Hg |
j Hg |
j Hg |
j Hg |
- |
j Hg |
j Hg |
j Hg |
j Hg |
Hg(11) |
Hg(11) |
|
Hg conc. |
85 |
85 |
85 |
85 |
85 |
85 |
85 |
85 |
85 |
8.5 |
8.5 |
|
MST, g/L |
0 |
0 |
0 |
0 |
0 |
0 |
0 |
0 |
0 |
0 |
0 |
|
Sludge, g |
0 |
0 |
0 |
0 |
0 |
0 |
0 |
0 |
0 |
0 |
1.58 |
|
Benzene, mg/L |
720 |
720 |
720 |
720 |
720 |
720 |
720 |
720 |
720 |
720 |
720 |
|
IPB, mg/L |
500 |
500 |
500 |
500 |
500 |
500 |
500 |
500 |
500 |
500 |
500 |
|
Atmosphere |
N2 |
N2 |
N2 |
N2 |
N2 |
air |
N2 |
N2 |
N2 |
N2 |
N2 |
|
Antifoam |
-- |
-- |
-- |
-- |
-- |
-- |
PM |
B-52 |
DF-110p |
B-52 |
B-52 |
j Hg = diphenylmercury
Table 2 Test conditions and reagents for batch test design
sets BS-12 through BS-21.
|
Condition |
BS-12 |
BS-13 |
BS-14 |
BS-15 |
BS-16 |
BS-17 |
BS-18 |
BS-19 |
BS-20 |
BS-21 |
|
Pd conc. |
3X |
3X |
3X |
10X |
10X |
10X |
1X |
3X |
3X |
10X |
|
Temp. ° C |
35 |
35 |
35 |
35 |
35 |
35 |
25 |
25 |
25 |
25 |
|
Hg (11) |
Hg(11) |
Hg(11) |
Hg(11) |
Hg(11) |
Hg(11) |
Hg(11) |
Hg(11) |
Hg(11) |
Hg(11) |
Hg(11) |
|
Hg conc., |
8.5 |
0.17 |
85 |
8.5 |
0.17 |
85 |
85 |
85 |
85 |
85 |
|
MST, g/L |
0 |
0 |
0 |
0 |
0 |
0 |
0.4 |
0 |
0.4 |
0.4 |
|
Sludge, g/L |
0 |
0 |
0 |
0 |
0 |
0 |
0 |
0 |
0 |
0 |
|
Benzene, mg/L |
720 |
720 |
720 |
720 |
720 |
720 |
720 |
720 |
720 |
720 |
|
IPB, mg/L |
500 |
500 |
500 |
500 |
500 |
500 |
500 |
500 |
500 |
500 |
|
Atmosphere |
N2 |
N2 |
N2 |
N2 |
N2 |
N2 |
N2 |
N2 |
N2 |
N2 |
|
Antifoam |
B-52 |
B-52 |
B-52 |
B-52 |
B-52 |
B-52 |
B-52 |
B-52 |
B-52 |
B-52 |
Result and Discussions
Analysis
In all tests, personnel collected initial liquid samples and analyzed by High Performance Liquid Chromatography (HPLC) to establish initial concentrations of tetrapehylborate, tripenylborane (3PB), diphenylborinic acid (2PB), phenylboronic acid (1PB) and phenol. The Analytical Development Section digested and analyzed soluble boron by ICPES methods. Periodic sampling of the reaction mixtures occurred during the remainder of the testing period. This syringe-based sampling involved periodic withdrawing of 6 to 8 mL sample portions followed by filtering. Prior to analysis, we refrigerated the collected filtrate samples. The analytical development section analyzed the filtrate for 3PB, 2PB and other products of interest. After sampling from each vessel, technicians purged headspace with nitrogen for five minutes before placing the vessel back into the oven. Technicians also logged the reaction time in the oven for all the samples.
Table 3. SRS average waste simulant composition.

Table 4. Sludge composition.
|
Component |
Mass (g) |
|
Mn(NO3)2 (50% in water) |
16.78 |
|
NaOH |
52.50 |
|
KMnO4 |
4.34 |
|
Fe(NO3)2.9H2O |
127.60 |
|
Ni(NO3)2.6H2O |
8.38 |
|
CaCO3 |
3.01 |
|
Al(OH)3 |
13.32 |
|
Ba(NO3)2 |
0.365 |
|
Ca(PO4)2 |
0.158 |
|
CaSO4 |
0.234 |
|
Cr2O3 |
0.28 |
|
CsNO3 |
0.01 |
|
KOH |
0.36 |
|
MgO |
0.26 |
|
Na2CO3 |
0.11 |
|
Na2SO4 |
0.58 |
|
Na3PO4.12H2O |
0.02 |
|
NaCl |
0.92 |
|
NaF |
0.22 |
|
NaNO2 |
2.39 |
|
NaNO3 |
0.44 |
|
NaOH |
1.02 |
|
Nd2O3 |
0.87 |
|
PbNO3 |
0.35 |
|
SiO2 |
3.66 |
|
SrCO3 |
0.15 |
|
Zeolite |
3.74 |
|
ZnO |
0.18 |
|
ZrO2 |
2.50 |
Sodium tetraphenylborate product concentration profiles
We tabulated the analytical data for the species in Appendix A for test designs BS-1 through BS-21. See experimental conditions as summarized in Tables 1 and 2. Figures 1 and 2 show, respectively, the variation of 3PB and 2PB product concentrations with time for test design BS-1 through BS-9. Figures 3 and 4 plots the variation of 3PB and 2PB products with time for set designs BS-10 and BS-11, respectively. Similarly, Figures 5 and 6 plots the variation of 3PB and 2PB products with time for test designs BS-12 through BS-17, respectively. Figures 7 and 8 displays the variation of 3PB and 2PB product concentrations with time for design test sets BS-18 through BS-21, respectively.
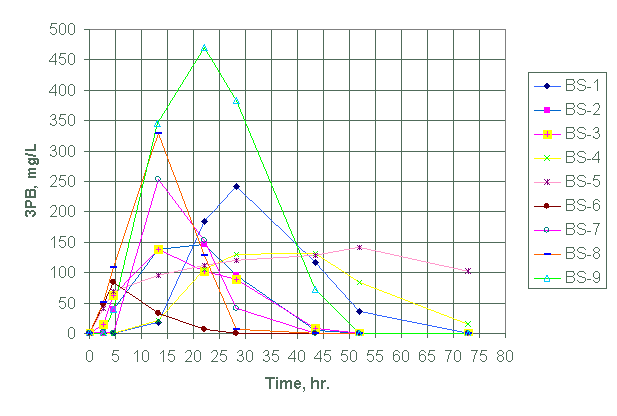
Figure 1. Generation of triphenylborane (3PB) for test
BS-1 through BS-9 at 45°C (except with
BS-4 at 25°C).
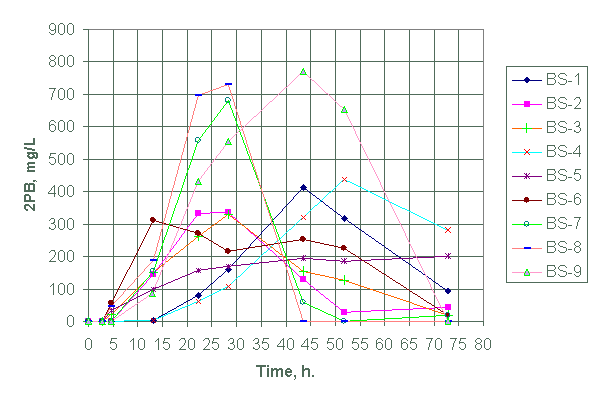
Figure 2. Generation of diphenylborinic acid (2PB) for test
BS-1 through BS-9 at 45°C (except with BS-4
at 25°C).
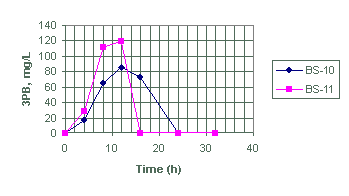
Figure 3. Generation of triphenylborane (3PB) for test BS-10 and BS-11 at
45°C.
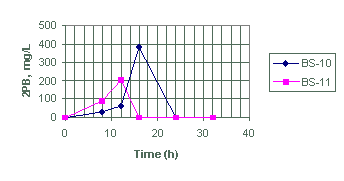
Figure 4. Generation of diphenylborinic acid (2PB) for test BS-10 and BS-11
at 45°C.
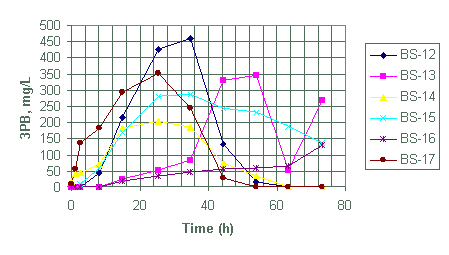
Figure 5. Generation of triphenylborane (3PB) for test BS-12 through BS-17
at 35°C.
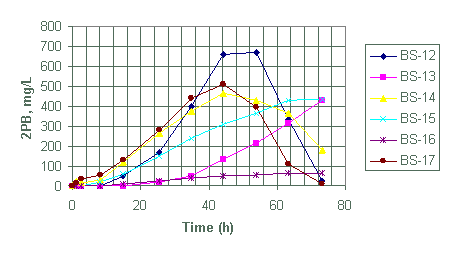
Figure 6. Generation of diphenylborinic acid for test BS-12 through BS-17
at 35°C.
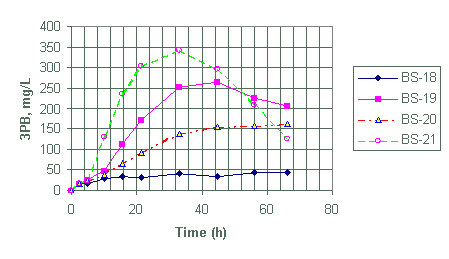
Figure 7. Generation of triphenylborane (3PB) for test BS-18 through BS-21
at 25°C.
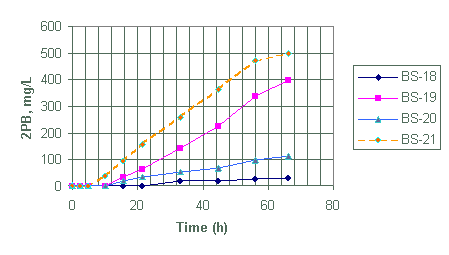
Figure 8. Generation of diphenylborinic acid for test BS-18 through BS-21
at 25°C.
Test design BS-1 to BS-9
We could not obtain any measurable amount of tripenylborane (3PB) in BS-1, BS-4 and BS-7 within the first 8 hours of running the experiment. Tests BS-1, BS-2, and BS-4 did not also generate any measurable amounts of 2PB within the first eight hours of reaction.
Judging from 3PB and 2PB concentrations (Figures 1, 2, and Appendix A), we conclude that test BS-8 showed the highest yield in both 3PB and 2PB within the first eight hours. Although test BS-6 shows a significant yield of 2PB in comparison to BS-8, we did not select test BS-6 as the most reactive because the reaction occurred in a non-inert atmosphere. The subsequent testing will use a nitrogen environment.
Except for the presence of antifoam agent in test BS-8, it resembles test BS-3 in catalyst concentration, reaction environment, mercury form and reaction temperature. Test BS-8 also resembles test BS-5 except for the presence of antifoam and use of a different form of mercury (diphenyl mercury in BS-8 versus mercuric nitrate (Hg (II)) in BS-5). Yet, within the first eight hours of reaction test BS-3 reacts faster than BS-5 (Appendix A). The difference in reactivity (BS-8>BS-3>BS-5) apparently reflects the influence of the mercury form used and the presence of IIT B-52 antifoam agent. Tests BS-1 and BS-2 with the lowest palladium concentration showed a slower rate for NaTPB decomposition at 45°C. Test BS-4 had the slowest NaTPB decomposition rate due to the reaction temperature of 25°C. The tests containing antifoam agents, PM, B-52 and DF-110P (i.e., tests BS-7, BS-8 and BS-9, respectively) did show significant initial high decomposition rates for NaTPB when compared with tests without these antifoam agents. Of this set, the test (BS-8) containing B-52 antifoam agent showed the higher decomposition rate for NaTPB within the first eight hours of reaction.
Tests BS-10 and BS-11
We designed tests BS-10 and BS-11 to evaluate the effects of sludge on the decomposition rate of NaTPB. Based on the amount of 2PB produced (Appendix A and Figures 3 and 4), test BS-11 shows only a slight improvement over BS-10 in the generation of 2PB. This quantitative difference is within the analytical errors of 10 to 15% expected for these products. In terms of 3PB generation, test BS-11 produced as much 3PB as BS-10. Batch test BS-11, however, produced smaller amounts of phenol as a NaTPB decomposition product when compared to BS-10. Therefore, we conclude that the presence of sludge in BS-11 may change the product distribution but not necessarily the NaTPB decomposition rate, as shown by the limited amount of phenol production in BS-11.
Test BS-12 to BS-17
We designed batch tests BS-12 through BS-17 to evaluate the effects of mercury and palladium concentrations on the decomposition rate of NaTPB at 35°C. The tests used two palladium catalyst concentrations, 7.8 mg/L (BS-12 to BS-14) and 26 mg/L (BS-15 to BS-17). The tests used three levels of mercury: 0.17 (BS-13 and BS-16), 8.5 (BS-12 and BS-15) and 85 mg/L (BS-14 and BS-17) (see Table 2).
Based on the magnitude of 3PB and 2PB generated within the first eight hours for tests BS-12 through BS-14, observed NaTPB decomposition rate increased with increasing mercury content.
Test BS-15 through BS-17 each contained 26 mg/L palladium catalyst with 85 (BS-17), 8.5 (BS-15) and 0.17(BS-16) mg/L mercury. The observed order for the generation of both 2PB and 3PB again suggests a direct correlation with mercury content.
Both test BS-12 and BS-15 contain equal amounts of mercury (8.5 mg/L) but different amounts of palladium catalyst (i.e., 26 mg/L for BS-15 and 7.8 mg/L for BS-12). However, based on the quantity of 3PB and 2PB products generated during the reaction no significant difference exists in the quantity of products generated between the two tests. Similarly, test BS-14 and BS-17 with equal amounts of mercury (85 mg/L) but different catalyst concentrations (i.e., 26 mg/L for BS-17 and 7.8 mg/L for BS-14) show no significant differences in quantity of 2PB product generated. However, the tests do show a significant difference in the quantity of 3PB generated. Test BS-17 with greater palladium produced more 3PB during the first 8 hours.
Test BS-18 to BS-21
Test BS-18 through BS-21 were designed to evaluate the effects of monosodium titanate on the decomposition of NaTPB as well as compare the extent of NaTPB decomposition at 25°C for 2.6, 7.8 and 26 mg/L palladium catalyst loading.
From Table 2, test 18, 20 and 21 contained MST while test BS-19 did not. Based on the generation of 3PB and 2PB (Appendix A), it appears that the presence of MST in BS-20 did not affect the decomposition of NaTPB within the first eight hours when compared with BS-19.
Test 18 showed the slowest NaTPB decomposition rate as expected. It had the lowest catalyst loading at 2.6 mg/L and, in addition, it contained MST. Test BS-21 with the highest catalyst loading at 26 mg/L showed the highest NaTPB decomposition rate at this temperature.
Table 5. NaTPB decomposition rates and generation rates for
3PB and 2PB
(Data not only based on the first eight hours or reaction).
|
Test |
NaTPB* |
3PB |
2PB |
|
BS-1 |
93 |
625 |
833 |
|
BS-2 |
128 |
252 |
812 |
|
BS-3 |
154 |
450 |
783 |
|
BS-4 |
82 |
302 |
705 |
|
BS-5 |
40 |
71 |
124 |
|
BS-6 |
341 |
740 |
314 |
|
BS-7 |
291 |
847 |
2153 |
|
BS-8 |
122 |
1089 |
2271 |
|
BS-9 |
199 |
964 |
1312 |
|
BS-10 |
220 |
351 |
2640 |
|
BS-11 |
183 |
464 |
978 |
|
BS-12 |
155 |
908 |
1080 |
|
BS-13 |
110 |
393 |
526 |
|
BS-14 |
124 |
422 |
700 |
|
BS-15 |
104 |
507 |
462 |
|
BS-16 |
61 |
39 |
90 |
|
BS-17 |
130 |
715 |
786 |
|
BS-18 |
16 |
51 |
25 |
|
BS-19 |
64 |
272 |
451 |
|
BS-20 |
23 |
168 |
111 |
|
BS-21 |
110 |
738 |
566 |
* Rates based on soluble NaTPB only.
Pseudo-first -order rate constants
The data summarized in Appendix A can be used to analyze the kinetics of NaTPB decomposition and the generation of both 3PB and 2PB using linear regression analysis in Microsoftâ Excel 5.0. For these pseudo-first -order rate determinations, we converted the concentrations for NaTPB, 3PB and 2PB into millimoles (mM). Table 5 shows the determined rates for NaTPB decomposition and generation of both 3PB and 2PB for all 21-batch tests. We did not base the determination of the decomposition and generation rates in Table 5 only on the first eight hours of reaction. We calculated the generation rates for both 2PB and 3PB based on their initial rise in concentration. It is worth noting that each batch test solution contains both soluble and insoluble NaTPB, and that the conservative rates for the decomposition of NaTPB are only based on soluble NaTPB. Therefore, 3PB and 2PB reaction products come from both soluble and insoluble NaTPB as reflected in the magnitude of calculated reaction rates.
Test BS-8 showed the highest rate constant for the generation of 3PB (Table 5), which agrees with earlier conclusions based on the first eight hours generation of 2PB and 3PB products.
The 2PB generation rate in test BS-10 (2640 E-04 mM h-1) is more than a factor of two higher than 2PB generation rate in test BS-11 (980 E-04 mM h-1 (Table 5)), and 3PB generation rate is about 25% higher in BS-11. However, the difference in NaTPB decomposition rate for the two batch tests is not statistically significant.
We attribute the large difference in 2PB generation rate to differences in product distribution, which seams to favor the production of 2PB in BS-10 (without sludge). Therefore, the effect of sludge on the decomposition of NaTPB may only be limited to changing product distribution and not necessarily the overall NaTPB decomposition rate.
Both tests BS-12 and BS-13 have equal amounts of catalyst loading but the rates for the generation of products is significantly higher in BS-12. We attribute this difference in 3PB and 2PB generation rates, as before, to lower concentration of mercury in BS-13 (Table 2). This significant difference in product generation due to differences in mercury content is also observed in test BS-17 and BS-16, with the latter containing less amount of mercury. There seams to be no significant differences in product generation between test BS-15 and BS-14, although BS-15 contains more than three times the amount of catalyst loading in BS-14. Both tests contain the same amount of mercury.
The rate constant data from Table 5 also shows that our earlier conclusion on the effect of MST on decomposition of NaTPB stands; MST suppresses decomposition reactions of NaTPB. Test containing MST (BS-20), at equal catalyst concentration to test without MST (BS-19), showed lower generation rates for both 3PB and 2PB. However, test BS-21 is an exception; for although it contained MST, it still produced sufficient amount of products. It is worth noting that BS-21 contained significantly more palladium catalyst when compared with BS-18, BS-19 or BS-20 (Table 2). Test BS-18 also containing MST showed the lowest NaTPB decomposition rate and the lowest 3PB and 2PB generation rates because it contained the lowest amount of catalyst.
We did not use the boron and 1PB data in any way to evaluate the extent of the batch reactions. Since we initially introduced a known amount of 1PB into all reaction mixtures, the amount of 1PB in all the batch tests (Appendix A) does not represent 1PB generated from NaTPB decomposition.
Conclusions and Recommendations
We completed batch tests to determine preliminary reaction conditions and effects of certain reagents in the catalytic decomposition of NaTPB using reduced palladium catalyst supported on alumina. In these batch tests, we obtained information relevant to the next phase of laboratory work involving the study of NaTPB decomposition using continuous stirred tank reactors (CSTRs) with a residence time of eight hours. Results from these batch tests suggest the following:
Recommended conditions and reagents for a follow up CSTR reactive system includes the following:
Meanwhile, we did not design these batch tests to address the following questions:
These and other questions of interest, such as details on the effects of MST and sludge, we will address in a series of follow-up CSTR tests.
Quality Assurance
This study fulfils part of the "Sodium Tetraphenylborate Catalyst Development Task Technical and Quality Assurance Plan" as documented in WSRC-99-01114, Rev. 0.
Data obtained from this study reside as records in WSRC-NB-99-00076 and WSRC-NB-98-00122 laboratory note books. The Analytical Development Section, using recommended standards, performed all analytical work.
Acknowledgments
The authors thank Analytical Development Section personnel, in particular, T. White, A. Still and J. Hart. We also acknowledge the contributions by the following technician: K. Prettel, L. Thacker and N. Gregory.
Appendix A
Batch data# summary for BS-1 through BS-21.
# In all HPLC analysis for NaTPB, 3PB, 2PB and 1PB, all peaks were resolved to the baseline and the detection limit was 10 mg/L.
|
Time, h |
BS-1, |
BS-2, mg/L |
BS-3, mg/L |
BS-4, mg/L |
BS-5, mg/L |
BS-6, mg/L |
BS-7, mg/L |
BS-8, mg/L |
BS-9, mg/L |
|
|
0 |
0 |
0 |
0 |
0 |
0 |
0 |
0 |
0 |
0@@ |
|
|
2.8 |
136 |
127 |
145 |
120 |
115 |
134 |
141 |
120 |
148 |
|
|
4.7 |
161 |
119 |
122 |
123 |
114 |
94 |
128 |
114 |
139 |
|
|
13.2 |
146 |
80 |
70 |
124 |
113 |
6 |
39 |
77 |
116 |
NaTPB |
|
22.2 |
118 |
40 |
40 |
92 |
98 |
0 |
0 |
0 |
9 |
at 45°C |
|
28.3 |
82 |
16 |
10 |
78 |
94 |
0 |
0 |
0 |
0 |
except BS-4 at |
|
43.5 |
44 |
0 |
0 |
34 |
97 |
0 |
0 |
0 |
0 |
25°C |
|
51.9 |
0 |
0 |
0 |
14 |
69 |
0 |
0 |
0 |
0 |
|
|
72.9 |
0 |
0 |
0 |
0 |
28 |
0 |
0 |
|
Time, h |
BS-1, |
BS-2, mg/L |
BS-3, mg/L |
BS-4, mg/L |
BS-5, mg/L |
BS-6, mg/L |
BS-7, mg/L |
BS-8, mg/L |
BS-9, mg/L |
|
|
0 |
0 |
0 |
0 |
0 |
0 |
0 |
0 |
0 |
0 |
|
|
2.8 |
0 |
0 |
15 |
0 |
41 |
47 |
2 |
51 |
0 |
|
|
4.7 |
0 |
39 |
62 |
0 |
69 |
84 |
0 |
109 |
39 |
|
|
13.2 |
18 |
138 |
138 |
22 |
96 |
33 |
253 |
329 |
345 |
3PB |
|
22.2 |
184 |
147 |
102 |
106 |
112 |
6 |
153 |
129 |
478 |
at 45°C |
|
28.3 |
242 |
95 |
88 |
130 |
120 |
0 |
41 |
6 |
383 |
except BS-4 at |
|
43.5 |
117 |
5 |
8 |
132 |
128 |
0 |
0 |
0 |
73 |
25°C |
|
51.9 |
37 |
0 |
0 |
84 |
141 |
0 |
0 |
0 |
0 |
|
|
72.9 |
0 |
0 |
0 |
15 |
102 |
0 |
0 |
|||
|
Time, h |
BS-1, |
BS-2, mg/L |
BS-3, mg/L |
BS-4, mg/L |
BS-5, mg/L |
BS-6, mg/L |
BS-7, mg/L |
BS-8, mg/L |
BS-9, mg/L |
|
|
0 |
0 |
0 |
0 |
0 |
0 |
0 |
0 |
0 |
0 |
|
|
2.8 |
0 |
0 |
0 |
0 |
0 |
0 |
0 |
0 |
0 |
|
|
4.7 |
0 |
0 |
23 |
0 |
33 |
57 |
0 |
46 |
0 |
|
|
13.2 |
3 |
144 |
152 |
2 |
100 |
312 |
155 |
187 |
86 |
2PB |
|
22.2 |
80 |
332 |
261 |
63 |
158 |
272 |
558 |
697 |
431 |
at 45°C |
|
28.3 |
160 |
337 |
330 |
109 |
171 |
215 |
680 |
729 |
556 |
except BS-4 at |
|
43.5 |
412 |
128 |
154 |
321 |
193 |
253 |
58 |
0 |
772 |
25°C |
|
51.9 |
316 |
29 |
127 |
439 |
185 |
225 |
0 |
0 |
654 |
|
|
72.9 |
94 |
43 |
17 |
281 |
200 |
17 |
17 |
|||
|
Time, h |
BS-1, |
BS-2, mg/L |
BS-3, mg/L |
BS-4, mg/L |
BS-5, mg/L |
BS-6, mg/L |
BS-7, mg/L |
BS-8, mg/L |
BS-9, mg/L |
|
|
0 |
404 |
384 |
384 |
394 |
394 |
391 |
395 |
397 |
392 |
|
|
2.8 |
412 |
409 |
405 |
407 |
413 |
<10 |
398 |
415 |
398 |
|
|
4.7 |
415 |
426 |
420 |
415 |
428 |
427 |
384 |
450 |
405 |
|
|
13.2 |
420 |
466 |
365 |
412 |
452 |
637 |
511 |
571 |
535 |
1PB |
|
22.2 |
471 |
556 |
523 |
450 |
460 |
591 |
539 |
563 |
645 |
at 45°C |
|
28.3 |
396 |
635 |
561 |
465 |
433 |
600 |
614 |
657 |
632 |
except BS-4 at |
|
43.5 |
367 |
756 |
612 |
503 |
350 |
557 |
1094 |
959 |
569 |
25°C |
|
51.9 |
609 |
634 |
511 |
494 |
269 |
525 |
487 |
307 |
595 |
|
|
72.9 |
745 |
513 |
429 |
680 |
256 |
595 |
595 |
|||
|
Time, h |
BS1, |
BS-2, mg/L |
BS-3, mg/L |
BS-4, mg/L |
BS-5, mg/L |
BS-6, mg/L |
BS-7, mg/L |
BS-8, mg/L |
BS-9, mg/L |
|
|
0 |
0 |
0 |
0 |
0 |
0 |
0 |
0 |
0 |
0 |
|
|
2.8 |
0 |
0 |
0 |
0 |
0 |
0 |
0 |
0 |
0 |
|
|
4.7 |
0 |
0 |
0 |
0 |
0 |
0 |
0 |
0 |
0 |
|
|
13.2 |
0 |
0 |
0 |
0 |
0 |
80 |
0 |
0 |
0 |
Phenol |
|
22.2 |
0 |
59 |
87 |
0 |
0 |
108 |
44 |
41 |
43 |
at 45°C |
|
28.3 |
38 |
91 |
128 |
0 |
59 |
141 |
63 |
47 |
62 |
except BS-4 at |
|
43.5 |
100 |
146 |
204 |
0 |
70 |
152 |
122 |
88 |
81 |
25°C |
|
51.9 |
173 |
163 |
221 |
28 |
80 |
168 |
135 |
103 |
98 |
|
|
72.9 |
254 |
199 |
240 |
57 |
110 |
153 |
153 |
|||
|
Time, h |
BS-1 |
BS-2 |
BS-3 |
BS-4 |
BS-5 |
BS-6 |
BS-7 |
BS-8 |
BS-9 |
|
|
0 |
57.7 |
57.4 |
62.7 |
61.7 |
58.8 |
50.9 |
58.3 |
56.4 |
||
|
4.7 |
86.5 |
65.4 |
66.1 |
56 |
62.2 |
69.1 |
54.2 |
69.7 |
60.1 |
BORON |
|
13.2 |
77.1 |
91.5 |
87.9 |
69.9 |
77.8 |
120 |
92.9 |
94.1 |
90.8 |
at 45°C |
|
22.2 |
87.5 |
105 |
109 |
86.7 |
96.5 |
145 |
122 |
128 |
125 |
except BS-4 at |
|
28.3 |
86.9 |
114 |
122 |
84.3 |
95.3 |
143 |
133 |
133 |
123 |
25°C |
|
43.5 |
97.3 |
119 |
123 |
84.5 |
86.8 |
145 |
159 |
151 |
130 |
|
|
51.9 |
131 |
145 |
162 |
109 |
101 |
152 |
186 |
162 |
139 |
|
|
72.9 |
146 |
172 |
166 |
130 |
112 |
204 |
183 |
203 |

|
TIME, h |
BS-12 |
BS-13 |
BS-14 |
BS-15 |
BS-16 |
BS-17 |
|
|
0 |
79 |
0 |
128 |
121 |
139 |
127 |
|
|
1.2 |
198 |
197 |
192 |
190 |
177 |
163 |
|
|
2.7 |
198 |
192 |
196 |
198 |
195 |
153 |
|
|
8.2 |
177 |
202 |
174 |
156 |
192 |
145 |
|
|
14.9 |
169 |
165 |
130 |
146 |
193 |
119 |
|
|
25.4 |
93 |
174 |
102 |
112 |
188 |
56 |
|
|
34.9 |
21 |
140 |
59 |
73 |
156 |
15 |
NaTPB |
|
44.4 |
0 |
89 |
15 |
40 |
135 |
0 |
at 35°C |
|
53.9 |
0 |
84 |
0 |
41 |
161 |
0 |
|
|
63.4 |
0 |
0 |
0 |
20 |
148 |
0 |
|
|
73.4 |
0 |
25 |
0 |
8 |
145 |
0 |
|
|
TIME, h |
BS-12 |
BS-13 |
BS-14 |
BS-15 |
BS-16 |
BS-17 |
|
|
0 |
0 |
0 |
15 |
0 |
0 |
9 |
|
|
1.2 |
0 |
0 |
41 |
0 |
0 |
57 |
|
|
2.7 |
0 |
0 |
43 |
10 |
0 |
135 |
|
|
8.2 |
44 |
0 |
72 |
59 |
0 |
183 |
3PB |
|
14.9 |
215 |
25 |
181 |
170 |
18 |
292 |
at 35°C |
|
25.4 |
425 |
51 |
203 |
280 |
34 |
353 |
|
|
34.9 |
459 |
82 |
184 |
288 |
45 |
243 |
|
|
44.4 |
133 |
330 |
73 |
244 |
55 |
27 |
|
|
53.9 |
16 |
346 |
33 |
231 |
59 |
0 |
|
|
63.4 |
0 |
52 |
0 |
187 |
65 |
0 |
|
|
73.4 |
0 |
270 |
0 |
135 |
131 |
0 |
|
|
TIME, h |
BS-12 |
BS-13 |
BS-14 |
BS-15 |
BS-16 |
BS-17 |
|
|
0 |
0 |
0 |
0 |
0 |
0 |
0 |
|
|
1.2 |
0 |
0 |
25 |
0 |
0 |
13 |
|
|
2.7 |
0 |
0 |
16 |
0 |
0 |
36 |
2PB |
|
8.2 |
0 |
0 |
31 |
18 |
0 |
57 |
at 35°C |
|
14.9 |
49 |
0 |
122 |
61 |
8 |
130 |
|
|
25.4 |
168 |
21 |
265 |
152 |
25 |
282 |
|
|
34.9 |
400 |
51 |
375 |
241 |
39 |
442 |
|
|
44.4 |
659 |
134 |
466 |
311 |
52 |
510 |
|
|
53.9 |
670 |
214 |
428 |
366 |
57 |
395 |
|
|
63.4 |
334 |
316 |
364 |
429 |
66 |
112 |
|
|
73.4 |
27 |
428 |
182 |
437 |
67 |
10 |
|
|
TIME, h |
BS-12 |
BS-13 |
BS-14 |
BS-15 |
BS-16 |
BS-17 |
|
|
0 |
407 |
393 |
398 |
396 |
403 |
407 |
|
|
1.2 |
407 |
392 |
389 |
389 |
372 |
687 |
|
|
2.7 |
393 |
384 |
388 |
382 |
392 |
389 |
1PB |
|
8.2 |
399 |
395 |
402 |
388 |
379 |
406 |
at 35°C |
|
14.9 |
419 |
389 |
407 |
421 |
403 |
408 |
|
|
25.4 |
391 |
387 |
433 |
433 |
342 |
459 |
|
|
34.9 |
439 |
368 |
476 |
421 |
324 |
519 |
|
|
44.4 |
520 |
368 |
589 |
419 |
304 |
628 |
|
|
53.9 |
659 |
375 |
667 |
446 |
279 |
779 |
|
|
63.4 |
894 |
394 |
770 |
465 |
245 |
933 |
|
|
73.4 |
1065 |
410 |
825 |
490 |
228 |
900 |
|
|
TIME, h |
BS-12 |
BS-13 |
BS-14 |
BS-15 |
BS-16 |
BS-17 |
|
|
0 |
0 |
0 |
0 |
0 |
0 |
0 |
|
|
1.2 |
0 |
0 |
0 |
0 |
0 |
0 |
Phenol |
|
2.7 |
0 |
0 |
0 |
0 |
0 |
0 |
at 35°C |
|
8.2 |
0 |
0 |
0 |
0 |
0 |
0 |
|
|
14.9 |
12 |
0 |
10 |
16 |
12 |
0 |
|
|
25.4 |
28 |
13 |
17 |
37 |
10 |
20 |
|
|
34.9 |
45 |
0 |
31 |
54 |
0 |
29 |
|
|
44.4 |
75 |
29 |
45 |
78 |
0 |
41 |
|
|
53.9 |
85 |
30 |
53 |
88 |
0 |
46 |
|
|
63.4 |
102 |
45 |
63 |
108 |
143 |
56 |
|
|
73.4 |
121 |
63 |
75 |
133 |
36 |
62 |
|
Time, h |
BS-18 |
BS-19 |
BS-20 |
BS-21 |
|
|
0 |
0 |
0 |
0 |
0 |
|
|
2.5 |
229 |
203 |
224 |
225 |
|
|
4.9 |
183 |
239 |
232 |
225 |
|
|
10.1 |
250 |
238 |
235 |
203 |
NaTPB |
|
15.7 |
248 |
218 |
227 |
172 |
at 25°C |
|
21.4 |
235 |
200 |
217 |
141 |
|
|
33.3 |
250 |
182 |
222 |
97 |
|
|
44.6 |
231 |
152 |
206 |
58 |
|
|
56.1 |
238 |
132 |
202 |
38 |
|
|
66.1 |
243 |
110 |
202 |
20 |
|
|
Time, h |
BS-18 |
BS-19 |
BS-20 |
BS-21 |
|
|
0 |
0 |
0 |
0 |
0 |
|
|
2.5 |
18 |
16 |
16 |
16 |
|
|
4.9 |
17 |
26 |
25 |
25 |
|
|
10.1 |
30 |
48 |
40 |
130 |
3PB |
|
15.7 |
34 |
113 |
66 |
235 |
at 25°C |
|
21.4 |
31 |
171 |
93 |
304 |
|
|
33.3 |
42 |
252 |
139 |
341 |
|
|
44.6 |
33 |
264 |
155 |
295 |
|
|
56.1 |
43 |
226 |
158 |
209 |
|
|
66.1 |
44 |
206 |
163 |
127 |
|
|
Time, h |
BS-18 |
BS-19 |
BS-20 |
BS-21 |
|
|
0 |
0 |
0 |
0 |
0 |
|
|
2.5 |
0 |
0 |
0 |
0 |
|
|
4.9 |
0 |
0 |
0 |
0 |
|
|
10.1 |
0 |
0 |
0 |
36 |
2PB |
|
15.7 |
0 |
35 |
17 |
93 |
at 25°C |
|
21.4 |
0 |
64 |
33 |
157 |
|
|
33.3 |
17 |
141 |
52 |
257 |
|
|
44.6 |
18 |
225 |
68 |
362 |
|
|
56.1 |
25 |
339 |
96 |
472 |
|
|
66.1 |
30 |
399 |
111 |
500 |
|
|
Time, h |
BS-18 |
BS-19 |
BS-20 |
BS-21 |
|
|
0 |
417 |
417 |
408 |
411 |
|
|
2.5 |
433 |
395 |
416 |
415 |
|
|
4.9 |
350 |
415 |
398 |
395 |
|
|
10.1 |
426 |
416 |
445 |
445 |
IPB |
|
15.7 |
425 |
441 |
423 |
489 |
at 25°C |
|
21.4 |
420 |
457 |
427 |
530 |
|
|
33.3 |
436 |
496 |
446 |
576 |
|
|
44.6 |
436 |
524 |
454 |
606 |
|
|
56.1 |
434 |
564 |
470 |
673 |
|
|
66.1 |
430 |
584 |
472 |
720 |
|
|
Time, h |
BS-18 |
BS-19 |
BS-20 |
BS-21 |
|
|
0 |
51.5 |
52.1 |
54 |
62.1 |
|
|
2.5 |
75.1 |
67.9 |
64.7 |
66.1 |
|
|
4.9 |
70.3 |
62.6 |
63.9 |
63.9 |
|
|
10.1 |
64.8 |
65.5 |
66.8 |
74.3 |
Boron |
|
15.7 |
66.8 |
74.3 |
71.7 |
80.9 |
at 25°C |
|
21.4 |
69.6 |
77.6 |
69.2 |
97.9 |
|
|
33.3 |
67.9 |
92.7 |
74.4 |
112 |
|
|
44.6 |
63.1 |
95.4 |
74.1 |
123 |
|
|
56.1 |
61.5 |
96.8 |
118 |
71.5 |
|
|
66.1 |
62.6 |
120 |
81 |
125 |
|
References