
WSRC-TR-2000-00458
In-Situ Gamma-PHA Measurements to Support Unconditional
Release of NSR Chiller Unit
R. A. Dewberry and S. R. Salaymeh
Westinghouse Savannah River Company
Aiken, SC 29808
This report was prepared as an account of work sponsored by an agency of the United States Government. Neither the United States Government nor any agency thereof, nor any of their employees, makes any warranty, express or implied, or assumes any legal liability or responsibility for the accuracy, completeness, or usefulness of any information, apparatus, product or process disclosed, or represents that its use would not infringe privately owned rights. Reference herein to any specific commercial product, process or service by trade name, trademark, manufacturer, or otherwise does not necessarily constitute or imply its endorsement, recommendation, or favoring by the United States Government or any agency thereof. The views and opinions of authors expressed herein do not necessarily state or reflect those of the United States Government or any agency thereof.
This report has been reproduced directly from the best available copy.
Available for sale to the public, in paper, from: U.S. Department of Commerce, National Technical Information Service, 5285 Port Royal Road, Springfield, VA 22161, phone: (800) 553-6847, fax: (703) 605-6900, email: orders@ntis.fedworld.gov online ordering: http://www.ntis.gov/support/ordering.htm
Available electronically at http://www.osti.gov/bridge/
Available for a processing fee to U.S. Department
of Energy and its contractors, in paper, from: U.S. Department of Energy, Office
of Scientific and Technical Information, P.O. Box 62, Oak Ridge, TN 37831-0062,
phone: (865 ) 576-8401, fax: (865) 576-5728, email: reports@adonis.osti.gov
Abstract
The Analytical Development Section of Savannah River Technology Center (SRTC) was requested by the Project Engineering and Construction Division (PE&CD) to conduct in-situ gamma-ray pulse height analysis measurements to support the unconditional release of the 221FBL/NSR chiller unit. The chiller unit was used to cool process water in the 221 FBL/NS facility, and it was serviced by its own cooling tower "closed circuit" system. This chiller unit had been in service for 18 years and has never been located within an SRS radiological area. The measurements’ main goal is to confirm that there is no process-related contaminants present on the chiller and associated piping. To accomplish this, we have acquired 48 gamma-ray pulse height analysis spectra. All acquisitions were made using a portable HPGe detector and EG&G Dart system that contains high voltage power supply and signal processing electronics. A personal computer with Gamma-Vision software was used to control the Dart MCA and provide space to store and manipulate multiple 4096-channel g-ray spectra.
Our results showed no activity above background. All peaks identified in the spectra are due to naturally-occurring radionuclides. This confirmed that these chillers are free of process-related gamma-emitting radioactive contamination. We estimate the chillers are completely clean of radioactive contamination to the limits of 1 nCi total gamma-ray activity. This report will discuss the purpose of the measurements, the experimental setup, data acquisition, calculations and results, and a conclusion of the study.
Keywords: Decontamination, High Density, Assay, Dismantlement, Spectrum, Process Equipment
Introduction
The Analytical Development Section of Savannah River Technology Center (SRTC) was requested by the Project Engineering and Construction Division (PE&CD) to conduct in-situ gamma-ray pulse height analysis measurements to support the unconditional release of a 221FBL/NSR chiller unit. The chiller unit was used to cool process water in the 221 FBL/NS facility, and it was serviced by its own cooling tower "closed circuit" system. This chiller unit had been in service for 18 years and has never been located within an SRS radiological area.1
NMSS tasked PE&CD Construction to dismantle and replace (D&R) one 225 ton York chiller unit from the roof of 221FBL/NSR and replace it with a new unit. This chiller unit is approximately 20 feet long by 3 feet in diameter and contains 100-200 inner copper tubes that run the length of the unit. The outer shell of the units is made of ½ inch carbon steel. Figure 1 shows a photograph of this unit. During a survey by F-Area Radiation Control Operation (RCO), low level contamination of the old chiller unit was detected. Although the chiller and majority of associated cooling water piping probed 10,000 dpm beta-gamma, one elbow probed 25,000 dpm beta-gamma. Further analysis of the elbow revealed that the activity in the pipe is due to natural thorium found in water.2
PE&CD and NMS&S made the decision to send the chiller and piping to the C-Area Decon Facility to handle the free release of these items. A considerable cost savings can be realized by not sending the units to the low-level burial site. In addition, WSRC Management Policy requires evaluation of treatment and disposal options that consider waste disposal, costs, and risks to dispose of large pieces of equipment rather than the burial option. 3
The Decon Facility wanted to confirm that the chiller units have no process-related contaminants prior to their unconditional release. The plan is to use the history of the units, survey data from F-Area, survey of the accessible areas inside the unit, and gamma-PHA to unconditionally release these chillers. The gamma-PHA measurements’ main goal is to confirm that there are no process-related-contaminants present on the chiller and associated piping.
Figure 1. Photograph of the Side of the Chiller Unit.
Experimental
To accomplish the measurements, we have acquired 48 g-ray pulse height analysis spectra. All acquisitions were made using a portable HPGe detector and EG&G Dart system that contains a high voltage power supply and signal processing electronics. A personal computer with Gamma-Vision software was used to control the Dart MCA and provide space to store and manipulate multiple 4096-channel g-ray spectra.4 We used a liquid-nitrogen-cooled portable germanium detection system that is described in Technical Report WSRC-TR-2000-00317. For the chiller unit we acquired holdup spectra in the close-field configuration as shown in Figure 2. We acquired spectra with the detector approximately 5 inches away from the entrance and exit channels. At that range we could not observe all of the entrance or exit channel. However, along with FDD management, we made the decision that a single acquisition at each end would be representative of the entire end. This reasoning is supported strongly by the data and results of a previous holdup measurement on a similar chiller.5 These chiller acquisitions and the interpretations of the data are very similar to those of reference 5.
We obtained a background spectrum with the detector isolated from the chiller and from the piping by both shielding and distance. The background is shown in Figure 7. This spectrum shows several naturally-occurring g-ray peaks that are labeled on it. The 105-C background g-ray activity is composed of natural activity from Th-232 daughters and natural U-238 daughters with no additional contributions from Cs-137 or Co-60. These species would normally be expected in a building that used to be an operating reactor. Using the peaks form the natural background, we were able to energy calibrate the detection system. To confirm our calibration we acquired a second short background with a Cs-137 source hand-held next to the detector. This spectrum is shown in Figure 8, and it clearly demonstrates that the Cs-137 g-ray at 661.7 keV falls right on target in our calibrated spectrum.
In all of the six close-coupled chiller spectra we observed background activity only. The measured peak areas for three naturally-occurring g-rays and three process-related g-rays are listed in the table. Example spectra from both ends of both chillers are shown in Figures 9 and 10. Note in each spectrum no process-related activity is observed. Therefore in no case is it necessary to calculate measured activity from our close-coupled configuration. It is necessary only to determine limits of detection for those nuclides that are process related. We performed that measurement for Cs-137 by placing a known source of Cs-137 in front of the entrance grid pattern of the chiller and collected the spectrum labeled FF side 2Cs in the table.
The measured area for the Cs-137 peak in spectrum FF side 2Cs is (140+18) counts in a 370.86-sec acquisition. The source activity was 5000 dpm. Thus our detection rate of 0.38 cps represents a counting efficiency of 0.45%, which is in very good agreement with previous observations4 and with the vendor specifications.6 From these data we can estimate a sensitivity for Cs-137 of 80 dpm for the surface area of the grid that we are able to view from five inches. From reference 7 we calculate that surface area to be 48 in2. Our net sensitivity for Cs-137 is 80dpm/48in2, or 0.0008 nCi/in2. Normalizing to the whole surface area of the entrance and exit grids, this sensitivity is far superior to (ie. lower than) the conservative estimate of 1 nCi that we used in the measurements of reference 5 for the previous chiller.
For conservatism, we adopt the limit of detection of 1nCi for each of U-235, Co-60, and Cs-137 process related g-rays that we have listed in the table. From the background spectra our limits of detection in units of cps for the process related g-rays is 0.2 cps for the 185 keV transition from U-235, 0.1 cps for the 662 keV transition from Cs-137, and 0.09 cps for the 173 keV transitions from Co-60. Wherever our measured count rates are less than those limits of detection, we specify that the content for that radionuclide is less than 1 nCi. This is true for the chiller entrance and exit grids and for the individual pieces of pipe that we counted.
We acquired 35 close-coupled spectra from the individual pipe pieces. The count times varied from 400 seconds up to as long as 14200 seconds, and the measured peak areas from each of the six g-rays are listed in the table. The count positions and count times varied depending on our judgement of where observed activity was most likely to appear. For many of the short pieces of pipe we acquired only one spectrum. For others that were long pieces or had one or multiple bends, we acquired additional spectra. In every case we acquired spectra from any bend or elbow that occurred. Process radioactivity was likely to accumulate in those spots.
Results
Table 1 lists the measured counts for three of the naturally occurring gamma ray transitions (238.6 Pb-212, 510.6 Tl-208, and 911.2 Ac-228). Table 1 also lists the process related gamma rays (185.6 U-235, 661.7 Cs-137, and 1173.2 Co-60). These gamma rays are the most likely to be observed at the Savannah River Site.

Figure 2. Photograph of a Close-Coupled Measurement of the Chiller.

Figure 3. Photograph of a Far-Field Measurement of the Chiller.

Figure 4. Photograph of a Close-Coupled Measurement of a Pipe.

Figure 5. Photograph of Pipe Associated With the Chiller.
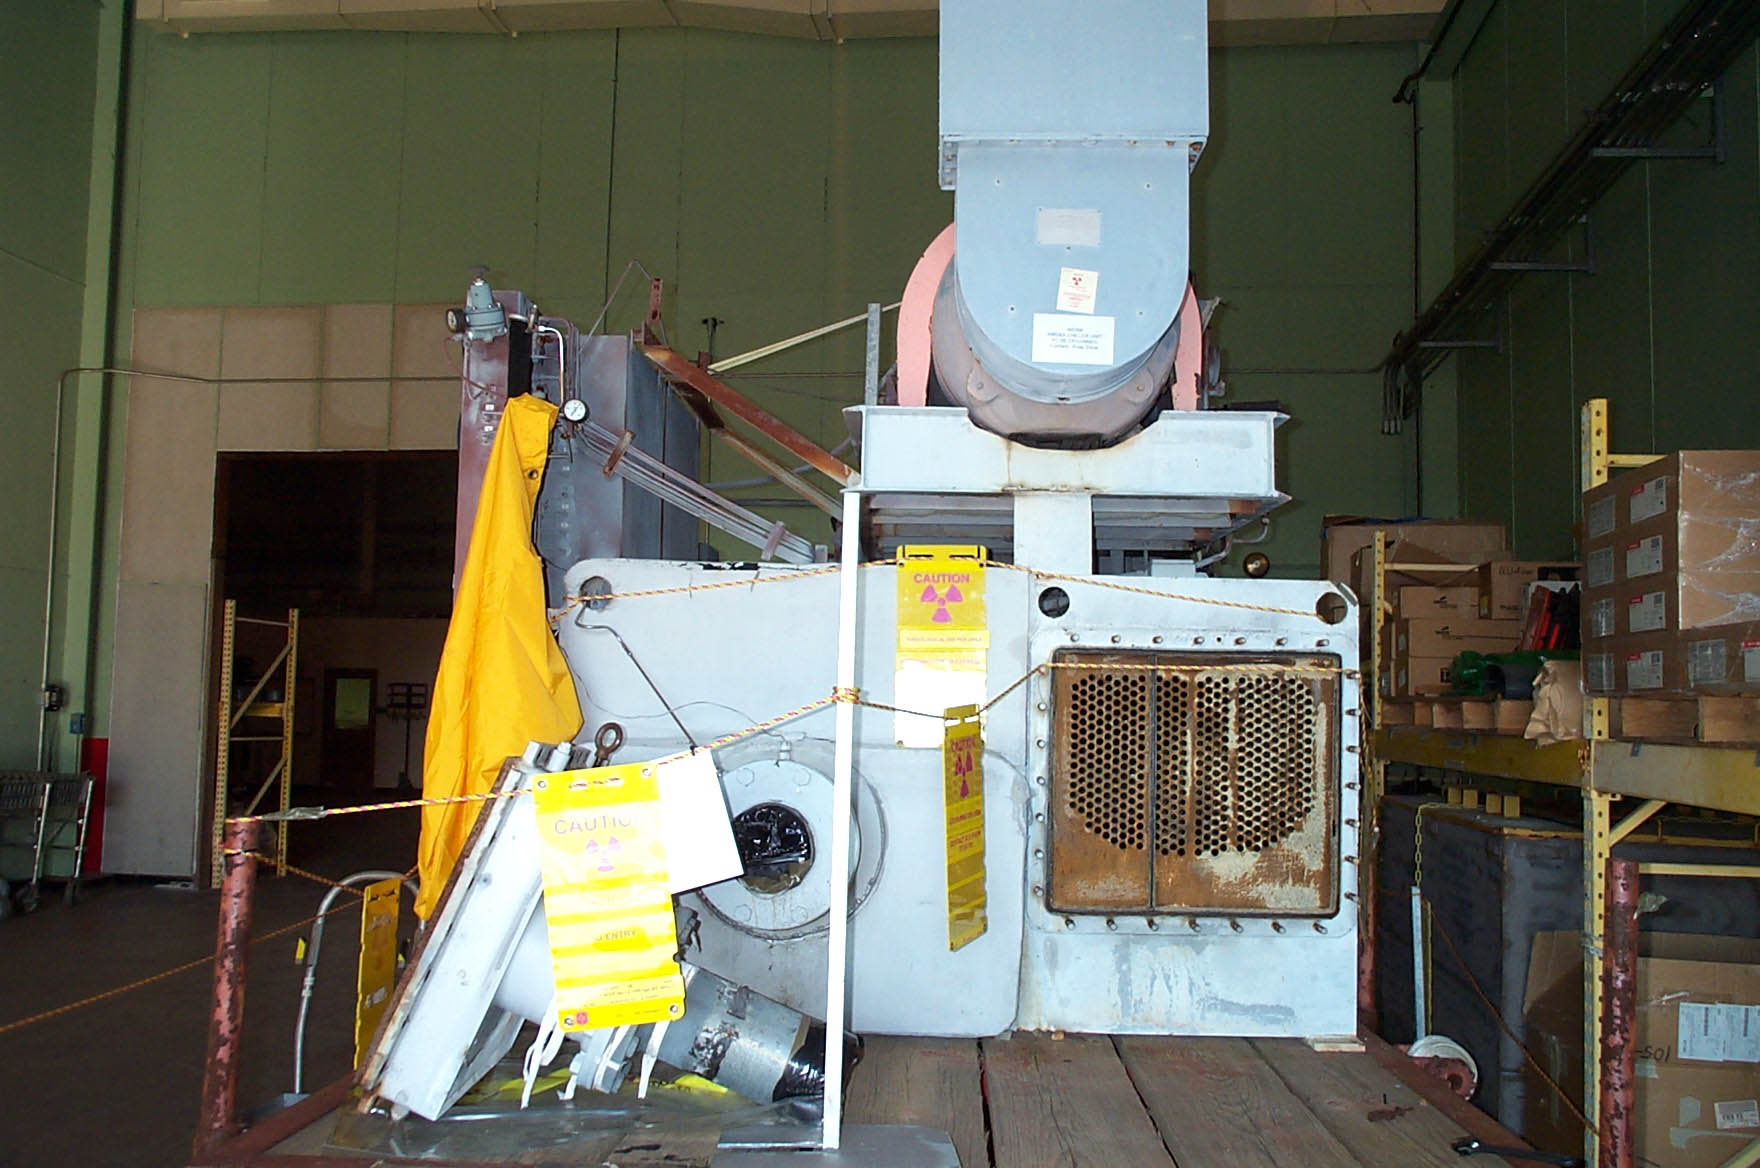
Figure 6. Photograph of One End of the Chiller Unit.
Discussion
The spectrum labeled pipleven was acquired for 14200 seconds. This spectrum came from an elbow in the piece of pipe that had been smeared by RCO to contain 25000 dpm of b-g activity. We gave this section special attention. It is clear from the data of that segment that the process related activity was below our limit of 1 nCi, and the observed activity comes completely from the naturally-occurring Th-232 chain.
Even for the 14200-second count on the section of pipe that had been previously identified by RCO to contain measurable activity, we observed no process related radioactivity. The data we acquired in all 48 spectra indicate that all observed activity comes from naturally occurring species. This chiller and its associated piping are eligible for free release using the same reasoning process as that applied to the previous chiller5 and to the trolleys.8

Figure 7. Spectrum of Background Taken on 10/17.

Figure 8. Spectrum of the Calibration Check.

Figure 9. Far Field Spectrum of the Chiller Inflow.

Figure 10. Far Field Spectrum of the Chiller Outflow.
Table 1. A List of Data Collected for The Chiller and Associated Pipe.
|
Sample Number |
186 KeV U-235 |
238 KeV Pb 212 Area |
511 KeV Tl 208 Area |
662 KeV Cs 137 Area |
911 KeV Ac 228 Area |
1173 KeV Co 60 Area |
Count |
|
1017Bkg |
29± 52 |
119± 41 |
314± 32 |
9± 26 |
213± 26 |
-3± 21 |
233.48 |
|
Cal Check |
-34± 31 |
46± 24 |
79± 20 |
587± 30 |
94± 15 |
-7± 13 |
745.04 |
|
Tnaught |
11± 10 |
-11± 10 |
1± 8 |
263± 18 |
5± 4 |
3± 1 |
100 |
|
Tpipe |
-14± 20 |
12± 18 |
6± 14 |
185± 25 |
-8± 12 |
-2± 7 |
269.82 |
|
Trans1 |
6± 19 |
44± 13 |
16± 12 |
416± 32 |
-11± 10 |
3± 4 |
188.46 |
|
FF side 1 |
-24± 26 |
88± 22 |
104± 20 |
-4± 16 |
40± 16 |
4± 15 |
1200 |
|
FF side 2 |
14± 27 |
21± 23 |
97± 21 |
-6± 16 |
47± 15 |
-1± 16 |
1200 |
|
FF L side 2 |
41± 67 |
311± 52 |
804± 50 |
24± 40 |
349± 41 |
100± 37 |
7200 |
|
FF side 2Cs |
-20± 18 |
21± 14 |
44± 11 |
140± 18 |
10± 10 |
-2± 9 |
370.86 |
|
Side1pos1 |
13± 23 |
35± 18 |
19± 19 |
-6± 14 |
65± 12 |
-12± 16 |
1200 |
|
Sid12pos2 |
18± 26 |
47± 20 |
95± 19 |
30± 13 |
56± 14 |
-22± 4 |
1200 |
|
Side2pos3 |
-7± 13 |
7± 11 |
8± 12 |
-3± 6 |
8± 9 |
-6± 10 |
421.4 |
|
Pipe one |
-28± 26 |
34± 18 |
77± 16 |
-14± 12 |
44± 11 |
-4± 14 |
517.36 |
|
Pipe two |
17± 20 |
16± 16 |
32± 15 |
-10± 11 |
55± 10 |
9± 6 |
400 |
|
Piptree |
8± 22 |
38± 18 |
50± 15 |
-10± 12 |
40± 10 |
6± 7 |
400 |
|
Pipfour |
-10± 22 |
38± 17 |
48± 14 |
-6± 10 |
27± 11 |
2± 10 |
400 |
|
Pipfiv |
40± 21 |
16± 17 |
66± 14 |
6± 10 |
66± 11 |
-9± 10 |
400 |
|
Pipesix |
0± 18 |
16± 15 |
56± 14 |
4± 8 |
16± 12 |
7± 4 |
400 |
|
Pipsevn |
196± 88 |
390± 69 |
805± 62 |
-60± 45 |
435± 52 |
-29± 35 |
7200 |
|
Pipate |
25± 28 |
34± 21 |
71± 19 |
16± 12 |
78± 14 |
19± 7 |
700 |
|
Pipnin |
-51± 30 |
70± 24 |
140± 18 |
4± 15 |
68± 15 |
-3± 11 |
700 |
|
Pipten |
-7± 28 |
97± 24 |
67± 22 |
-5± 15 |
47± 18 |
7± 8 |
700 |
|
Pipleven |
259± 122 |
1546± 101 |
1938± 84 |
33± 61 |
1230± 72 |
33± 42 |
14200 |
|
Pip3teen |
3± 30 |
44± 26 |
-40± 26 |
-11± 17 |
-7± 22 |
-20± 12 |
877.16 |
|
Pip4teen |
3± 22 |
36± 18 |
-34± 18 |
66± 21 |
-9± 15 |
-5± 10 |
451.76 |
|
Pip5teen |
-4± 20 |
65± 15 |
65± 14 |
22± 21 |
-9± 16 |
-5± 10 |
400 |
|
Pip6teen |
-16± 22 |
43± 16 |
49± 13 |
-2± 25 |
33± 10 |
-1± 7 |
400 |
|
Pip7teen |
6± 20 |
75± 16 |
59± 14 |
32± 18 |
40± 13 |
-7± 8 |
400 |
|
Pip8teen |
31± 18 |
85± 17 |
63± 16 |
-3± 33 |
56± 10 |
-3± 7 |
400 |
|
Valve9teen |
-5± 15 |
20± 10 |
24± 11 |
7± 18 |
8± 9 |
5± 5 |
400 |
|
Valvetwent |
29± 10 |
4± 10 |
43± 11 |
12± 19 |
8± 11 |
8± 6 |
400 |
|
Pip2one |
-25± 21 |
55± 14 |
85± 11 |
-20± 26 |
29± 11 |
11± 3 |
400 |
|
Pip2two |
-6± 32 |
22± 25 |
142± 21 |
19± 32 |
77± 17 |
-2± 11 |
974.2 |
|
Pip2tree |
17± 19 |
37± 17 |
67± 13 |
13± 21 |
44± 10 |
8± 7 |
400 |
|
Pip2four |
35± 19 |
58± 17 |
48± 15 |
-33± 28 |
23± 11 |
-10± 9 |
400 |
|
Pip2fiv |
11± 22 |
49± 19 |
68± 16 |
-12± 28 |
38± 12 |
-1± 8 |
400 |
|
Pip2six |
32± 21 |
42± 21 |
65± 13 |
-27± 25 |
51± 13 |
8± 6 |
400 |
|
Pip2sevn |
27± 21 |
67± 21 |
53± 15 |
-27± 30 |
62± 13 |
-14± 10 |
400 |
|
Pip2ate |
-3± 23 |
21± 21 |
61± 15 |
20± 21 |
47± 13 |
-3± 9 |
400 |
|
Pip2nin |
5± 19 |
40± 16 |
66± 13 |
26± 21 |
39± 12 |
-11± 8 |
400 |
|
Pipthirty |
27± 19 |
30± 15 |
59± 12 |
2± 21 |
49± 11 |
3± 6 |
400 |
|
Pipthirtyone |
4± 20 |
71± 16 |
83± 14 |
-9± 26 |
24± 13 |
2± 7 |
400 |
|
Pip3one |
2± 22 |
40± 19 |
63± 15 |
3± 24 |
49± 11 |
9± 4 |
400 |
|
Pip3tree |
-10± 22 |
40± 19 |
68± 13 |
-6± 23 |
43± 12 |
-6± 8 |
400 |
|
Pip3four |
-1± 9 |
-17± 17 |
35± 13 |
16± 25 |
54± 9 |
6± 5 |
400 |
|
Pip3fiv |
8± 28 |
29± 14 |
84± 14 |
17± 19 |
15± 11 |
-15± 10 |
400 |
|
Valvone |
-10± 22 |
38± 17 |
46± 14 |
-6± 10 |
27± 11 |
2± 10 |
400 |
|
Valvtwo |
14± 26 |
67± 20 |
100± 19 |
-5± 14 |
63± 15 |
-19± 13 |
700 |
|
Pip3teen |
3± 30 |
44± 26 |
-40± 26 |
-11± 17 |
-7± 22 |
-20± 12 |
877.16 |
|
Pip4teen |
3± 22 |
36± 18 |
-34± 18 |
66± 21 |
-9± 15 |
-5± 10 |
451.76 |
Conclusion
ADS researchers have acquired six close coupled g-PHA spectra from an NSR chiller unit and 35 close coupled spectra from its associated piping. The acquisitions were obtained with a high purity, high-resolution germanium detector system. In each of the spectra obtained we observed multiple g-rays that come from the naturally occurring decay chains of U-238 and Th-232. No process-related g-rays were observed above background. We were especially attentive toward process contamination from U-235, Cs-137, and Co-60, and we have set upper limits of content of 1 nCi total activity in each item measured and at both the entrance and exit grids of the chiller unit. This chiller and its associated piping are eligible for free release based on the using the same reasoning process that was applied to the previous chiller and to the trolleys.
References