
WSRC-TR-2000-00255
SRS Data Report for Lynntech Soil Ozone Treatment
Demonstration
Adjacent to the 321-M Solvent Storage Tank Pad
K. M. Vangelas, B. Riha, B. B. Looney,
W. K. Hyde, J. L. Simmons, and R. Raymond
Westinghouse Savannah River Company
Aiken, SC 29808
This report was prepared as an account of work sponsored by an agency of the United States Government. Neither the United States Government nor any agency thereof, nor any of their employees, makes any warranty, express or implied, or assumes any legal liability or responsibility for the accuracy, completeness, or usefulness of any information, apparatus, product or process disclosed, or represents that its use would not infringe privately owned rights. Reference herein to any specific commercial product, process or service by trade name, trademark, manufacturer, or otherwise does not necessarily constitute or imply its endorsement, recommendation, or favoring by the United States Government or any agency thereof. The views and opinions of authors expressed herein do not necessarily state or reflect those of the United States Government or any agency thereof.
This report has been reproduced directly from the best available copy.
Available for sale to the public, in paper, from: U.S. Department of Commerce, National Technical Information Service, 5285 Port Royal Road, Springfield, VA 22161, phone: (800) 553-6847, fax: (703) 605-6900, email: orders@ntis.fedworld.gov online ordering: http://www.ntis.gov/support/ordering.htm
Available electronically at http://www.osti.gov/bridge/
Available for a processing fee to U.S. Department of Energy and its contractors, in paper, from: U.S. Department of Energy, Office of Scientific and Technical Information, P.O. Box 62, Oak Ridge, TN 37831-0062, phone: (865 ) 576-8401, fax: (865) 576-5728, email: reports@adonis.osti.gov
1.0 Summary
At large industrial sites like the A/M Area of the Savannah River Site (SRS), undissolved dense non-aqueous phase liquid (DNAPL) in soil and groundwater is the most significant barrier to successful clean up. DNAPL acts as a reservoir that will continue to generate contaminant levels far above remediation concentration goals well into the future. In an effort to achieve remediation goals and reduce future costs, the SRS DNAPL program is evaluating technologies that will recycle or destroy DNAPL. In situ oxidation is one class of DNAPL destruction technologies. A demonstration of this class of technologies was conducted at SRS in the winter of 1999 and spring of 2000 employing ozone as the oxidant. Lynntech Inc. through a Small Business Innovative Research grant partnered with the Savannah River Site to demonstrate their soil ozone treatment technology. The Savannah River Site provided the demonstration location and field support of the test. This demonstration involved treating a small vadose zone DNAPL plume in the A/M Area over a 29 day period. Approximately 2000 pounds of DNAPL (perchloroethylene [PCE] and trichloroethylene [TCE]) were removed through the soil vapor extraction unit (SVEU). Soil core data indicate that approximately 300 pounds of DNAPL were removed from the test site. This report documents the data collected by SRS personnel during the demonstration of Lynntech’s Soil Ozone Treatment Technology.
The in situ oxidation of DNAPL demonstration deployed an ozone based technology to destroy or enhance the removal of DNAPL in the unsaturated (vadose) zone. This demonstration was conducted under a Small Business Innovative Research grant to Lynntech, Inc. with the Westinghouse Savannah River Company as a partner. The site selected for the demonstration is a 15 ft radial area adjacent to the 321-M Solvent Storage Tank Pad, a known source of DNAPL. This site is adjacent to a former storage tank in which PCE, primarily, was stored. A railroad spur ran to this tank allowing for offloading of the neat solvents directly to the tank. There are recorded instances of overfilling of the tank and subsequent spillage of neat solvent to the ground. DNAPL is located at throughout the vadose zone in this area. An active soil vapor extraction system is present in this area and has removed large quantities of DNAPL from the lower vadose zone. However, none of the wells connected to the SVEU are screened in the upper 40 feet of the vadose zone. Concentrations of DNAPL in the inter-bedded sands in the shallow clays (20 to 40 ft depth below ground surface) indicate pure DNAPL is present. The screens for the Lynntech demonstration were set between 31.5 ft and 37.5 feet below ground surface. The treatment zone consisted of a 7,065 ft3 volume of soil containing approximately 370 pounds of DNAPL. One injector well, three extraction wells and four monitoring ports were installed for this test. The demonstration occurred in three stages: pre-test characterization, technology test, and post-test characterization.
Characterization efforts conducted throughout the demonstration provide Lynntech personnel with data to be used to evaluate the effectiveness of the technology. Pre- and post-test characterization activities consisted primarily of soil core sampling to determine the soil concentration of TCE and PCE in the treatment zone. Soil gas sampling was conducted during the testing phase of the demonstration to provide information on TCE and PCE concentrations being extracted through operation of the SVEU. Flow rates were measured at each extraction well. Flows remained set for the duration of the test.
Field activities were initiated September 9, 1999 with collection of soil plug samples during the installation of the injection well, extraction wells and sampling ports. On November 15, 1999 hookup of the wells followed by one week of baseline testing of the extraction system to determine flow rates and PCE/TCE concentrations prior to ozone injection was initiated. The testing phase of the ozone injection began on January 31, 2000. The ozone injection testing ran for a period of 29 days, concluding on February 29, 2000. Post-test characterization activities began March 7, 2000 and were completed April 5, 2000.
2.0 Introduction
Lynntech, Inc. were the recipients of a Department of Energy, Small Business Innovative Research, grant to demonstrate their soil ozone treatment technology. The Savannah River Site was the host site for Lynntech’s demonstration. Westinghouse Savannah River Company provided the infrastructure and field support for this demonstration. This report documents activities conducted to initiate and implement this demonstration. Data collected by WSRC personnel during the demonstration is included in this report. This information will be provided to Lynntech, Inc. personnel to aid in their evaluation of the soil ozone treatment technology. The in situ oxidation of DNAPL demonstration deployed a ozone based technology to destroy DNAPL within the unsaturated (vadose) zone. The site selected for the demonstration is a 15 ft radial area adjacent to the 321-M Solvent Storage Tank Pad, a known source of DNAPL. The site is located at a point of know spillage of DNAPL. A railroad spur runs adjacent to the location of the former solvent storage tank. This was an offloading point for neat solvent. It is known that there were instances of overfilling of the tank and subsequent spillage to the ground surface in the immediate area. DNAPL is present throughout the 135 feet of the vadose zone. An active SVE system in this immediate area has led to decreasing concentrations over the last 10 years. None of the wells tied into the SVE system are screened in the shallow clays which are know to have concentrations indicating the presence of pure DNAPL. This demonstration was conducted in the inter-bedded sands in these shallow clays at a depth of approximately 35 ft below ground surface. One injector well, three extraction wells and four vadose zone monitoring ports were installed for this test. The demonstration occurred in three stages: pre-test characterization, technology test, and post-test characterization. The following report documents results of WSRC activities.
Field activities were initiated September 9, 1999 with collection of soil plug samples during the installation of the injection well, extraction wells and sampling ports. On November 15, 1999 hookup of the wells followed by one week of baseline testing of the extraction system to determine flow rates and PCE/TCE concentrations prior to ozone injection was initiated. The testing phase of the ozone injection began on January 31, 2000. The ozone injection testing ran for a period of 29 days, concluding on February 29, 2000. Post-test characterization activities began March 7, 2000 and were completed April 5, 2000.
3.0 Background
The M-Area of Savannah River Site was a fuel and target fabrication facility. The mission of this area was processing uranium, lithium, aluminum and other materials into fuel elements and targets for use in the nuclear production reactors. The processes were primarily metallurgical and mechanical, such as casting, extrusion, plating, hot-die-sizing, welding and magneforming. Solvent cleaning and acid/caustic etching were used to prepare the materials.
The 321-M solvent storage tank facility was located west of building 321-M in the A/M-Area of the SRS. The facility consisted of a solvent and acid tank which were supported on a concert pad with secondary containment walls and sumps. The pad sits in a man-made earthen depression with an approximate depth of 1 to 1˝ feet. This berm is most predominant on the southern and western edges and extends approximately 10 to 15 feet out from the pad edges. The tanks were bounded on the east side by a railroad track and associated transfer equipment. The tanks, track, and associated above ground equipment were removed in the fall of 1997. The pad and two sumps were left in place. The 782-6M soil vapor extraction unit is located approximately 40 feet to the south of the tank pad.
The tank, located adjacent to a railroad car transfer facility, was used to store chlorinated solvents (including trichloroethylene, perchloroethylene, and 1,1,1-trichloroethane) beginning in 1957. This facility consisted of a 17,000 gallon storage tank with associated piping and equipment necessary to off-load solvent from rail-cars to the storage tank and to distribute solvent to the other process facilities in the M-Area and across the site. Each of the reactor areas received one to two barrels of solvent per month from M-Area stocks. In addition, the degreasers located in 773-A were also supplied with solvent from M-Area suppliers (Marine and Bledsoe, 1984). After the installation of the 321-M solvent storage tank facility, the rail car storage facilities previously located on the east side of the 313-M and 320-M facilities were no longer the primary solvent storage areas for the 300-Area. The solvent storage tank served as the primary point for the storage and distribution of solvent in the M-Area except for the period between 1962 and 1970, during which time PCE was introduced into the 313-M process and would have required local storage. According to Marine and Bledsoe (1984), numerous undocumented spills and leaks occurred in the vicinity of the solvent storage tank from off-loading the railroad cars. One spill of significance is reported to have occurred in October 1975. A cracked ceramic seal on a transfer pump resulted in an estimated 1,200 gallon of PCE being released to the environment. The incident report states that there was no evidence of PCE puddling on the ground.
Figure 3.1 shows the selected location for this demonstration, the area of review, all monitoring wells, surface bodies of water, roads, and other cultural features. Because "treatment" of pure phase non-aqueous phase liquid (NAPL) is the key to a successful and timely cleanup, in situ oxidation technologies are promising systems for destruction of both aqueous and pure phase NAPL in the subsurface.

Figure 3.1 Area Map of Lynntech Soil Ozone Technology
Demonstration Site,
Located Adjacent to the 321-M Solvent Storage Tank Area.
4.0 Description of Lynntech Soil Ozone Technology (Lynntech, April 22, 1999)
The process of enhanced soil vapor extraction (SVE) with ozone injection to be field tested at the 321-M Solvent Storage Tank pad site, will utilize an existing SVE system at the site for extraction of volatile organic contaminants from soil and Lynntech’s electrochemical ozone generation system for in situ production and injection of ozone gas into soil subsurface. The degradation of chlorinated hydrocarbons in vadose zone soil proceeds through the oxidation by molecular ozone and/or formation of hydroxyl radicals generated by the degradation of ozone in soil. Up to 17 wt% ozone is produced in the Lynntech’s ozone generator. The ozone is injected into the soil under pressure (up to 15 psi) produced by the electrochemical ozone generator.
4.1 Electrochemical Ozone Generator
Figure 4.1 depicts the principle of Lynntech’s electrochemical ozone generator process. Sources of electrical power and water are the only requirements for producing ozone electrochemically. The reactions depicted in Figure 4.1 are made to occur by applying DC electricity between the anode and cathode which are positioned on either side of a Nafion 117 proton-exchange membrane. When water is fed to the anode side, where the electrode is coated with lead dioxide, two water oxidation reactions take place; the oxygen (O2) evolution reaction, equation (1), and the ozone, O3, formation, equation (2).

Utilization of high overpotentials (i.e., anode potentials much higher than 1.23 Volts) and certain elecrode materilas (e.g., lead dioxide) enhance O3 formation at the expense of O2 evolution. The O3 and O2 partition between the liquid and the gas phases as they are formed. The water oxidation reactions yield protons and electrons, which are recombined at the cathode. Electrons are conducted to the cathode via the external electronic circuit.
A Nafion (DuPont) proton-exchange membrane (PEM) solid electrolyte, containing –SO3- ion-exchange sites, serves as the proton conducting pathway between the two electrodes. The use of a Nafion PEM instead of a liquid electrolyte offers several advantages: (I) fluid management is simplified and the potential for leakage of corrosive liquids is eliminated; (ii) the membrane serces as a separator between the anode and cathode; and, (iii) the Nafion/anode interface provides a chemical environment which is suited to the electrochemical ozone formation reaction. As a fluoropolymer, Nafion displays a very high resistance to chemical attack by ozone. The possible cathodic reactions are shown in equations (3) and (4).

The oxygen reduction reaction is thermodynamically favored over hydrogen formation, hence, the reduction of oxygen reduces the overall cell voltage (i.e., the energy required to drive the system). However, specialized gas diffusion electrodes are required for oxygen reduction so in the process hydrogen is evolved at the cathode.
Figure 4.2 is a drawing of the electrochemical O3 generation cell and fluid flow diagram used in Lynntech’s ozone generator. In the O3 generator, several cells (each electrode = 100 cm2) are stacked in series to form multicell stacks.
Performance and Specification of Lynntech’s ozone generator: (i) high O3 concentrations (17 wt%) can be generated; and (ii) the optimum current for efficient O3 formation occurs at a current density of 1.5 A/cm2. The cell’s performance is constant over a period of several thousand hours. The output ozone/oxygen gas is pressurized by the internal operation of the cell without a compressor. The method requires 30 kWh of electricity to produce 1 kg of O3. Deionized water is pumped from the anode reservoir where the gas (ozone) liquid separation occurs. The ozone gas output from the gas liquid separator is fed directly into the injection wells. This design incorporates an automated water management system which returns water accumulated at the cathode side of the cell to the anode reservoir. Water is accumulated at the cathode due to electroosmotic drag (see Figure 4.1). Make up water is automatically deionized in deionization cartridges before introduction into the anode feed loop. Hydrogen from the cathode is eliminated by catalytic recombination to yield water or it may be off-gassed to the air.
4.2 Geology in the Vicinity of the 321-M Solvent Storage Tank Area
Typical of the Atlantic Coastal Plain, sediments beneath A/M-Area are interbedded sands, silts and clays deposited during periods of fluctuation in sea level and modified by erosion during intervening times. Clay rich confining, or restrictive, intervals are interspersed with more transmissive, sandier intervals. In A/M-Area, there are several clay rich intervals above the water table (with elevations of about 325 feet msl, 305 feet msl, and 270 feet msl). Ground surface in central A/M-Area is about 365 feet msl, and the water table is approximately 135 feet deep (elevation 235 feet msl). At the 321-M Solvent Storage Tank Area concentrations of PCE indicative of DNAPL are found localized in the 325-foot clay. This clay consists of multiple layers of sand and clay and is typically dark purple to light grayish purple in color (Parker and others, 1999). The DNAPL zone targeted for the Lynntech soil ozone treatment demonstration is the 325-foot clay.
4.3 Selection of Demonstration Location
Two locations of suspected shallow DNAPL accumulation were identified: 1) along the process sewer line approximately 150 feet from the closed M-Area Settling Basin; and 2) adjacent to the 321-M Solvent Storage Tank Pad, see Figure 3.1. Soil gas data at location one indicated very low levels of trichloroethylene and tetrachloroethylene present in the shallow vadose. Soil data collected at location 2 indicated shallow zones of DNAPL between 30 feet and 40 feet below ground surface. Location 2 was selected for the Lynntech demonstration due to the presence of DNAPL in the shallow vadose zone. The demonstration location is east of the remaining concrete pad on which the solvent tank was placed.
Initial field work for this demonstration involved use of the cone penetrometer to obtain soil gas samples and soil samples, and use of an auger drill rig to obtain soil samples for site selection. Several cone penetrometer pushes were conducted at location one to allow for soil gas sample collection. Due to low concentrations of TCE and PCE this location was eliminated and no further work conducted. Due to extensive knowledge of the contaminant levels at location two, the cone penetrometer was used to collect soil samples to identify zones to concentrate soil sampling efforts with the auger drill rig. The estimated pre-tested volume of DNAPL at location 2 was approximately 320 pounds.

Figure 4.1. Principle of the electrochemical ozone generation (Lynntech, April 22, 1999)
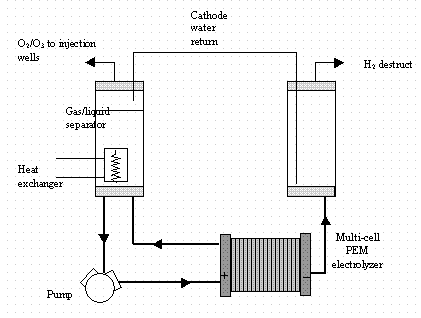
Figure 4.2 Flow diagram of the system for electrochemical ozone production (Lynntech, April 22, 1999)
5.0 Description of Demonstration
This demonstration was conducted in three phases: pre-test characterization, technology test (or treatment phase), post-test characterization. Pre-test characterization was used to identify the location of the demonstration, the zone to be targeted for treatment, and initial TCE and PCE concentrations. Pre-test drilling at the selected demonstration site consisted of 4 auger borings and 4 cone penetrometer pushes. The injector and 3 extraction wells were installed in the auger borings and 4 sampling ports were installed in the cone penetrometer push holes. The injector well was identified as MVO-1. The extraction wells were identifed as MVO-2, -3, and –4. The sampling ports were identifed as MVO-5, -6, -7 and –8. These are shown in Figure 5.1. MVO-1 through MVO-4 were cored and samples collected and analyzed for TCE and PCE concentrations. Soil samples were collected using a soil sampling tube attached to the cone penetrometer for MVO-5 through MVO-8.
The treatment phase was conducted in two parts. Upon completing the hookup of the wells for the Lynntech demonstration (MVO-2 through MVO-4) to the 782-6M SVEU, baseline data was collected for a period of one week to determine flows and extracted concentrations of TCE and PCE prior to ozone injection. This was followed by the demonstration of the ozone injection which began on January 31,2000 and was concluded on February 29, 2000. The injection of the ozone was controlled remotely by Lynntech personnel. The ozone injector was tied to Lynntech’s office in College Station, TX via computer and phone modem. Savannah River Technology Center (SRTC) personnel monitored soil gas as measured from the sampling ports (MVO-5 through MVO-8), the extraction wells (MVO-2 through MVO-4), and from the 782-6M SVEU. Soil gas samples were analyzed for PCE and TCE. In addition, a Bruel & Kjaer (B&K) Model 1302 gas monitor was hooked up to the 782-6M SVEU for "continuously" monitoring TCE, PCE and CO2 concentrations. Due to fouling of the B&K filter near the end of the treatment period, data is not available for the end of the ozone injection period. The data collected using the B&K during the initial stages of the demonstration testing are provided in this report.
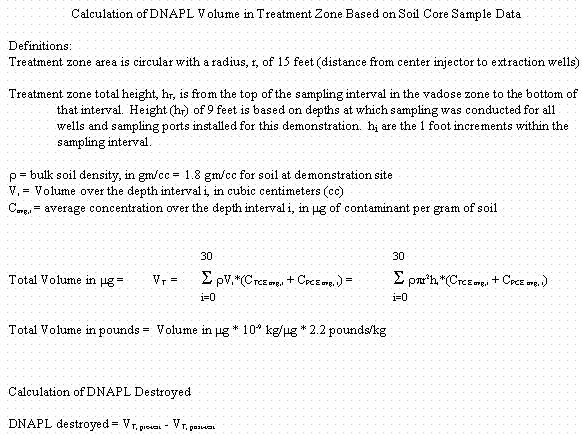
Five foot screens were used for all installed wells (both monitoring and injector) with the screen zone set from 31.5 ft to 37.6 ft below surface. A circular pattern was chosen for the system layout with an injector in the center, ringed by 3 extraction wells with 4 sampling ports in a transect across the treatment zone from MVO4 to MVO-3. The extractors were set on 15 foot centers. Figure 5.1 shows a schematic of the system layout. Upon completing pre-test drilling, it was determined that approximately 320 pounds of DNAPL was located within the treatment zone (see Appendix A for equation). The treatment zone was defined as being from 330 ft msl to 340 ft msl, a zone approximately 10 feet in depth. Testing of Lynntech soil ozone treatment process occurred over a 29 day period. Injection was controlled remotely by Lynntech personnel. Extraction was continuous for the 29 day period. The injectate was composed of ozone up to 17 wt %. On March 8, 2000, post-test drilling was initiated to verify removal of DNAPL from the treatment zone.
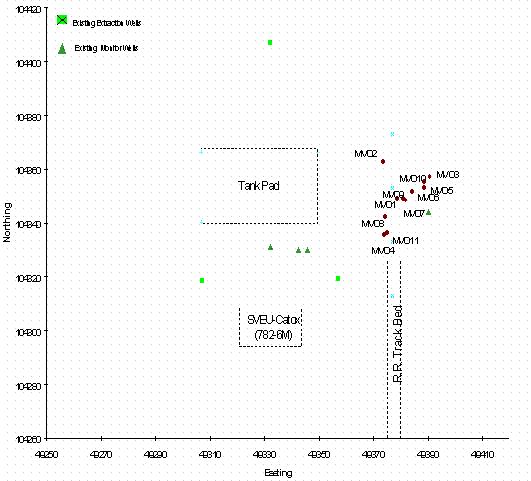
Figure 5.1 Schematic of Lynntech Soil Ozone Treatment Field Demonstration Site Layout (coordinates are a local grid in feet)
6.0 Analysis and Evaluation of Pre-Test Characterization Samples
Soil samples for these tests were analyzed by headspace analysis using a gas chromatograph (GC) with a flame ionization detector (FID) and electron capture detector (ECD) for TCE and PCE. Duplicates were collected for all samples. Standards were prepared and run with each batch of samples analyzed. Standard curves were generated and concentrations determined for each analyzed sample. This methodology was followed for all soil samples analyzed for TCE and PCE throughout the demonstration (pre-treatment, and post-treatment).
Soil gas samples were analyzed by direct injection using a HP 58990 Series II GC. This GC is calibrated using certified gas standards containing the compounds of interest at typical concentrations of 1, 10, 100, 500, and 1000 ppmv and laboratory air blanks. The GC is equipped with an ECD and FID connected in parallel. The column is a Supelco - VOCOLä megabore borosilicate glass (60 m x 0.76 mm ID x 1.5 m m film thickness) specifically developed for volatile priority pollutants (EPA Methods 502, 602, and 8240). This methodology was followed for all soil gas samples analyzed for TCE and PCE.
The Bruel & Kjaer (B&K) Model 1302 gas monitor was used to measure the soil gas for TCE, PCE, and CO2 at the 782-6M SVEU. The B&K 1302 uses a photoacoustic infrared detector with select optical windows for speciation. This instrument was used for continuous monitoring of soil gas at the 782-6M SVEU. The instrument was set up to take readings at intervals between 5 minutes and 15 minute dependent on the phase of the testing.
All pre-test data at the demonstration location is provided in Appendix A. Sampling intervals on the cone penetrometer completed borings were every 0.5 feet at depths of 30 to 40 feet below ground surface. Sampling intervals on the auger drill rig completed borings were approximately 0.5 feet to 1.0 feet at depths of 30 to 40 feet below ground surface. Small sampling intervals enabled identification of discrete DNAPL zones to the extent possible in this area of tightly interbedded sands and clays. Data indicated DNAPL concentrations at elevations of 340 ft msl to 331 ft msl (30.5 ft bgs to 38.3ft bgs). The DNAPL at this site is predominantly PCE (96% of total estimated volume of DNAPL).
Using the pre-test data, the well screen depths were selected. The 5 foot screen zones of the injector and 3 extraction wells were set at elevations between 337.7 ft msl and 331.5 ft msl (31.5 ft bgs to 37.6 ft bgs). The sampling ports had 4 inch screen zones. These were set at elevations between 335.3 ft msl and 330.6 ft msl (34.0 ft bgs to 38.7 ft bgs). The screen zones for each sampling port and well are provided in Appendix A.
The DNAPL is interspersed throughout the 9 foot section sampled. This is due to the heterogeneous nature of soils. This area is has many thin sand layers interspersed between thin clay layers. The volume of DNAPL in the target treatment zone was calculated using all pre-test characterization data (see appendix A for calculation). The treatment zone extended vertically from an elevation of 340 ft msl to 331 ft msl and laterally a circular area of radius 15 feet from the center injector. Volumes of DNAPL present were calculated over 1 foot increments by averaging the soil core data within each increment. The volumes were added and a total volume of 320 pounds of DNAPL was calculated.
7.0 Analysis and Evaluation Of Treatment Test Samples
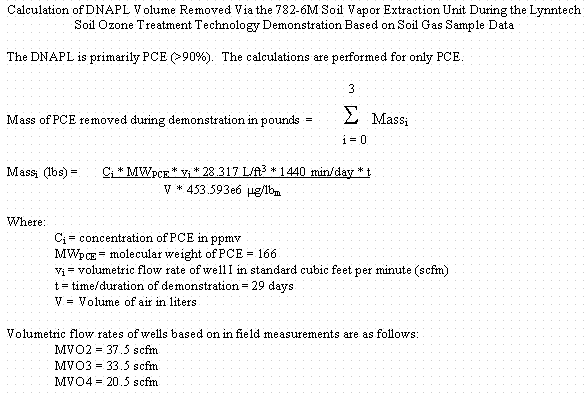
Prior to initiating ozone injection, the 782-6M SVEU was connected to the three MVO extraction wells and operated for one work week to determine baseline/steady-state conditions. The data collected included TCE, PCE, CO2 and flow rate measurements. Baseline flow rate measurements from the three extraction wells, MVO-2, MVO-3 and MVO-4, were 37.5, 33.5 and 20.5 scfm, respectively. Soil gas sampling was conducted on a daily basis during the baseline testing. The results of the soil gas analysis for TCE and PCE were used to estimate the baseline concentrations. This data is depicted in Figures 7.1, 7.2 and 7.3 for wells MVO-2, MVO-3 and MVO-4, respectively. The data is provided in Appendix A.
During the 4 week ozone injection testing, soil gas samples were collected weekly from the 782-6M SVEU, the 3 MVO extraction wells, and the 4 sampling ports. The sampling ports that were monitored varied weekly due to Lynntech conducting on-line monitoring from select sampling ports. SRTC personnel did not sample those wells to preclude compromising the data Lynntech personnel were collecting. The results of the soil gas samples are provided in Appendix A. The data is depicted in Figures 7.1, 7.2 and 7.3 for wells MVO-2, MVO-3 and MVO-4. The data indicate the PCE and TCE concentrations present in the extracted air decreased during the ozone injection at a different rate than during the baseline testing, as depicted by the difference in slope of the lines through the data.
The data from the monitoring ports (MVO-5, -6, -7 and –8) which had 4-inch long screen zones are presented in figures 7.4, 7.5, 7.6, and 7.7. The data from these sampling ports shows a decrease in TCE and PCE concentrations over the duration of the demonstration. It was noted in monitoring ports MVO-5, -6 and –7 the PCE concentration dropped below the concentration of TCE during the ozone injection of the test. However, this was not seen in monitoring port MVO-8. This was not seen in any of the extraction wells (MVO-2, –3 and -4).
8.0 Analysis and Evaluation of Post-Test Characterization Samples
Three post test soil borings were conducted to obtain sediment samples for VOC analysis to aid in determining effectiveness of the treatment process. A significant decrease in PCE and TCE concentration was observed in post-test sediment samples. Post-test borings were located on a transect running through the test area (MVO-9, -10 and –11). See Figure 5.1.
Samples for these tests were analyzed by headspace analysis using a gas chromatograph (GC) with a flame ionization detector (FID) and electron capture detector (ECD) for TCE and PCE, Appendix B. Duplicates were collected for all samples. Standards were prepared and run with each batch of samples analyzed. Standard curves were generated, and concentrations determined for each analyzed sample.
All post-test data is provided in Appendix A. Sediment sampling began at approximately 30 ft bgs at an interval of approximately every six inches to total depth at approximately 40 ft bgs. A dramatic decrease in VOC sediment concentrations was observed compared to pre-test borings indicating either removal of DNAPL via the SVEU or destruction via oxidation with the ozone. These findings will be discussed in Section 9.0.
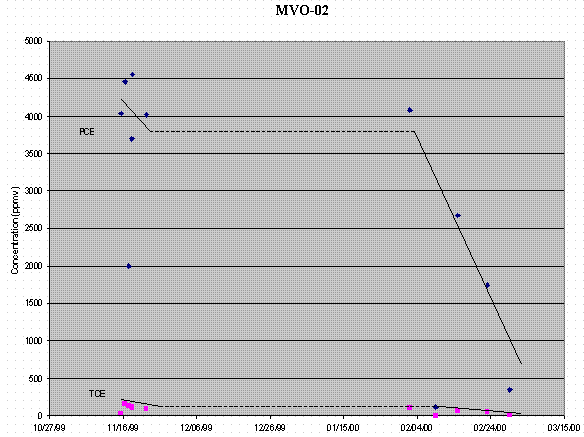
Figure 7.1. Lynntech Soil Ozone Testing Data from Well MVO-2.
MVO-03
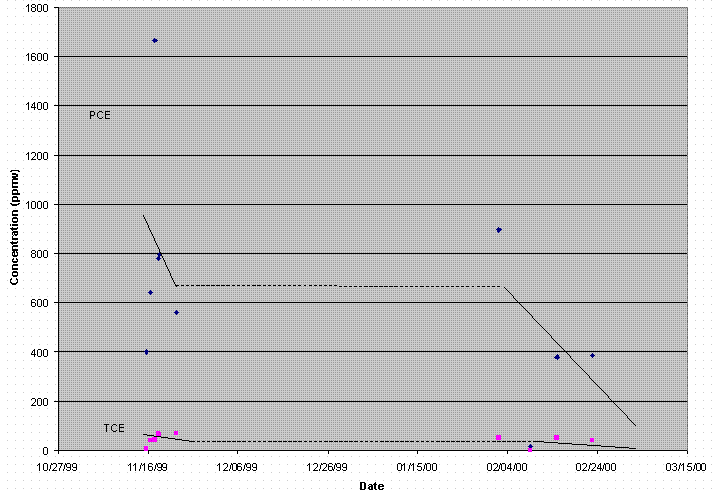
Figure 7.2. Lynntech Soil Ozone Testing Data from Well MVO-3.
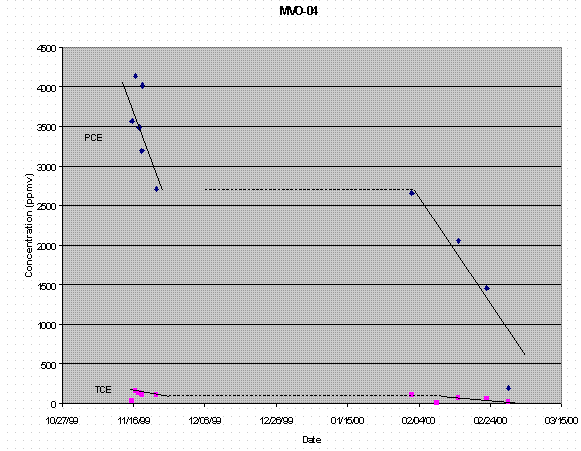
Figure 7.3. Lynntech Soil Ozone Testing Data from Well MVO-4.
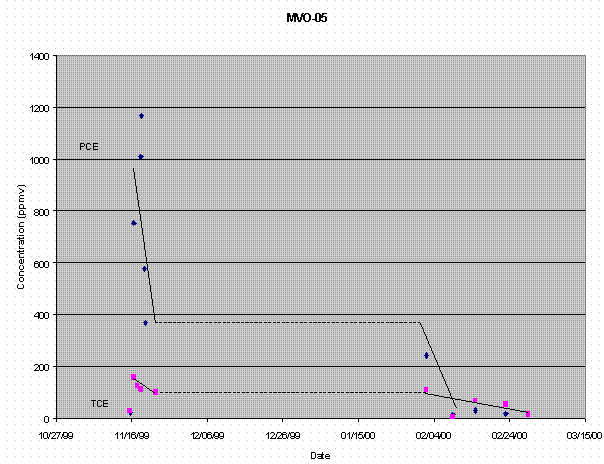
Figure 7.4. Lynntech Soil Ozone Testing Data from Sampling Port MVO-5.
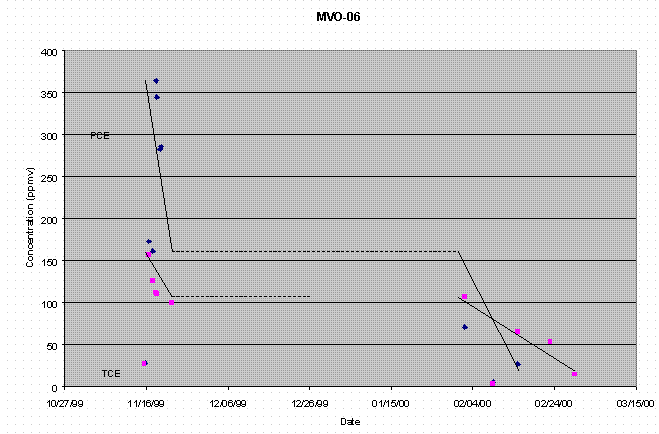
Figure 7.5. Lynntech Soil Ozone Testing Data from Sampling Port MVO-6.
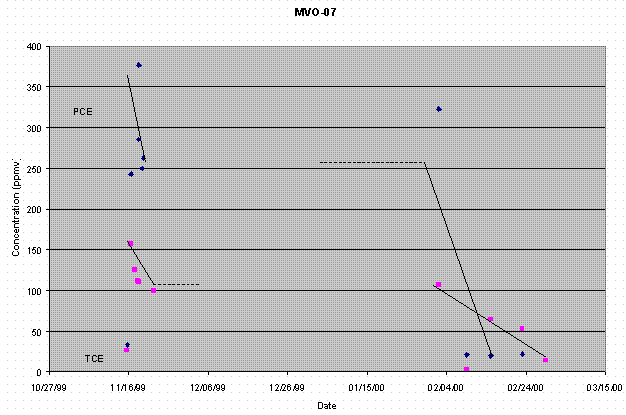
Figure 7.6. Lynntech Soil Ozone Testing Data from Sampling Port MVO-7.
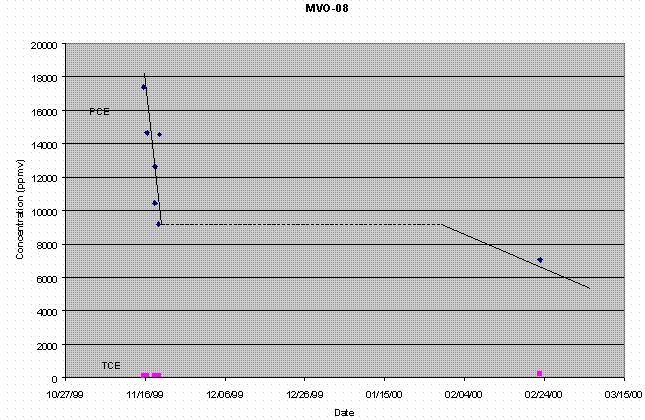
Figure 7.7. Lynntech Soil Ozone Testing Data from Sampling Port MVO-8.
9.0 Evalution of Demonstration Data Collected by WSRC
A comparison of pretest and posttest data was used to estimate a percentage of the TCE and PCE removed. A significant decrease in sediment concentrations is evident. The estimated pre-test mass of DNAPL in the treatment zone was 319 lbs, and the estimated post-test mass of DNAPL was 24.3 lbs. This results in a 92% destruction rate estimated for the treatment zone. The treatment zone is defined as the vertical distance between 30 ft bgs and 40 ft bgs and a 15 ft radius around the center injector. The estimated mass of DNAPL in the treatment zone before and after the test is presented in Table 9.1. Mass of contaminants was estimated by averaging sediment concentrations at one foot depth intervals and assuming a treatment zone of 7,065 ft3. A graphical depiction of the total pounds of DNAPL by one foot intervals in the treatment zone is shown in Figure 9.1. The location of the injection zone (5 ft injector screen lengths) is shown. The data indicate the TCE and PCE were removed from 8 of the 10 one-foot intervals sampled a part of this demonstration.
The results of the soil gas sampling indicate a significant quantity of PCE was removed through the extraction wells and soil vapor extraction unit. As this system is pre-dominantly (> 95%) PCE, the calculation of vapor phase contaminants removed was calculated only for PCE. Appendix A contains the results of the gas sampling from the extraction wells and the SVEU unit during the ozone injection period. Estimated quantities of PCE removed through each of the 3 extraction wells MVO-2, -3 and –4 in 29 days are 1,214 lbs, 225 lbs and 589 lbs, respectively. This is a total of 2,028 pounds of PCE. This same calculation was made using the data from the SVEU which operated at approximately 230 scfm and an average of the soil gas samples collected from the unit throughout the duration of the ozone injection. This resulted in an estimated quantity of 2,390 lbs of PCE removed through the SVEU during the ozone injection.
The larger mass of PCE calculated from the soil gas samples than from the soil samples is typical as the soil vapor extraction system has a larger radius of influence than the extent of the soil samples/test cell perimeter. It is not possible to calculate the percent of the PCE removed through the SVEU that came from the test area for the Lynntech demonstration. The configuration of the Lynntech demonstration was such that the influence of the ozone would have been largely contained within the 15-foot radius emanating from the injector well. The 295 pounds of DNAPL removed from the treatment zone were either removed through the SVEU or destroyed by the ozone. Based on the data collected by SRTC it is not possible to determine the method, either removal or destruction.
Table 9.1 Calculated Pre- and Post-Test DNAPL Mass and
Percent Removal/Destruction
for the Lynntech Soil Ozone Venting Demonstration based on Sediment Sample Analyses
|
Contaminants, lbs |
DNAPL |
||
|
PCE |
TCE |
(Total of PCE and TCE) |
|
|
Pre-Test |
307 |
12 |
319 |
|
Post-Test |
24 |
0.3 |
24.3 |
|
Percent Removed/Destroyed |
92 |
97.5 |
92.4 |
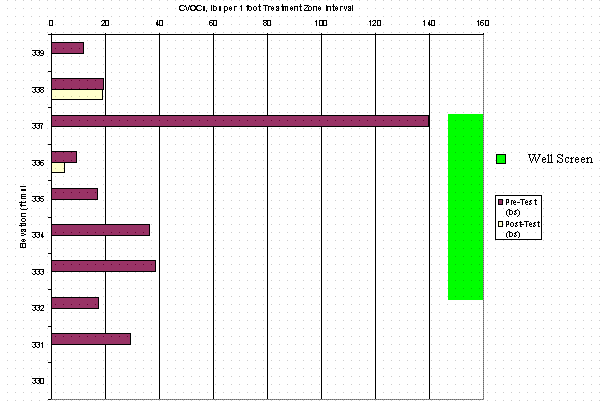
Figure 9.1 - Pre and Post Test DNAPL Mass for the Lynntech Soil Ozone Treatment Technology Demonstration
10.0 References
Appendix A
Raw Data for Lynntech Soil Ozone Technology
Demonstration
Adjacent to the
321-M Solvent Storage Tank Pad
Boring/Well Coordinates for Lynntech Soil Ozone Technology Demonstration
|
ID |
Northing |
Easting |
Elevation |
Top of Screen – Elevation |
Bottom of Screen – Elevation |
|
(ft msl) |
(ft msl) |
(ft msl) |
|||
|
MVO1 |
104348.9 |
49378.8 |
370.0 |
337.8 |
332.8 |
|
MVO2 |
104362.6 |
49373.8 |
369.5 |
337.5 |
332.5 |
|
MVO3 |
104357.0 |
49390.7 |
369.2 |
331.6 |
326.6 |
|
MVO4 |
104335.4 |
49374.0 |
368.6 |
332.1 |
327.1 |
|
LYN5/MVO5 |
104355.1 |
49388.6 |
369.0 |
333.0 |
332.7 |
|
LYN6/MVO6 |
104351.5 |
49384.2 |
368.9 |
330.9 |
330.6 |
|
LYN7/MVO7 |
104348.4 |
49381.9 |
369.4 |
333.4 |
333.1 |
|
LYN8/MVO8 |
104342.4 |
49374.3 |
369.3 |
335.3 |
335.0 |
|
MVO9 |
104348.9 (est) |
49380.9 (est) |
370.0 (est) |
N/A |
N/A |
|
MVO10 |
104353.1 (est) |
49388.6 (est) |
369.2 (est) |
N/A |
N/A |
|
MVO11 |
104336.4 (est) |
49375.0 (est) |
368.6 (est) |
N/A |
N/A |
Pre-Test Soil Plug Sample Data for Lynntech Soil Ozone Technology Demonstration
|
ID |
Elevation |
Depth |
Soil Concentration |
|
|
|
(ft bgs) |
TCE |
PCE |
|
|
MVO1-01 |
339.5 |
30.5 |
8.761 |
141.970 |
|
MVO1-02 |
338.75 |
31.25 |
3.415 |
10.815 |
|
MVO1-03 |
337.5 |
32.5 |
353.049 |
4930.097 |
|
MVO1-04 |
336.75 |
33.25 |
0.309 |
1.595 |
|
MVO1-05 |
335.6 |
34.4 |
2.116 |
22.559 |
|
MVO1-06 |
334.5 |
35.5 |
0.181 |
1.826 |
|
MVO1-07 |
333.6 |
36.4 |
36.457 |
1906.699 |
|
MVO1-08 |
332.9 |
37.1 |
0.143 |
1.240 |
|
MVO1-09 |
331.5 |
38.5 |
0.193 |
3.618 |
|
MVO1-10 |
330.9 |
39.1 |
0.245 |
2.224 |
|
MVO2-01 |
336.9 |
32.6 |
0.691 |
14.639 |
|
MVO2-02 |
336.0 |
33.5 |
0.224 |
7.665 |
|
MVO3-01 |
338.6 |
30.6 |
0.002 |
0.028 |
|
MVO3-02 |
337.9 |
31.3 |
<0.001 |
0.012 |
|
MVO3-03 |
336.6 |
32.6 |
0.002 |
0.029 |
|
MVO3-04 |
335.9 |
33.3 |
<0.001 |
0.005 |
|
MVO3-05 |
334.7 |
34.5 |
<0.001 |
0.007 |
|
MVO3-06 |
333.9 |
35.3 |
<0.001 |
0.004 |
|
MVO3-07 |
332.7 |
36.5 |
<0.001 |
0.010 |
|
MVO3-08 |
332.2 |
37.0 |
<0.001 |
0.003 |
|
MVO3-09 |
330.6 |
38.6 |
<0.001 |
0.009 |
|
MVO3-10 |
330.0 |
39.2 |
<0.001 |
0.004 |
|
MVO4-01 |
338.1 |
30.5 |
17.781 |
702.930 |
|
MVO4-02 |
336.1 |
32.5 |
0.159 |
1.993 |
|
MVO4-03 |
335.1 |
33.5 |
0.085 |
0.641 |
|
MVO4-04 |
334.1 |
34.5 |
0.035 |
0.337 |
|
MVO4-05 |
333.1 |
35.5 |
0.053 |
0.457 |
|
MVO4-06 |
332.1 |
36.5 |
0.198 |
13.668 |
|
MVO4-07 |
331.1 |
37.5 |
0.003 |
0.035 |
|
LYN7-32 |
337.4 |
32.0 |
0.011 |
0.034 |
|
LYN7-32.5 |
336.9 |
32.5 |
0.009 |
0.031 |
|
LYN7-33 |
336.4 |
33.0 |
0.003 |
0.010 |
|
LYN7-33.5 |
335.9 |
33.5 |
0.003 |
0.006 |
|
LYN7-34 |
335.4 |
34.0 |
1.237 |
25.691 |
|
LYN7-34.5 |
334.9 |
34.5 |
0.098 |
0.292 |
|
LYN7-35 |
334.4 |
35.0 |
0.010 |
0.039 |
|
LYN7-35.5 |
333.9 |
35.5 |
0.057 |
0.168 |
|
LYN8-33 |
336.3 |
33.0 |
18.547 |
881.201 |
|
LYN8-33.5 |
335.8 |
33.5 |
2.390 |
261.397 |
|
LYN8-34 |
335.3 |
34.0 |
19.402 |
1167.051 |
|
LYN8-34.5 |
334.8 |
34.5 |
10.850 |
2739.995 |
|
LYN8-36.5 |
332.8 |
36.5 |
0.046 |
1.125 |
|
LYN8-37 |
332.3 |
37.0 |
0.325 |
1300.436 |
|
LYN8-37.5 |
331.8 |
37.5 |
0.857 |
1100.572 |
Post-Test Soil Plug Sample Data for Lynntech Soil Ozone Technology Demonstration
|
ID |
Elevation |
Depth |
Soil Concentration |
|
|
|
|
TCE |
PCE |
|
|
MVO9-01 |
341.0 |
29.0 |
0.009 |
0.069 |
|
MVO9-02 |
340.5 |
29.5 |
0.017 |
0.163 |
|
MVO9-03 |
340.0 |
30.0 |
0.012 |
0.133 |
|
MVO9-04 |
339.5 |
30.5 |
0.004 |
0.045 |
|
MVO9-05 |
339.0 |
31.0 |
0.002 |
0.026 |
|
MVO9-06 |
338.5 |
31.5 |
0.006 |
0.208 |
|
MVO9-07 |
338.0 |
32.0 |
0.012 |
0.171 |
|
MVO9-08 |
337.5 |
32.5 |
0.006 |
0.080 |
|
MVO9-09 |
337.0 |
33.0 |
0.001 |
0.013 |
|
MVO9-10 |
336.5 |
33.5 |
0.906 |
224.985 |
|
MVO9-11 |
335.5 |
34.5 |
0.003 |
0.084 |
|
MVO9-12 |
335.0 |
35.0 |
0.013 |
0.179 |
|
MVO9-13 |
334.2 |
35.8 |
0.003 |
0.055 |
|
MVO9-14 |
333.7 |
36.3 |
0.002 |
0.065 |
|
MVO9-15 |
333.2 |
36.8 |
0.002 |
0.031 |
|
MVO9-16 |
332.7 |
37.3 |
0.003 |
0.055 |
|
MVO9-17 |
332.2 |
37.8 |
0.008 |
0.129 |
|
MVO9-18 |
331.7 |
38.3 |
0.002 |
0.046 |
|
MVO9-19 |
331.2 |
38.8 |
0.003 |
0.059 |
|
MVO9-20 |
330.7 |
39.3 |
0.002 |
0.027 |
|
MVO9-21 |
330.2 |
39.8 |
0.003 |
0.047 |
|
MVO10-01 |
336.2 |
33.0 |
<0.001 |
<0.001 |
|
MVO10-02 |
335.7 |
33.5 |
0.005 |
0.005 |
|
MVO10-03 |
335.2 |
34.0 |
<0.001 |
<0.001 |
|
MVO10-04 |
334.7 |
34.5 |
<0.001 |
<0.001 |
|
MVO10-05 |
334.2 |
35.0 |
<0.001 |
0.001 |
|
MVO10-06 |
333.7 |
35.5 |
0.002 |
0.003 |
|
MVO10-07 |
333.2 |
36.0 |
0.003 |
0.004 |
|
MVO10-08 |
332.7 |
36.5 |
<0.001 |
<0.001 |
|
MVO10-09 |
332.2 |
37.0 |
0.005 |
0.007 |
|
MVO10-10 |
331.7 |
37.5 |
0.007 |
0.009 |
|
MVO10-11 |
331.2 |
38.0 |
0.006 |
0.015 |
|
MVO10-12 |
330.7 |
38.5 |
0.001 |
0.003 |
|
MVO10-13 |
330.2 |
39.0 |
0.003 |
0.006 |
|
MVO10-14 |
329.7 |
39.5 |
0.007 |
0.015 |
|
MVO10-15 |
329.2 |
40.0 |
0.004 |
0.007 |
|
MVO10-16 |
328.7 |
40.5 |
0.002 |
0.003 |
|
MVO11-01 |
338.6 |
30.0 |
13.064 |
941.450 |
|
MVO11-02 |
338.1 |
30.5 |
0.179 |
1.442 |
|
MVO11-03 |
337.6 |
31.0 |
0.172 |
1.800 |
|
MVO11-04 |
337.1 |
31.5 |
0.128 |
1.162 |
|
MVO11-05 |
336.6 |
32.0 |
0.344 |
10.231 |
|
MVO11-06 |
336.1 |
32.5 |
0.013 |
0.127 |
|
MVO11-07 |
335.6 |
33.0 |
0.019 |
0.169 |
|
MVO11-08 |
335.1 |
33.5 |
0.023 |
0.152 |
|
MVO11-09 |
334.6 |
34.0 |
0.058 |
0.911 |
|
MVO11-10 |
334.1 |
34.5 |
0.024 |
0.246 |
|
MVO11-11 |
333.6 |
35.0 |
0.091 |
0.926 |
|
MVO11-12 |
333.1 |
35.5 |
0.079 |
0.576 |
|
MVO11-13 |
332.6 |
36.0 |
0.011 |
0.170 |
|
MVO11-14 |
332.1 |
36.5 |
0.110 |
2.372 |
|
MVO11-15 |
331.6 |
37.0 |
0.040 |
0.580 |
|
MVO11-16 |
331.1 |
37.5 |
0.015 |
0.152 |
|
MVO11-17 |
330.6 |
38.0 |
0.034 |
0.584 |
|
MVO11-18 |
330.1 |
38.5 |
0.046 |
0.596 |
|
MVO11-19 |
329.6 |
39.0 |
0.074 |
0.954 |
|
MVO11-20 |
329.1 |
39.5 |
0.096 |
1.532 |
Soil Gas Data From Baseline Testing Prior to Ozone Injection
for the Lynntech Soil Ozone Technology Demonstration
|
ID |
Date |
PCE |
TCE |
|
MVO2 |
11/15/99 12:40 pm |
4040.92 |
26.52 |
|
11/16/99 12:20 pm |
4461.40 |
156.75 |
|
|
11/17/99 1:00 pm |
1993.91 |
125.35 |
|
|
11/18/99 8:35 am |
3701.42 |
111.94 |
|
|
11/18/99 1:15 pm |
4551.94 |
110.64 |
|
|
11/22/99 8:23 am |
4021.54 |
99.08 |
|
|
MVO3 |
11/15/99 12:55 pm |
398.54 |
5.44 |
|
11/16/99 12:12 pm |
641.57 |
38.75 |
|
|
11/17/99 12:30 pm |
1666.63 |
41.45 |
|
|
11/18/99 8:25 am |
778.12 |
65.57 |
|
|
11/18/99 1:05 pm |
796.71 |
62.57 |
|
|
11/22/99 8:12 am |
562.14 |
69.03 |
|
|
MVO4 |
11/15/99 1:10 pm |
3568.97 |
214.28 |
|
11/16/99 12:31 pm |
4135.13 |
258.80 |
|
|
11/17/99 12:55 pm |
3486.01 |
219.34 |
|
|
11/18/99 8:50 am |
3194.62 |
206.38 |
|
|
11/18/99 1:05 pm |
4017.96 |
239.92 |
|
|
11/22/99 8:35 am |
2706.63 |
190.00 |
|
|
MVO5 |
11/15/99 3:55 pm |
21.55 |
0.28 |
|
11/16/99 12:46 pm |
752.40 |
105.37 |
|
|
11/18/99 8:50 am |
1008.18 |
210.79 |
|
|
11/18/99 12:25 pm |
1168.07 |
204.15 |
|
|
11/19/99 8:30 am |
576.54 |
167.62 |
|
|
11/19/99 2:25 pm |
367.95 |
167.79 |
|
|
MVO6 |
11/15/99 4:00 pm |
27.43 |
0.12 |
|
11/16/99 1:00 pm |
172.84 |
15.36 |
|
|
11/17/99 1:00 pm |
161.26 |
14.77 |
|
|
11/18/99 9:10 am |
364.43 |
77.33 |
|
|
11/18/99 12:25 pm |
344.91 |
80.62 |
|
|
11/19/99 8:15 am |
282.44 |
124.92 |
|
|
11/19/99 2:35 pm |
285.29 |
141.91 |
|
|
MVO7 |
11/15/99 4:08 pm |
33.19 |
0.41 |
|
11/16/99 12:53 pm |
242.70 |
28.06 |
|
|
11/18/99 9:20 am |
285.40 |
113.41 |
|
|
11/18/99 12:40 pm |
376.29 |
115.93 |
|
|
11/19/99 8:23 am |
249.78 |
149.80 |
|
|
11/19/99 2:45 pm |
262.36 |
146.73 |
|
|
MVO8 |
11/15/99 4:15 pm |
17376.61 |
101.54 |
|
11/16/99 1:05 pm |
14669.57 |
92.60 |
|
|
11/18/99 9:31 am |
10433.45 |
111.50 |
|
|
11/18/99 12:47 pm |
12631.04 |
101.55 |
|
|
11/19/99 8:35 am |
9193.15 |
86.06 |
|
|
11/19/99 2:55 pm |
14550.11 |
104.58 |
No samples collected from MVO-5, -7 and -8 on 11/17/99.
Soil Gas Data Collected During Ozone Injection
for the Lynntech Soil Ozone Technology Demonstration
|
ID |
Date |
PCE |
TCE |
|
MVO2 |
2/2/00 |
4082.12 |
107.05 |
|
2/9/00 |
117.85 |
2.97 |
|
|
2/15/00 |
2674.57 |
64.51 |
|
|
2/23/00 |
1746.56 |
52.64 |
|
|
2/29/00 |
353.11 |
14.20 |
|
|
MVO3 |
2/2/00 |
894.28 |
49.92 |
|
2/9/00 |
15.40 |
1.24 |
|
|
2/15/00 |
378.56 |
50.47 |
|
|
2/23/00 |
384.01 |
40.13 |
|
|
2/29/00 |
190.58 |
11.61 |
|
|
MVO4 |
2/2/00 |
2657.11 |
144.29 |
|
2/15/00 |
2055.36 |
116.20 |
|
|
2/23/00 |
1452.83 |
81.11 |
|
|
2/29/00 |
208.13 |
10.96 |
|
|
MVO5 |
2/2/00 |
242.10 |
64.02 |
|
2/9/00 |
11.86 |
56.29 |
|
|
2/15/00 |
28.86 |
15.23 |
|
|
2/23/00 |
16.92 |
5.08 |
|
|
2/29/00 |
65.03 |
5.29 |
|
|
MVO6 |
2/2/00 |
70.35 |
34.15 |
|
2/9/00 |
4.92 |
36.70 |
|
|
2/15/00 |
26.30 |
14.78 |
|
|
2/29/00 |
45.01 |
No data |
|
|
MVO7 |
2/2/00 |
322.64 |
103.90 |
|
2/9/00 |
21.13 |
35.60 |
|
|
2/15/00 |
19.85 |
5.93 |
|
|
2/23/00 |
21.65 |
2.58 |
|
|
2/29/00 |
43.44 |
2.14 |
|
|
MVO8 |
2/23/00 |
7059.73 |
217.33 |
|
MVO-ALL |
2/1/00 |
2777.46 |
128.12 |
|
2/2/00 |
2804.47 |
98.12 |
|
|
2/7/00 |
1820.37 |
68.71 |
|
|
2/8/00 |
775.96 |
32.95 |
|
|
2/10/00 |
1954.61 |
77.95 |
|
|
2/14/00 |
1768.00 |
75.72 |
|
|
2/16/00 |
2171.44 |
89.98 |
|
|
2/17/00 |
2008.67 |
86.24 |
|
|
2/22/00 |
1558.04 |
61.26 |
|
|
2/23/00 |
1380.82 |
54.53 |
|
|
2/24/00 |
807.79 |
36.62 |
|
|
2/29/00 |
34.80 |
1.35 |
MVO-ALL = the SVEU is pulling on all three extraction wells simultaneously (MVO2, -3, and -4)
Soil Gas Data Collected From 782-6M SVEU
During Ozone Injection
for the Lynntech Soil Ozone Technology Demonstration
|
ID |
Date |
PCE |
TCE |
|
782-6M-CIP |
2/2/00 |
1029.58 |
44.43 |
|
2/8/00 |
413.57 |
18.57 |
|
|
2/15/00 |
480.71 |
20.11 |
|
|
2/22/00 |
502.83 |
20.88 |
|
|
2/29/00 |
454.85 |
20.52 |
|
|
782-6M-WH |
2/3/00 |
2564.40 |
88.05 |
Note: CIP = Catox Inlet Pump, WH = Wellhead
Appendix B
Sampling and Analysis Methods
Sediment Samples
Once the core was brought to the surface, a 2 cc plug sample was collected using a modified plastic syringe. The plug was transferred to a 22 ml vial containing 5 ml of nano-pure water and the vial was sealed with a crimped septum top for later head space analysis. Duplicate samples were collected at each depth and all samples were stored at 4°C until analysis.
Each sample was weighed and then analyzed on the HP 5890 Series gas chromatograph using an automated head space sampler for equivalent water concentrations. Mass soil concentrations (ppb, m g/kg) were calculated based on an equal head space volume from 7.5 ml of water standards and approximately 7.5 ml of water/soil matrix and were corrected for the mass difference between the soil and water. The gas chromatograph was calibrated using certified solvent mixtures in methanol diluted to specific concentrations. The standard concentrations used for each head space sample run were 3, 5, 10, 50, 250, 500, and 1,000 ppb (m g/l). The samples were analyzed for TCE and PCE.
Soil Gas Samples
Vapor samples are obtained from extraction process equipment, directly at the well head, or during CPT pushes. Samples are typically obtained using Teflon vacuum pumps and collected in 1 liter Tedlar bags for on-site analysis using gas chromatography. Prior to collecting the sample, all collection lines, pump, and sample bags are purged with soil gas for an adequate time to ensure that a representative sample is obtained (Typically from 10 to 15 minutes). Bags are filled and purged three times prior to collecting the volume to be analyzed. The Tedlar bags have both a stainless steel valve for filling and purging and a septum port for extracting volumetric aliquots to be analyzed.
In addition to off-line sampling, a split stream from the pump effluent may also be directed into an on-line analytical instrument, typically a Bruel & Kjaer (B&K) photo-acoustic infrared detector. The B&K is allowed to cycle 3 to 5 times to purge the sampling system between sampling depths/locations. This validation step helps to insure a representative soil gas sample is collected by allowing contaminant concentrations to reach a steady state and by using CO2 as an indicator of soil gas. This method reduces the problem of inaccurate soil gas measurements due to leaking sample lines and non-steady-state values. Soil gas CO2 levels are orders of magnitude higher than ambient CO2 levels and are correlated to contaminant concentrations since the CO2 is produced by biological oxidation of carbon (contaminants). Once the samples are validated with the B&K, the sample bags will be purged with soil gas three times, filled with approximately one liter of gas, and taken to the lab for analysis.
The Tedlar bag samples are stored away from light at constant temperature and analyzed within 4 hours of sampling to avoid sample loss or degradation. Each sample is analyzed on the HP 5890 Series II or the SRI 8610 gas chromatograph (GC) using direct injection. The GC is calibrated using certified gas standards containing the compounds of interest (TCE and PCE) at typical concentrations of 1, 10, 100, 500, and 1000 ppmv and laboratory air blanks.
The B&K Model 1302 gas monitor is used to measure the soil gas for TCE, PCE, and CO2 before sample collection and for continuous monitoring of operating systems. The B&K 1302 uses a photo-acoustic infrared detector with select optical windows for speciation.