WSRC-RP-99-00513, Rev. 1
Site Selection for the Salt Disposition Facility
at the Savannah River Site
J. B. Gladden, K. J. Rueter, and J. P. Morin
Westinghouse Savannah River Company
Aiken, SC 29808
This report was prepared as an account of work sponsored by an agency of the United States Government. Neither the United States Government nor any agency thereof, nor any of their employees, makes any warranty, express or implied, or assumes any legal liability or responsibility for the accuracy, completeness, or usefulness of any information, apparatus, product or process disclosed, or represents that its use would not infringe privately owned rights. Reference herein to any specific commercial product, process or service by trade name, trademark, manufacturer, or otherwise does not necessarily constitute or imply its endorsement, recommendation, or favoring by the United States Government or any agency thereof. The views and opinions of authors expressed herein do not necessarily state or reflect those of the United States Government or any agency thereof.
This report has been reproduced directly from the best available copy.
Available for sale to the public, in paper, from: U.S. Department of Commerce, National Technical Information Service, 5285 Port Royal Road, Springfield, VA 22161, phone: (800) 553-6847, fax: (703) 605-6900, email: orders@ntis.fedworld.gov online ordering: http://www.ntis.gov/support/ordering.htm
Available electronically at http://www.osti.gov/bridge/
Available for a processing fee to U.S. Department of Energy and its contractors, in paper, from: U.S. Department of Energy, Office of Scientific and Technical Information, P.O. Box 62, Oak Ridge, TN 37831-0062, phone: (865 ) 576-8401, fax: (865) 576-5728, email: reports@adonis.osti.gov
List of Acronyms
Executive Summary
A site selection study was conducted to identify a suitable location for the construction and operation of a new Salt Disposition Facility (SDF) at the Savannah River Site (SRS). The facility to be sited is a single processing facility and support buildings that could house either of two three technology alternatives recommended being developed by the High Level Waste Systems Engineering Team: Small Tank Tetraphenylborate Precipitation, or Crystalline Silicotitanate Non-Elutable Ion Exchange or Cauatic Side Solvent Extraction. A fourththird alternative, Direct Disposal in Grout, is not part of this site selection study because a site location has been identified that is unique to this technology (i.e. Z-Area).
Facility site selection at SRS is a formal, documented process which seeks to optimize siting of new facilities with respect to facility-specific engineering requirements, sensitive environmental resources, and applicable regulatory requirements. In this manner, the prime objectives of cost minimization, environmental protection, and regulatory compliance are achieved.
Siting of the SDF was constrained by an operational requirement that the facility be near the high level waste processing facilities. This constraint, in addition to selected exclusion criteria which represented factors that could preclude or delay construction, was utilized to identify the general area in which the SDF could be constructed. The resulting ‘region of opportunity’ encompassed significant portions of existing operating areas, which are located near the center of SRS. Preliminary review of this region identified 13 areas that possessed sufficient acreage to accommodate the proposed SDF. Subsequent evaluation of these areas identified four leading candidate sites that were believed to be the most suitable for the facility.
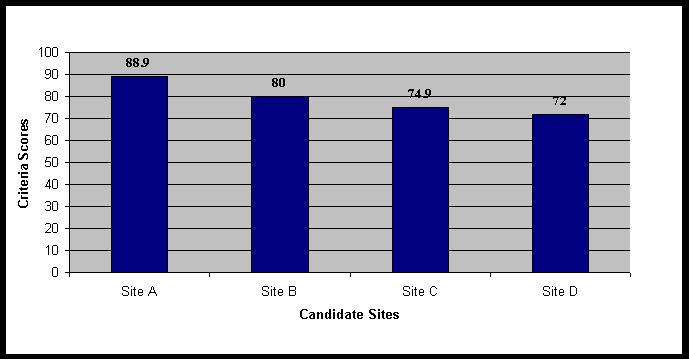
A comparative analysis of the four sites was performed, using ecological, human health, geoscience, and engineering criteria. Sites A and B were ranked the highest (88.9 and 80.0, respectively), followed by Site C (74.9) and Site D (72.0). A subsequent sensitivity analysis demonstrated that the ranking process used was robust and that the relative ranking of sites was still valid even if critical parameters used in the analysis were varied. The Site Selection Panel therefore recommended that further geotechnical characterization be conducted on Sites A and B, respectively. Subsequent to the initial analysis, additional information was received that excluded Site A from further consideration. As a consequence geotechnical characterization was performed on Site B only.
The results from this geotechnical characterization indicated that continued consideration be given to Site B for the proposed Salt Disposition Facility. Suitable topography, the lack of surface hydrology and floodplain issues, no significant groundwater contamination, the presence of minor soft zones along the northeast portion of footprint and no apparent geological structure in the Gordon Aquitard support this recommendation.
1.0 Introduction
The purpose of this report is to identify, assess and rank potential sites for the proposed Salt Disposition Facility (SDF) at the Savannah River Site (SRS). The objectives for this site selection effort were to ensure:
1.1 History of SDF
During the In Tank Precipitation (ITP) facility startup in 1998, higher-than-predicted benzene releases occurred, and a program was initiated to further investigate process chemistry issues. The program concluded that the benzene release rates associated with ITP operation could exceed the capability of the current plant hardware/systems. WSRC informed DOE that the present system configuration could not meet the safety and production requirements for the ITP facility and recommended that a study of alternatives to the current system configuration be conducted by a Systems Engineering team. In March 1998, a WSRC-sponsored High Level Waste Systems Engineering Team was formed to study alternatives to the ITP process as well as methods to enhance the existing process. This multi-disciplinary team was chartered with the task of "systematically developing and recommending an alternative method and/or technology for disposition of HLW salt". The High Level Waste Systems Engineering Team recommended the Small Tank Tetraphenylborate (TPB) Precipitation technology as the primary technology for deployment and Crystalline Silicotitanate (CST) Non-Elutable Ion Exchange as the backup technology. Details of the history of the SDF engineering study can be found in the High Level Waste Salt Disposition Systems Engineering Team, Final Report (WSRC 1998). The Department of Energy’s decision was to pursue additional evaluation of three technologies: Direct Disposal in Grout, CST Non-Elutable Ion Exchange, and Small Tank TPB Precipitation. Later, at the requestof the DOE, Caustic Side Solvent Extraction was added to the list of technologies to be evaluated.
1.2 Synopsis of Site Selection Process
The site selection method utilized a simple decision-making process based on Nominal Group, Delphi and Decision Analysis techniques (Howard and Matheson 1968; Wike 1995). A panel of subject matter experts knowledgeable in the areas of facility engineering, regulatory compliance (NEPA) and environmental sciences implemented this process.
A listing of panel members and their organizational affiliations is as follows:
Following the delineation of potential SDF locations within the areas of interest (see Figure 1), the panel identified the most suitable locations for project implementation. These locations were numerically ranked using a system of mutually agreed upon scoring categories that were weighted according to their relative importance. Based upon this ranking, preferred and alternative locations were designated. Prior to completion of the NEPA process and issuance of a Record of Decision (ROD), these locations will undergo a geotechnical examination to ensure their suitability for construction and operation of the SDF (detailed description of the site selection process utilized can be found in Sections 3.0 and 4.0).
2.0 Facility Description and Site Configuration
The technical requirements of the Caustic Side Solvent Extraction alternative are enveloped by the requirements of CST Non-Elutable Ion Exchange, therefore fFor purposes of the SDF siting study, only two ITP technology alternatives were considered: Small Tank Tetraphenylborate (TPB) Precipitation and Crystalline Silicotitanate (CST) Non-Elutable Ion Exchange. Implementation of either of these technologies would require the construction and operation of a new, shielded treatment facility and associated support facilities (i.e. administrative buildings). SDF would utilize existing infrastructure within the host area (i.e. power, steam, domestic water, waste treatment). A third fourth alternative, Direct Disposal in Grout, is not part of this site selection study because a site location has been identified that is unique to this technology (i.e. Z-Area).
2.1 Small Tank TPB Precipitation
In tThis technology alternative would use the same chemicals as the existing ITP batch process, but would operate continuously in smaller tanks rather than in an ITP batch mode h. High-level liquid waste would undergo precipitation within continuously stirred tank reactors to separate the high-activity waste fraction from the low-activity fraction. Strontium, uranium, and plutonium would be adsorbed on monosodium titanate (MST) and cesium would be precipitated with sodium tetraphenylborate. The high-activity fraction (adsorbed radionuclides and precipitate) would undergo hydrolysis. The resulting precipitate hydrolysis aqueous would be processed and vitrified in the Defense Waste Processing Facility (DWPF) and the organic waste (mainly benzene) would be disposed of by incineration. The low-activity fraction would be processed and solidified in the Saltstone Facility and disposed of in the SRS saltstone vaults located in Z-Area. Benefits associated with this alternative are (a) reduced inventory of flammable material and (b) reduced benzene generation due to reduced cycle time and improved mixing and cooling processes.
2.2 CST Resin Ion Exchange
In this technology alternative, high-level liquid waste would first be mixed with MST and filtered to remove adsorbed uranium, plutonium and strontium. Crystalline silicotitanate (CST) resin ion exchange columns would be utilized to remove cesium from the salt solution. The high-activity fraction (adsorbed radionuclides and cesium-bearing resins) would be vitrified in the DWPF. Low-activity material would be solidified in the Saltstone Facility and disposed of in the SRS saltstone vaults in Z-Area. The merits of this alternative process include (a) the use of non-hazardous inorganic reagent, (b) high efficiency cesium removal and (c) elimination of the DWPF salt cell operation.
2.3 Caustic Side Solvent Extraction
In this technology alternative, high-level liquid waste would first be mixed with MST and filtered to remove adsorbed uranium, plutonium and strontium. An organic solvent would extract Cesium from the salt solution in a series of centrifugal contactors. The Cesium, in turn, would be stripped from the solvent into an aqueous raffinate, again using centrifugal contactors. The high-activity fraction (adsorbed radionuclides and cesium-bearing raffinate) would be vitrified in the DWPF. Low-activity material would be solidified in the Saltstone Facility and disposed of in the SRS saltstone vaults in Z-Area.
2.43 SDF-Specific Technical Requirements
The SDF technical requirements, which served as limiting variables in the site selection process, are listed below.
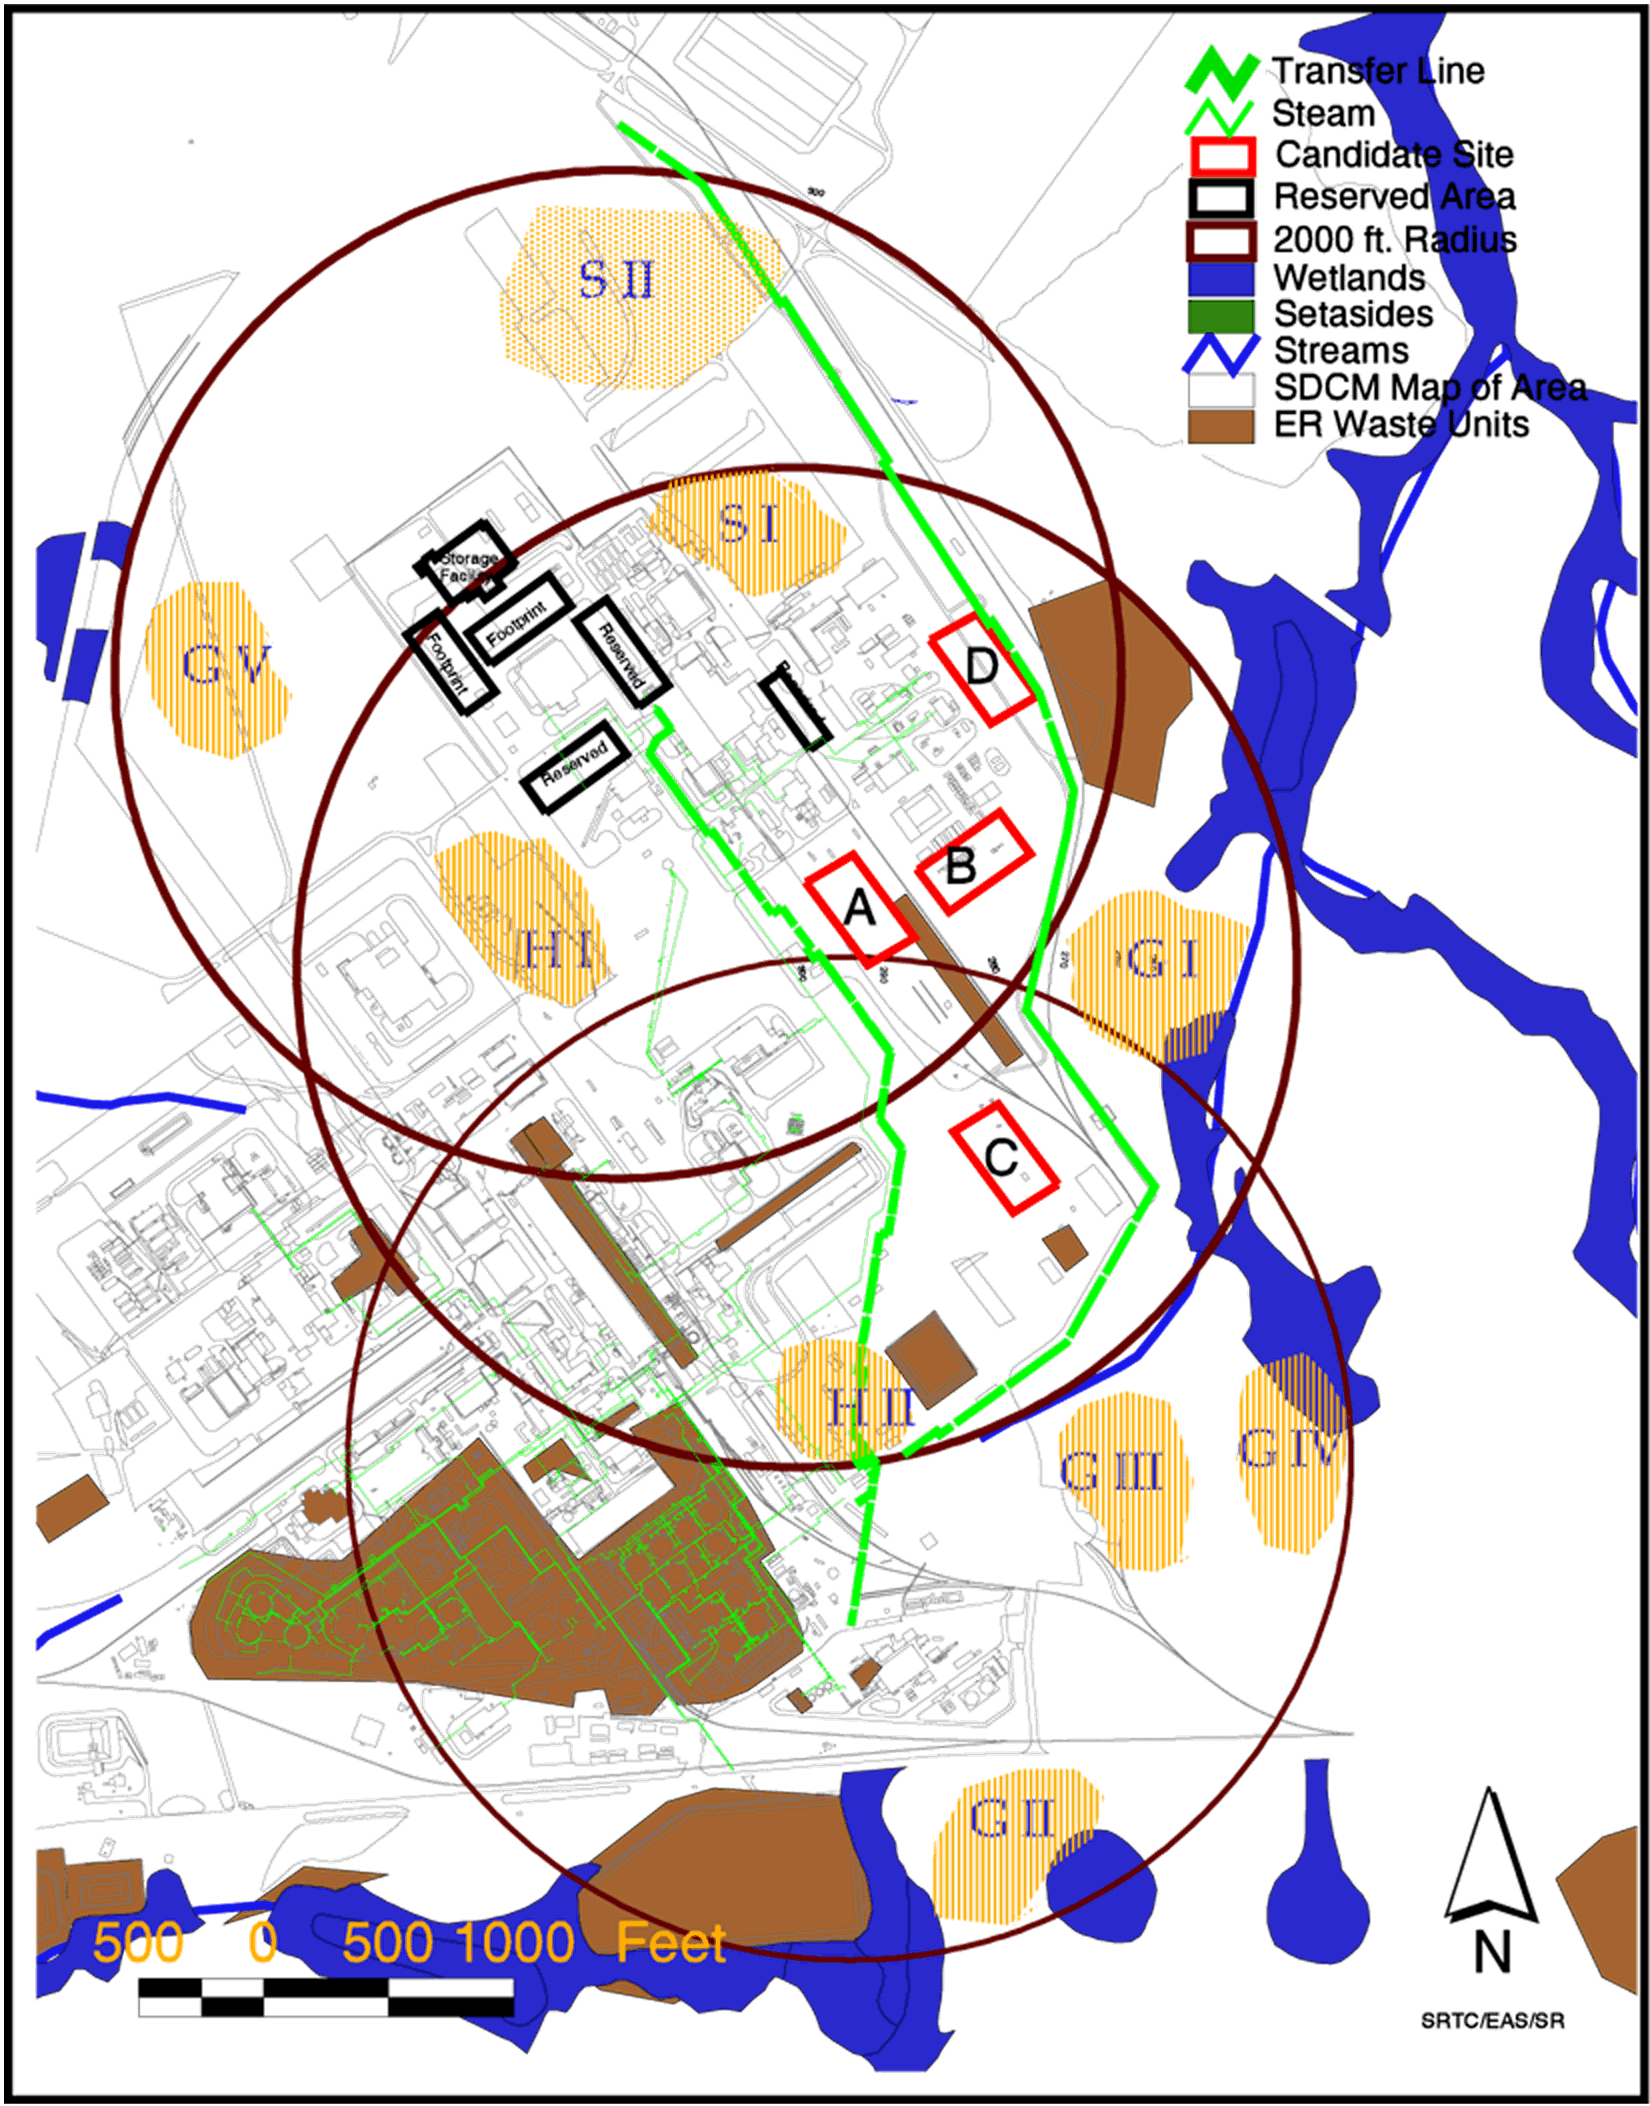
Figure 1. Map indicating the general area for candidate SDF
locations,
GI, GII, GIII, GIV, GV, HI, HII, SI and SII.
3.0 Site Selection Process for SDF
3.1 Determination of Exclusion Criteria
The first step in the site selection process was the creation of exclusion criteria to serve as an initial screen for locating potential development locations. The use of exclusion criteria ensures that the SDF will not be located in areas where it could (a) adversely impact critical SRS environmental resources, (b) present a threat to human health (both on- and offsite populations) or (c) be exposed to known physical hazards and/or regulatory risks. The use of exclusion criteria should minimize the potential for project-related environmental impacts, thereby diminishing the need for significant mitigation measures. Following is a list of exclusion criteria applied during the SDF siting process.
3.2 Identification of Potential SDF Development Locations
The project-specific technical requirements (see Section 2.3) effectively limited the SDF site selection process to H- or S-Areas. These areas, which are highly industrialized zones, are located near the center of SRS, a significant distance from the site boundary or any public access highway. Initial review of H- and S-Areas resulted in the identification of 13 potential locations, which met SDF-specific technical requirements and satisfied the exclusion criteria (see Figure 1). Further review by the panel, using "best professional judgement", resulted in the identification of four candidate sites most suitable for construction and operation of the SDF (A, B, C and D, respectively: see Figure 1).
3.3 Description of Candidate SDF Development Sites
Figure 1 illustrates the relative locations of these sites within H- and S-Areas. Water table elevations, topography and direction of surface drainage and depth-to-groundwater in the areas of these sites are shown in Appendix A.
Proposed Site A
Site A is located approximately 650 feet southeast of the DWPF and approximately 200 feet eastward from the Low Point Pump Pit. The overall orientation of the site trends northwest approximately aligned with SRS north. Historically, the site was used as a laydown area during the construction of the DWPF in S-Area. The site is situated along a previously existing topographic high, which is underlain by sediments of the Upland Unit. Surficial soils are generally Udorthents (disturbed, Rogers 1990).
Proposed Site B
Site B is located approximately 950 feet east-southeast of the DWPF and approximately 650 feet eastward from the Low Point Pump Pit. The overall orientation of the site trends west-southwest. Historically, the site was used as a laydown area during the construction of the DWPF in S-Area. The site is situated along an eastward slope of a previously existing topographic high, which is underlain by sediments of the Upland Unit. Surficial soils are generally Udorthents (disturbed) or soils of the Blanton and Fuquay Groups.
Proposed Site C
Site C is located approximately 1800 feet southeast of the DWPF and approximately 900 feet southeast from the Low Point Pump Pit. The overall orientation of the site trends northwest approximately aligned with SRS north. Historically, the site was used as a concrete batching area during the construction of the DWPF in S-Area. The site is situated along the southern flank of a topographic high, which is underlain by sediments of the Upland Unit. The southernmost portion of the site has been modified by the addition of backfill to construct a level site. Surficial soils are generally Udorthents (disturbed) or soils of the Blanton and Fuquay Groups.
Proposed Site D
Site D is located approximately 900 feet east of the DWPF and approximately 1200 feet northeast from the Low Point Pump Pit. The overall orientation of the site trends northwest approximately aligned with SRS north. Currently, the site is grassed and contains a perimeter roadway and Z-Area transfer line. The site is situated along the eastern flank of a topographic high, which is underlain by sediments of the Upland Unit. The central portions of the site have been modified by the addition of backfill to construct a level roadway. Surficial soils are generally Udorthents (disturbed) or soils of the Blanton and Fuquay Series.
3.4 Numerical Ranking of Potential SDF Sites, A, B, C and D
The ranking of the four candidate SDF sites was based upon a numerical scoring system, which incorporated the following general categories: ecology, human health, geoscience and engineering (Wike 1995). Subcategories were added to each of the categories to enhance the sensitivity of the ranking process. The four categories were assigned relative weights based upon the simple premise that the more important categories received greater weights. These weights were assigned with the mathematical restriction that they must sum to 100. The weighting of subcategories was accomplished in the same fashion. The site selection panel made the determination of categories and subcategories and their associated weighting factors through panel consensus using engineering factors and best professional judgement. The numerical scoring system can be found in Table 1.
3.5 Sensitivity Analyses of Site Selection Process
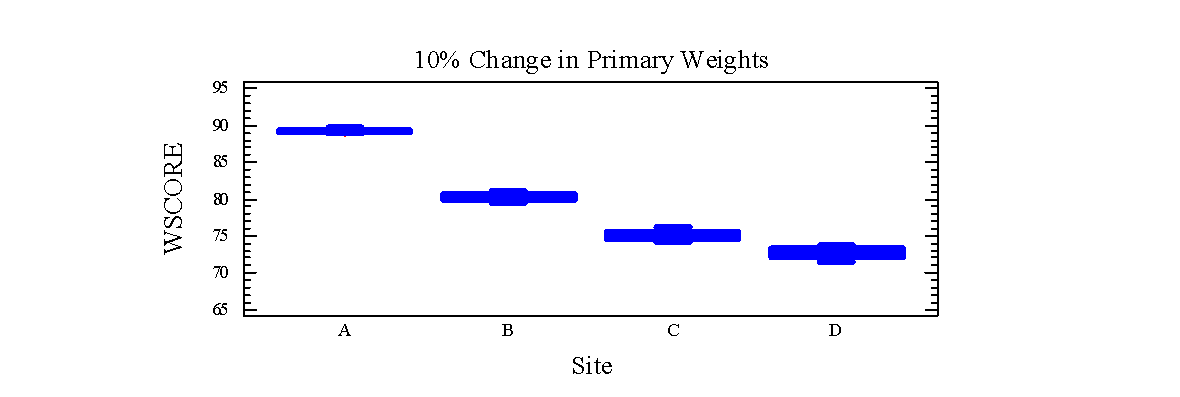
Sensitivity analyses were executed to test for any biases associated with the site selection process. Three components of the whole process were examined, the location selections for the SDF relative to design specifications, the weighting of the four major categories and the degree of influence of each of the four major categories by their removal from the process. A full explaination of all three test analyses is found in Appendix B.
Initially, the search for site locations was focused within a 2000-ft. radius circle centered at the Low Point Pump Pit as a design specification for the effectiveness of material transport. Additional circles of the same radius were then positioned at the Late Wash Facility and the south end of DWPF. Within the area covered by the three 2000-ft. circles, 13 locations were identified as potential locations for the SDF (Figure 1). Additional review by the panel resulted in the identification of four candidate sites based on best professional judgement of environmental, engineering, and constructability factors (see Table B-1).
A second sensitivity assessment was done by randomly varying the weights of the four major categories while standardizing the weights to a sum of 100 and not varying the subcategories, and then comparing the total and range of scores for Sites A, B, C and D (Figure B-2; Harris 1999). Varying the category weights up to a maximum of 40 percent did not result in overlap of the ranges of scores for Site A with any of the other sites. For Site B this same 40 percent variation produced noticeable overlap with Sites C and D, but did not result in overlap with Site A. The minimum variation of 10 percent produced overlap between Sites C and D because of the equalness of scores between them. Therefore, under all of test scenarios Site A was concluded to be the preferred site. Site B indicated no substantial overlap with Sites C and D until the 40 percent variation was applied.
Sensitivity to category exclusion was tested by scoring only three categories at a time and leaving one category out for all possible combinations of the four categories. The test scores were then summed for all these combinations of three. Site A always achieved the highest score while Site B always had the second highest score. This test procedure only altered the relative rankings of Sites C and D. Therefore, no single category of the analysis had a significant influence on the panel’s recommendation to initiate further characterization of Sites A and B.
Table 1. General categories and their assigned subcategories with their respective weights.
|
Category |
Weight |
Subcategory |
Weight |
|
Ecology |
15 |
Terrestrial |
20 |
|
Wetlands |
40 |
||
|
Aquatic |
40 |
||
|
Human Health |
20 |
Risk to Offsite Population |
30 |
|
Effect on SDF Workers from Nearby Facilities |
30 |
||
|
Effect of SDF on Workers in Nearby Facilities |
30 |
||
|
Emergency Response/Preparedness |
10 |
||
|
Geoscience |
30 |
Topography |
15 |
|
Surface Hydrology |
15 |
||
|
Subsurface Hydrology |
30 |
||
|
Geology |
30 |
||
|
Seismology |
10 |
||
|
Engineering |
35 |
Distance to the Waste Transfer Line From Late Wash to the Low Point Pump Pit (SDF Feed) |
10 |
|
Distance to the Decontaminated Salt Solution Transfer Line |
10 |
||
|
Sharing Existing Infrastructure |
10 |
||
|
Distance to the LPPP |
25 |
||
|
Disruption to Existing Infrastructure/ Utilities |
10 |
||
|
Access to Utilities |
10 |
||
|
Sanitary Plant Tie-In |
2 |
||
|
Distance to an Existing NPDES Discharge Point |
3 |
||
|
Construction Site Suitability |
15 |
||
|
Primary Road and Rail Proximity |
3 |
||
|
Archaeology |
2 |
4.0 Comparative Evaluation of Candidate Sites
4.1 Rationales for Scoring Categories and Subcategories
4.1.1 Ecology
The SRS has many sensitive ecological features including areas where plants and animals of concern are found, endangered species and their management areas, pristine headwater streams, wetlands and ecological research set-aside areas. All of these aspects of the ecological resources must be considered in siting any project because they can be expensive or impossible to remediate if not properly considered and can cause cost and scheduling difficulties.
4.1.2 Human Health
Human health considerations include radiological effects and emergency preparedness. Radiological considerations for accidents include off-site risk, potential effect on SRS workers from the proposed facility, and effect from existing facilities on workers at the proposed facility.
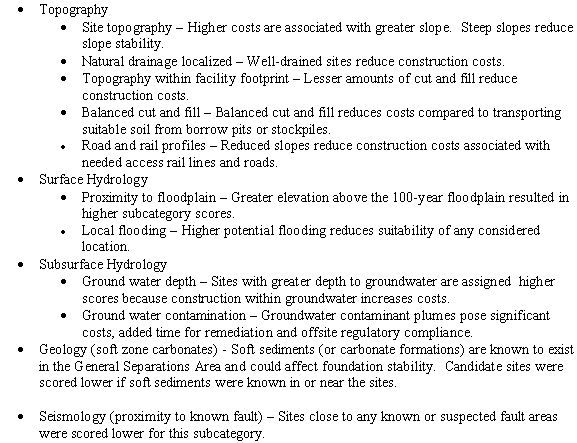
4.1.3 Geoscience
Potential Salt Disposition Facility Sites A, B, C, and D were evaluated using the geoscience subcategories defined below. The geoscience subcategories were evaluated utilizing data from regional monitoring wells, historical geotechnical and geological borings, historical cone penetrometer test soundings, and regional knowledge.
Rationales for each of the geoscience scoring subcategories are offered briefly below. Appendix C lists the complete detailed scoring methods and justifications.
4.1.4 Engineering
Rationales for the engineering subcategory are given below for candidate sites A, B, C and D. These subcategories focus on engineering requirements for the SDF, cost issues during the construction and operation of the SDF and its integration with other facilities in the area.A more complete discussion of the engineering scoring for each of the subcategories can be found in Appendix D.
4.2 Scoring of Candidate Sites
Applying the subcategory rationales for scoring, the site selection panel assigned scores during a series of meetings exercising best professional judgement. Although scores did change during these discussions a final consensus was reached for all subcategories and are shown below in Table 2.
4.2.1 Ecology
The evaluation of the four candidate SDF sites in the Ecology category was based on the potential to adversely impact valuable resources in the areas of Terrestrial, Wetlands and Aquatic Ecology.
4.2.1.1 Site A
Site A ranked first in all of the subcategories, Terrestrial Ecology, Wetlands Ecology and Aquatic Ecology, by scoring respectively, perfect scores of 20, 40 and 40 points for a total raw score of 100 points. In Terrestrial Ecology all of the four sites scored the maximum because no site contained any kind of salvageable timber or habitat for any organisms other than those that would be expected within an urban landscape (Mayer and Wike 1998). Site A was given a maximum score in the Wetlands subcategory because it is the greatest distance from any wetland area thus posing the least threat for impacts during construction and operation of the facility. Potential for impact based on distance to the nearest tributary of Upper Three Runs was used to rank the four candidate sites for the Aquatic Ecology subcategory. Site A was given maximum points because it is the greatest distance to the nearest tributary of the four sites evaluated.
4.2.1.2 Site B
Site B had a total raw score of 90 points and ranked second among the four sites. Site B was given a score of 35 in the Wetlands subcategory, intermediate between the scores for Sites A, and C and D because it is intermediate in distance to the local wetland areas. Due to Site B’s intermediate distance to the nearest tributary of Upper Three Runs, its score of 35 points reflects this intermediate distance when compared with Sites A and D.
4.2.1.3 Site C
Site C scored last among the four sites with a total raw score of 75 points. This was chiefly due to its low score of 25 points in the Aquatic Ecology subcategory. Site C was given 30 points in the Wetlands subcategory because it is closer to wetlands, thus increasing the potential for impact. Site C was not given a greater deduction because, even though it is close to wetlands, the possibility for impact is not extreme. In the Aquatic Ecology subcategory, Site C is the closest distance to the nearest tributary of Upper Three Runs, but the potential for impact is not severe and it was scored with 25 points.
4.2.1.4 Site D
The total raw score of 80 points placed Site D third among of the four sites, 10 points below Site B, and only 5 points higher that Site C. Site D was given 30 points in the Wetlands subcategory because the site is closer to wetlands than Sites A and B, thus increasing the potential for impact. In the Aquatic Ecology subcategory, Site D scored third with 30 points, behind Site A having a perfect 40 points and Site B with 35 points, due only to the distance to the nearest tributary of Upper Three Runs.
4.2.2 Human Health
The evaluation of factors potentially affecting human health was based on the consequences of a radiological release from the SDF at the proposed location to either offsite populations or workers at the nearest onsite facility, or the consequences of a release from a nearby facility on workers at the SDF (Simpkins 1999). These analyses were based on calculations of the relative doses associated with the events, which is a function of the proximity of other facilities, the potential releases associated with those facilities, and prevailing wind directions at the SRS. Evaluations of the suitability of the four sites with respect to emergency preparedness considerations was based on evaluation of aerial photography and ground-level analyses of the relative ease of access to, and egress from, the SDF during emergency conditions.
4.2.2.1 Site A
The location of the proposed SDF Site A near the center of the SRS resulted in maximum score for risk to offsite populations. Site A scored 29 of a possible 30 points for risk to the SDF worker because of its proximity to DWPF. Similarly, Site A received 27 of a possible 30 points for risk to workers in nearby facilities because of its relative central location within H- and S-Areas relative to the other three Sites evaluated. Site A was also downgraded in emergency response scoring because of its proximity to the Low Point Pump Pit (worker safety) and because the perimeter fence between Site A and S Area will result in a single direction of access and egress in the event that emergency access or evacuation are required. The total raw score for Site A was 93 and was the lowest score awarded for the Human Health category among the four sites evaluated.
4.2.2.2 Site B
The location of the proposed SDF Site B near the center of the SRS resulted in maximum score (30) for risk to offsite populations. Site B received the same score as Sites A and D (29) for potential effects of releases from nearby facilities on SDF workers because of its relatively central location within the cluster of facilities in H- and S-Areas. This site received a slightly higher score (28) for potential effects of SDF releases on workers at other facilities because of its slightly greater distance from other facilities than Site A. Site B received the maximum score for emergency preparedness because multiple means of access and egress would be available. The total raw score for Site B was 97 and equaled the score for Site D.
4.2.2.3 Site C
The location of the proposed SDF Site C near the center of the SRS resulted in maximum score (30) for risk to offsite populations. Site C received the maximum score (30) for potential effect of releases from nearby facilities on SDF workers because of its relatively great distance from other facilities in the general area. Similarly, it received the maximum score (30) for potential effects of releases from SDF on workers in nearby facilities for the same reasons. Site C received the maximum score (10) for emergency preparedness because multiple means of access and egress would be available. The total raw score for Site C was 100 and was the highest score awarded in the Human Health category for the four sites evaluated.
4.2.2.4 Site D
The location of the proposed SDF Site D near the center of the SRS resulted in maximum score (30) for risk to offsite populations. Site D received the same score as Site A and B (29) for potential effects of releases from nearby facilities on SDF workers because of its relatively central location within the cluster of facilities in H- and S-Areas. This site received a slightly higher score (28) than Site A for potential effects of SDF releases on workers at other facilities because of its slightly greater distance from other facilities. Site C received the maximum score (10) for emergency preparedness because multiple means of access and egress would be available. The total raw score for Site D was 97 and equaled the score for Site B.
4.2.3 Geosciences
The Geosciences category was evaluated within five major areas of consideration: topography, surface hydrology, subsurface hydrology, geology and seismology. Appendix C details the subcategory rationales for scoring and the subcategory scoring results.
4.2.3.1 Site A
The overall topography for Site A has been graded flat due to historical construction in the area. Locally, there are small areas that drain less quickly than other areas but the natural drainage at the facility footprint is good. Since the area is flat, there are no fill requirements. There are no road or rail profiles of any consequence. Site A does not lie within the 100 year floodplain nor has there been localized flooding. The groundwater depth at Site A is approximately 40 feet, fluctuating between 38 and approximately 41 feet. The Site A footprint is hydrogeologically downgradient from potential plumes emanating from the H-Canyon area. There are no known soft zone carbonates underlying the footprint, based on existing subsurface data, but soft zones and carbonates have been mapped within S-Area. There are no known faults within one-half mile of the footprint that disrupt the Gordon Aquitard. Site A was assigned a total raw score of 84 points relative to the findings above and the other candidate sites. Subsurface hydrology and geology were the determining subcategories that gave Site A the highest total score (84).
4.2.3.2 Site B
Site B has a minor slope dipping eastward towards a tributary of McQueen Branch. Locally, there are small areas that drain less quickly than other areas, but the natural drainage at the facility footprint is generally good. However, preferred drainage paths have been noted. Because of the minor slope, the cut and fill requirements are minimal. There are no road or rail profiles of any consequence. Site B does not lie within the 100-year floodplain nor has there been localized flooding. The groundwater depth at Site B is approximately 36 feet, fluctuating between 34 and approximately 38 feet. The site is hydrogeologically downgradient from potential contaminants emanating from the H Canyon and sandblast areas. Elevated levels of tritium and possibly trichloroethylene (TCE) have been noted historically in monitoring well SBG-4, immediately adjacent to the footprint. There are no verified soft zone carbonates underlying the footprint but carbonate zones have been mapped within S-Area resulting in a reasonable possibility that they occur at Site B. There are no verified faults within one-half mile of the footprint that disrupt the Gordon Aquitard. Site B with a total raw score of 67 scored slightly lower than Site D due to a lower score in the subsurface hydrology subcategory.
4.2.3.3 Site C
The overall topography for Site C has been graded flat due to historical construction in the area. Locally, there are small areas that drain less quickly than other areas but the natural drainage at the facility footprint is good. Since the area is flat, there are no fill requirements. There are no road or rail profiles of any consequence. Site C does not lie within the 100-year floodplain nor has there been localized flooding. The groundwater depth at Site C is approximately 20 feet, fluctuating between 18 and approximately 21 feet. The Site C footprint is hydrogeologically downgradient from potential plumes emanating from the H-Area Coalpile Runoff Basin. There are no verified soft zone carbonates underlying the footprint but soft zones and carbonates have been mapped within 100 yards of the footprint resulting in a high possibility that they occur at Site C. There are no verified faults within one-half mile of the footprint that disrupt the Gordon Aquitard.
Site C received the lowest category total raw score of 60 due to the potential for softzone carbonates verified to be near this location. Additionally the low subcategory score for subsurface hydrology at Site C contributed to the low total raw score in Geoscience.
4.2.3.4 Site D
Site D has a slope dipping eastward towards a tributary of McQueen Branch containing a localized swale. Locally, there are small areas that drain less quickly than other areas but the natural drainage at the facility footprint is generally good. However, after heavy rains localized ponding has been noted. Because of the change in slope, the cut and fill requirements are greater than the other sites. There are no road or rail profiles of any consequence. Site D does not lie within the 100-year floodplain nor has there been localized flooding. The groundwater depth at Site D is approximately 29 feet, fluctuating between 28 and approximately 31 feet. The site is hydrogeologically downgradient from potential contaminants from the H Canyon and a former S-Area sandblast facility. There are no verified soft zone carbonates underlying the footprint but carbonate zones have been mapped within S-Area. There are no verified faults within one-half mile of the footprint that disrupt the Gordon Aquitard. The total raw score for Site D in Geoscience was 71, slightly higher than Site B, but lower than Site A.
4.2.4 Engineering
Scoring the Engineering category focused on critical distances of material transport and construction and operational suitabilities. Appendix D details the Engineering subcategory rationales and scoring results.
4.2.4.1 Site A
The total raw score of 86 for Site A was the highest of the four sites giving it the highest overall ranking for this engineering category. Site A was not ranked higher in any particular subcategory, rather Site A was consistently rated higher by a few points in those subcategories with the highest weightings. Looking at Table 2, which summarizes the complete scoring of the four sites, indicates this feature of the scoring results. Only in the subcategory, Distance to the Decontaminated Salt Solution Transfer Line, did Site A score more than a point below the highest of the sites.
4.2.4.2 Site B
Site B, with a total raw score of 77 points, scored second of the four sites, being ranked more closely with Site C than with Site A. Subcategory scorings were consistently just a few points lower than Site A in a number of subcategories which cumulatively resulted in a ranking beneath Site A. Good examples of these differences are the subcategories of Distance to the Line From Late Wash to the Low Point Pump Pit (SDF Feed), Sharing Existing Infrastructure and Construction Site Suitability. However, Site B did score higher than Site A in the subcategory, Distance to the Decontaminated Salt Solution Transfer Line.
4.2.4.3 Site C
Site C scored third overall with a total raw score of 73 points. Several subcategory scores were just slightly lower than Sites A and B which resulted in this raw score total. Site C scored the same as Site B in the subcategory, Distance to the Line From Late Wash to the Low Point Pump Pit (SDF Feed), but scored less than Site A. The subcategory, Sharing Existing Infrastructure, significantly separated Site C from Sites A and B. However, Site C did outscore or tie Sites A and B in the subcategories of Distance to the Decontaminated Salt Solution Transfer Line and Access to Utilities.
4.2.4.4 Site D
Having a total raw score of 55 points, Site D clearly scored the lowest of four sites due to significantly lower scores in those subcategories that had the higher weightings. Three subcategories stand out: Distance to the Line From Late Wash to the Low Point Pump Pit (SDF Feed), Sharing Existing Infrastructure and in the highest weighted subcategory, Distance to LPPP.
Table 2. Summary of scoring for proposed Sites A, B, C and D.
|
Category |
Weight |
Subcategory |
Weight |
Site A |
Site B |
Site C |
Site D |
|
Ecology |
15 |
||||||
|
Terrestrial |
20 |
20 |
20 |
20 |
20 |
||
|
Wetlands |
40 |
40 |
35 |
30 |
30 |
||
|
Aquatic |
40 |
40 |
35 |
25 |
30 |
||
|
Subcategory Total |
100 |
90 |
75 |
80 |
|||
|
Category Subtotal |
15.0 |
13.5 |
11.3 |
12.0 |
|||
|
Human Health |
20 |
||||||
|
Risk to Offsite Population |
30 |
30 |
30 |
30 |
30 |
||
|
Effect on SDF Workers from Nearby Facilities |
30 |
29 |
29 |
30 |
29 |
||
|
Effect of SDF on Workers in Nearby Facilities |
30 |
27 |
28 |
30 |
28 |
||
|
Emergency Response/Preparedness |
10 |
7 |
10 |
10 |
10 |
||
|
Subcategory Total |
93 |
97 |
100 |
97 |
|||
|
Category Subtotal |
18.6 |
19.4 |
20.0 |
19.4 |
|||
|
Geoscience |
30 |
||||||
|
Topography |
15 |
14 |
12 |
14 |
12 |
||
|
Surface Hydrology |
15 |
15 |
15 |
15 |
15 |
||
|
Subsurface Hydrology |
30 |
22 |
15 |
15 |
19 |
||
|
Geology (soft zone carbonates) |
30 |
23 |
15 |
6 |
15 |
||
|
Seismology (proximity to known fault) |
10 |
10 |
10 |
10 |
10 |
||
|
Subcategory Total |
84 |
67 |
60 |
71 |
|||
|
Category Subtotal |
25.2 |
20.1 |
18.0 |
21.3 |
|||
|
Engineering |
35 |
||||||
|
Distance to the Waste Transfer Line From Late Wash to the Low Point Pump Pit (SDF Feed) |
10 |
10 |
8 |
8 |
5 |
||
|
Distance to the Decontaminated Salt Solution Transfer Line |
10 |
6 |
9 |
9 |
10 |
||
|
Sharing Existing Infrastructure |
10 |
10 |
7 |
5 |
1 |
||
|
Distance to LPPP |
25 |
24 |
22 |
21 |
11 |
||
|
Disruption to Existing Infrastructure/Utilities |
10 |
5 |
5 |
5 |
5 |
||
|
Access to Utilities |
10 |
9 |
8 |
10 |
8 |
||
|
Sanitary Plant Tie-In |
2 |
2 |
1 |
0 |
1 |
||
|
Distance to an Existing NPDES Discharge Point |
3 |
3 |
3 |
1 |
2 |
||
|
Construction Site Suitability |
15 |
12 |
10 |
10 |
8 |
||
|
Primary Road and Rail Proximity |
3 |
3 |
2 |
3 |
2 |
||
|
Archaeology |
2 |
2 |
2 |
1 |
2 |
||
|
Subcategory Total |
86 |
77 |
73 |
55 |
|||
|
Category Subtotal |
30.1 |
27.0 |
25.6 |
19.3 |
|||
|
Total Scores |
88.9 |
80.0 |
74.9 |
72.0 |
5.0 Conclusions
5.1 Significance of Category-Level Scorings
The results of the scoring (Figure 2) indicated that the site selection panel
scored
Sites A and B over the other two sites having a total weighted score of 88.9
and 80.0 respectively with Sites C and D having total scores of 74.9 and 72.0.
In the ecological category, weighted subtotal scores favored Sites A (15.0)
and B (13.5) compared to Sites C (11.3) and D (12.0). Differences were small
between the four sites in the human health category and thus not very discriminatory.
The largest spread occurred between Site A with 18.6 points and Site C having
the maximum allowable score of 20 points. In the geosciences category Site A
scored highest with 25.2 points out of a possible maximum score of 30 points,
while Sites B and D scored third and second respectively with each having 20.1
and 21.3 points respectively. Site C scored lowest having 18.0 points. Engineering
category scores favored Site A with 30.1 points with Site B scoring second having
27.0 points. Site C scored 25.6 points, while Site D scored lowest of the four
sites having only 19.3 points.
Figure 2. Total scores for Sites A, B, C and D.
5.2 Characterization of Sites A and B
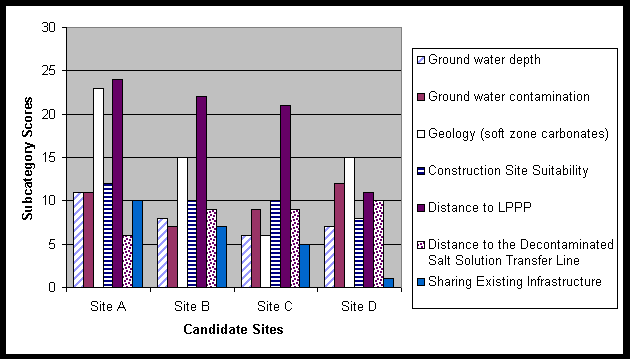
The site selection panel scored Sites A and B higher than Sites C and D. Although there were many subcategories in all of the major categories that were not so discriminatory, seven subcategories in the Geosciences and Engineering categories notably affected the overall scoring and preferences given to Sites A and B (Figure 3). These were subcategory scores where distinct differences were observed (Table 2). The scores for the geology and subsurface hydrogeology together strongly favored the suitability of Sites A and B over Sites C and D. Groundwater depth scores also favored Sites A and B. Scores for Construction Site Suitability clearly favored Site A, while separating Site D from sites B and C. Scores for the subcategory, Sharing Existing Infrastructure, declined continuously beginning with Site A and going to Site D. In the opposite fashion the subcategory, Distance to the Decontaminated Salt Solution Transfer Line, favored Site D somewhat over Sites B and C and clearly over Site A.
Figure 3. Raw scores for seven discriminatory subcategories that separated Sites A, B, C and D.
5.3 Final Recommendation of Sites A and B
The site selection process began with a set of SDF design criteria and a list of exclusion criteria that designated a general area where the SDF might be positioned in S and H-Areas. Subsequent creation of scoring categories and their respective subcategories provided a venue for exercise of best professional judgement by panel members. This selection process has chosen Sites A and B for further geological characterization over Sites C and D. Additional sensitivity analyses of site selection process, further supported the selection of Sites A and B.
Subsequent to the initial evaluation of the four sites, information became available that indentified conflicts with the utilization of Site A. These conflicts involved an inconsistency in the dimensions of a nearby CERCLA unit and a planned expansion of an existing facility in S-Area. Site A would not have been designated for consideration given these factors. As a consequence of this new information, geotechnical characterization was pursued on Site B only.
5.4 Geotechnical Characterization of Site B
The purpose of the geotechnical characterization of Site B was to describe the subsurface conditions within the proposed Site B footprint for construction suitability (Wyatt and Syms 1999). Specific technical objectives were to: (1) characterize the engineering stratigraphy and compare the continuity, thickness and relative elevation of stratigraphic units across the study location with respect to S-Area; (2) establish the index properties of each stratigraphic layer and directly compare the properties determined for the S-Area stratigraphy; (3) evaluate the presence, thickness and stratigraphic position of soft zones if any; (4) evaluate the presence, style, orientation, and age of potential faulting within the area and (5) assess the subsurface conditions in terms of the relative geotechnical and foundation capability.
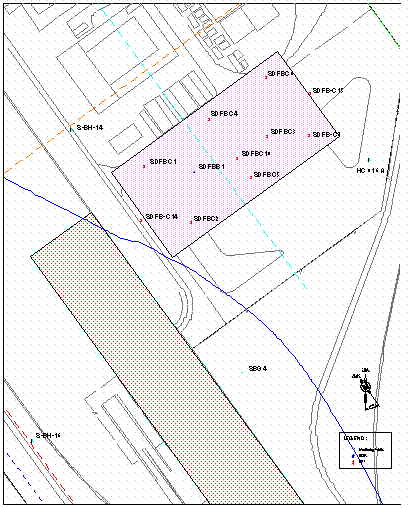
The field exploration program at Site B consisted of 6 Seismic Piezocone Penetrometer (SCPTU) Soundings, 4 Piezocone Penetrometer (CPTU) Soundings with Resistivity measurements, a single Standard Penetration Test (SPT) Boring to 180 feet and coring from 180 feet to 340 feet, a Down-hole Geophysical Logging (Natural Gamma Ray and Resistivity), and a single CPT Groundwater sample (Figure 4). The CPT soundings were pushed to refusal. The results of these samplings indicate that Site B be further considered for construction because:
Figure 4. Geotechnical sampling locations at Site B. Shown are
the boring SDFB-B1 and the
CPT’s within the footprint of Site B. Monitoring well SBG-4, historic borings
S-BH-14 and S-BH-16, and an abandoned piezometer, HC-16A, are also
shown in the area. S-2 and S-7 are historic seismic lines. The shaded
northwest-southeast trending rectangle is the boundary of the
S-Area Sand Blast Area, a potential RCRA/CERCLA waste unit.
6.0 References
Appendix A: Geographical features, adjacent facilities and SDF material transport origins for candidate sites A, B, C and D.
Specific features include:

Figure A-1. Groundwater head and topography in area of potential SDF sites.
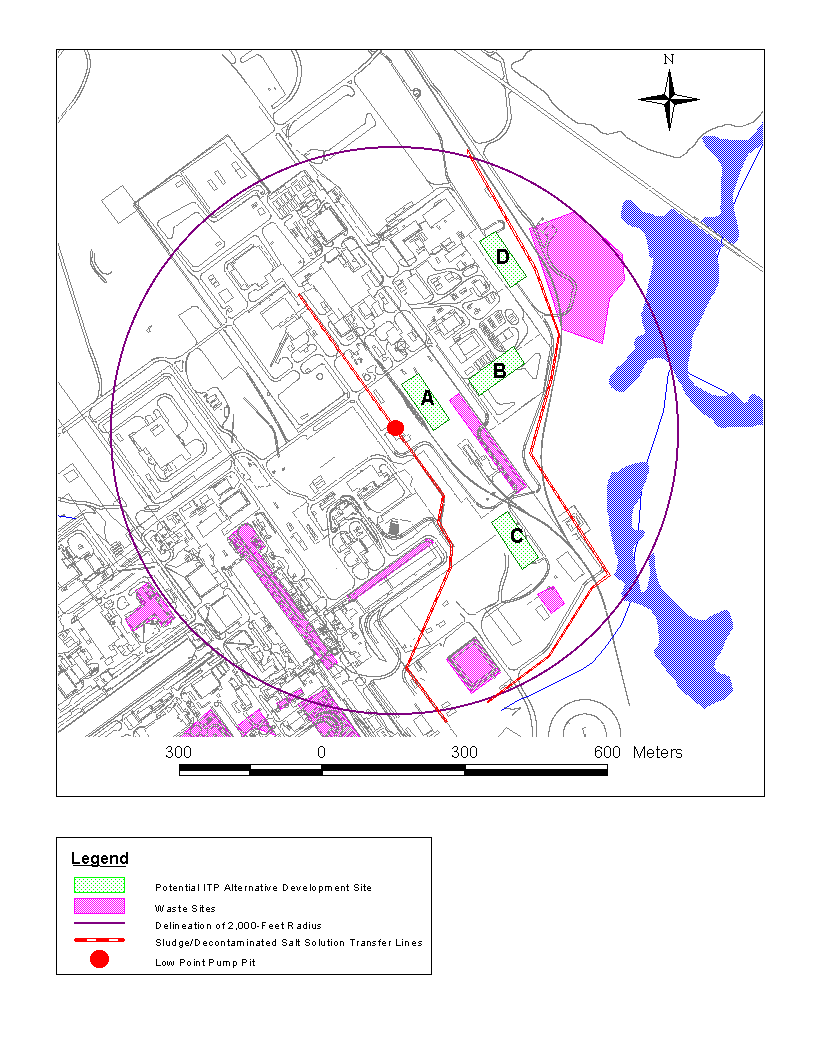
Figure A-2. Potential SDF sites in H-Area.
Figure A-3. S and H-Areas containing three 2000-ft. radius circles
centered on SDF material
transport origins and bounding all potential siting locations.
Appendix B—Sensitivity Analysis
A sensitivity analysis was performed on three aspects of the SDF Site Selection process. These analyses were designed to test for biases associated with certain assumptions and decisions associated with the selection of locations for final screening, sensitivity of the final decision to the relative weighting of the four screening categories, and the sensitivity of the process to the inclusion of the four categories.
B.1 Selection of Locations for Screening
The initial focus of the Site Selection effort was within a 2000-ft radius circle centered at the Low Point Pump Pit. This location received the initial focus because it was believed that centering the search at this location along the HLW Transfer Line would be the most cost effective. Subsequently, two other locations were identified as potential center points for the search area. The two additional points were the Late Wash Facility and the south end of Bldg. 221-S (DWPF). Two thousand foot radius circles were drawn around these center points and the areas were examined for locations that were potentially suitable for construction of the SDF, given the project specific requirements identified in Section 2.3 (SDF-Specific Technical Requirements) and meeting all Exclusion criteria specified in Section 3.1. The areas examined for candidate locations are shown in Figure B-1.
Initial review of H- and S-Areas resulted in the identification of 13 potential locations, which met SDF-specific technical requirements and satisfied the exclusion criteria (see Figure B-1). Further review by the committee, using best professional judgement, resulted in the identification of four sites which were considered most suitable for construction and operation of the SDF (A, B, C and D, respectively, see Figure B-1). The reasons for elimination of the other nine locations are described in Table B-1.
Figure B-1. S and H-Areas indicating search center 2000-ft.
circles
and all potential siting locations.
Table B-1 Evaluation of Nine SDF Locations Excluded from Screening Process.
|
Potential location |
Reasons for elimination |
|
GI |
Impact to adjacent wetlands |
|
GII |
Cost to alter Late Wash Facility, additional extensive
operational complexity |
|
GIII |
Cost to alter Late Wash Facility, additional extensive
operational complexity |
|
GIV |
Cost to alter Late Wash Facility, additional extensive
operational complexity |
|
GV |
Routing of SDF ‘feed’ and ‘product’ less favorable |
|
HI |
Topography less favorable |
|
HII |
Carbonate body beneath area |
|
SI |
Significant disruption to adjacent existing facilities |
|
SII |
Extensive interference with existing underground utilities |
It is noteworthy that factors other than the project specific technical requirements and the exclusion criteria are included in the assessment of potential locations. The overall objective of the site selection process is to identify suitable locations with the highest potential for construction and operation of the facility. Consequently, some factors (e.g. Proximity to Central Training Facility and Topography) are considered qualitatively at this stage to eliminate locations that are anticipated to rank poorly in the quantitative screening process.
B.2 Sensitivity To Category Weighting
The sensitivity of the scoring process to the variations in the weighting of the four major categories (Ecology, Human Health, Geoscience, Engineering) was tested by randomly varying the weights of the categories, while maintaining the constraint that they sum to 100 (Harris, 1999). Scores for individual sites within each of the subcategories were not altered, while the major category weights were varied by up to 40 percent in this series of tests. The results of this analysis indicated that the ranges of scores for Site A did not overlap with the potential ranges of scores for any of the other sites with the maximum tested variation of 40 percent. The range of scores for Site B did not overlap with scores for Sites C and D until the applied variation reached 40 percent. Because of the small differences in the scores for Sites C and D, the smallest variation applied (10 percent ) resulted in clear overlap of the ranges of total scores for those sites. These results are presented in Figure B-2 and provided in more detail in Harris (1999).
Figure B-2 Box and Whisker Plots of Results of Randomly Varying
the Category Weightings
for SDF Site Selection. Data are presented as maximum and minimum
values, means and 25th and 75th quartiles in the plots.
B-3 Sensitivity to Category Exclusion
A third analysis was performed to determine whether any one of the four categories significantly influenced the relative rankings of the sites. In this test, the four categories were tested three at a time with one category eliminated from the analysis. Thus, the total scores represent the sum of only three categories of evaluation. The results are presented in Table B-2.
Table B-2 Results of Analysis Eliminating Screening Categories.
|
SITE |
|||||
|
CATEGORY |
A |
B |
C |
D |
|
|
Ecology |
I |
15.0 |
13.5 |
11.3 |
12.0 |
|
Human Health |
II |
18.6 |
19.4 |
20.0 |
19.4 |
|
Geoscience |
III |
25.2 |
20.1 |
18.0 |
21.3 |
|
Engineering |
IV |
30.5 |
27.3 |
25.9 |
20.0 |
|
I+II+III |
58.8 |
53.0 |
49.3 |
52.4 |
|
|
I+II+IV |
64.1 |
60.2 |
57.2 |
51.4 |
|
|
I+III+IV |
70.7 |
60.9 |
55.2 |
53.3 |
|
|
II+III+IV |
74.3 |
66.8 |
63.9 |
60.7 |
|
The results of this analysis indicated that no one category of the screening inordinately skewed the conclusions of the site selection process. Summing the scores from all combinations of three of the four categories resulted in Site A always having the highest score while Site B always had the second highest score. Only the relative rankings of Sites C and D were changed by this permutation of the original analysis. It is therefore concluded that no single category of the site selection analysis had a dominant influence in the Site Selection Panel recommendation to pursue further characterization on Sites A and B.
Appendix C: Scoring Methods For The Geoscience Subcategories
Five attributes are evaluated under this category:

The primary consideration of the subsurface hydrology is the existence of known groundwater contaminant plumes in the General Separations Area (GSA) and the direction of movement in regard to the evaluation area. Construction may require deep excavations and dewatering designs will require information regarding subsurface hydrology as well as the potential pumping of contaminated groundwater. High hazard facilities require seismic design analysis for liquefaction and deep subsidence, both depending on groundwater table depths.
Average groundwater depth and seasonal fluctuations are considered. The groundwater variation could affect the allowable bearing capacity, liquefaction potential, and the future potential for groundwater contamination. This attribute was principally evaluated based on the groundwater depth at the proposed site, the existence of known groundwater contaminants and the present and potential flow directions of the contaminants.
The range of scoring reflects the best geological estimate of the presence or absence, vertical and lateral extent, and nature and characteristic of localized carbonate bodies and/or soft zones.
Soft subsurface sediments (or carbonate formations) are known to exist in the General Separations Area and could affect foundation stability. Ground improvement may significantly increase the construction cost. The potential presence of soft soils was evaluated for the candidate sites. In general, the presence of soft sediments is expected but should exist as isolated pockets of limited thickness and extent. Furthermore, as shown at ITP, these soft sediments may be closely associated with carbonate units. Screening of potential sites (particularly structural footprints) investigated the existence of carbonate units and soft zones.
The proximity to known faulting affects both the seismic design conditions and the potential groundwater effects of the facility. The expression of faulting as defined from seismic and well log data is generally noted from the geophysical signatures of the regional aquitards. These aquitards also help define the age of the sediments. The shallowest defined regional aquitard is the Gordon Confining Unit, approximately 44 to 47 MYBP. This aquitard is also the principal groundwater regulatory aquitard for RCRA/CERCLA evaluations.
Summary of Geoscience Scoring
The geoscience scoring subcategories were evaluated utilizing data from regional monitoring wells, historical geotechnical and geological borings, historical cone penetrometer test soundings and regional knowledge. Table C-1 provides a summary of scores by site and specific criterion.
Table C-1. Geoscience subcategory scoring summary.
|
Maximum |
Site A |
Site B |
Site C |
Site D |
|
|
Topography (Total) |
15 |
14 |
12 |
14 |
12 |
|
Site topography |
(3) |
3 |
2 |
3 |
2 |
|
Natural drainage localized |
(3) |
2 |
2 |
2 |
2 |
|
Natural drainage at facility footprint |
(3) |
3 |
2 |
3 |
2 |
|
Balanced cut and fill |
(3) |
3 |
3 |
3 |
3 |
|
Road and rail profiles |
(3) |
3 |
3 |
3 |
3 |
|
Surface Hydrology (Total) |
15 |
15 |
15 |
15 |
15 |
|
Proximity to floodplain |
(10) |
10 |
10 |
10 |
10 |
|
Local flooding |
(5) |
5 |
5 |
5 |
5 |
|
Subsurface Hydrology (Total) |
30 |
22 |
15 |
15 |
19 |
|
Ground water depth |
(15) |
11 |
8 |
6 |
7 |
|
Ground water contamination |
(15) |
11 |
7 |
9 |
12 |
|
Geology (soft zone carbonates) |
30 |
23 |
15 |
6 |
15 |
|
Seismology (proximity to known fault) (Total) |
10 |
10 |
10 |
10 |
10 |
|
Geoscience raw score |
100 |
84 |
67 |
60 |
71 |
|
Geoscience weighted core |
30 |
25.2 |
20.1 |
18.0 |
21.3 |
Appendix D: Scoring Methods for the Engineering Subcategories
Subcategory – Distance to the Waste Transfer Line From Late Wash to the Low Point Pump Pit (SDF Feed) – 10:
Salt solution (feed) can be transferred through existing lines which were to be used to transfer precipitate to DWPF. This can be accomplished with little expense or exposure to personnel (R. W. Wilson, Personal Communication – Feeding the New Salt Facility 1999).
Rating for Construction Cost
|
Distance LW to LPPP Transfer Line |
Raw Score |
|
0’- 200’ |
10 |
|
201’- 400’ |
9 |
|
401’- 600’ |
8 |
|
601’- 800’ |
7 |
|
801’ – 1000’ |
6 |
|
1001’- 1200’ |
5 |
|
1201’- 1400’ |
4 |
|
1401’- 1600’ |
3 |
|
1601’- 1800’ |
2 |
|
1801’ – 2000’ |
1 |
|
> 2000’ |
0 |
Scoring Bases – Proximity to waste transfer facilities or lines was scored by measuring the distance and applying the method, described above.
Distance to Salt Processing Facility (Existing) Feed Line
|
Site A |
Site B |
Site C |
Site D |
|
|
Distance, ft. |
130 |
530 |
415 |
1150 |
|
Score |
10 |
8 |
8 |
5 |
Subcategory - Distance to the Decontaminated Salt Solution Transfer Line – 10:
The decontaminated product stream from the SDF can tie into the existing line from Tank 50 to the Salt Solution Hold Tank in Z-Area.
Rating for Cost
|
Distance From the DSS Transfer Line |
Raw Score |
|
0’- 200’ |
10 |
|
201’- 400’ |
9 |
|
401’- 600’ |
8 |
|
601’- 800’ |
7 |
|
801’ – 1000’ |
6 |
|
1001’- 1200’ |
5 |
|
1201’- 1400’ |
4 |
|
1401’- 1600’ |
3 |
|
1601’- 1800’ |
2 |
|
1801’ – 2000’ |
1 |
|
> 2000’ |
0 |
Distance to the Decontaminated Salt Solution Transfer Line
|
Site A |
Site B |
Site C |
Site D |
|
|
Distance, ft. |
870 |
330 |
330 |
0 |
|
Score |
6 |
9 |
9 |
10 |
Subcategory - Sharing Existing Infrastructure – 10:
There are many other facilities in the general vicinity of potential locations for the SDF. The project cost could be reduced by their use. The score for a given projected use should be reduced if the existing facility is not adjacent to the proposed site.
Maximum Points for Infrastructure
2 available cold chemical feeds
3 available Industrial Waste Treatment
1 available tie-in to electrical breakers (440 volt or greater)
1 use of parking lot
3 other available useful facilities
The scores for shared infrastructure were assigned based on proximity to existing facilities and plausibility of providing the service or utility from the existing facility.
Sharing Infrastructure
|
Site A |
Site B |
Site C |
Site D |
|
|
Raw Score for Cold Chemical Feed |
2 |
1 |
1 |
0 |
|
Raw Score for Industrial Waste Treatment Score |
3 |
2 |
0 |
0 |
|
Raw Score for Existing Electrical Tie-In Score |
1 |
1 |
1 |
0 |
|
Raw Score for Parking Lot Score |
1 |
1 |
1 |
1 |
|
Raw Score for Other Useful Facilities Score |
3 |
2 |
2 |
0 |
|
Raw Score Total |
10 |
7 |
5 |
1 |
Subcategory – Distance to the LPPP – 25:
The rating for length distance required for precipitate is done in two parts: one accounting for the processing rate impact on DWPF and the other accounting for construction cost.
Rating for Process Cost
The production capacity of the DWPF’s Salt Processing Cell is directly proportional to the solids concentration of the feed. The Precipitate feed is a non-Newtonian fluid with a finite yield stress and consistency (Poirier 1996a) and its yield stress increases with solids concentration (Poirier 1996b). The discharge pressure for the transfer pump is limited by the pressure the remote process connector can tolerate without leaking (Wood 1999). Therefore, the closer the new Salt Disposition Facility (SDF) is to the LPPP the higher the concentration of solids can be. Out to about 1000’, the transfer from the LPPP to DWPF through the existing line will be limiting, so maximum value is assigned to any location closer than that. Transfer distances greater than 1000’ will reduce the allowable concentration of the precipitate solids and thus reduce the DWPF precipitate-processing rate. The reduction will be significant at distances greater than 1500 feet.
Rating for Distance to Low Point Pump Pit
|
Distance |
Raw Score |
|
0’-1000’ |
15 (Existing Line from LPPP to DWPF limits maximum precipitation concentration, i. e. no reduction in maximum solids concentration) |
|
1001’-1500’ |
7 (Some reduction in maximum solids concentration) |
|
1501’-2000’ |
0 (Significant reduction in maximum solids concentration) |
Rating for Cost
The cost of constructing a doubly contained transfer line with leak detection is in excess of $500 per foot, so 1 point is assigned to each ~$100,000 of construction cost.
|
Distance to LPPP |
Raw Score |
|
0’- 200’ |
10 |
|
201’- 400’ |
9 |
|
401’- 600’ |
8 |
|
601’- 800’ |
7 |
|
801’ – 1000’ |
6 |
|
1001’- 1200’ |
5 |
|
1201’- 1400’ |
4 |
|
1401’- 1600’ |
3 |
|
1601’- 1800’ |
2 |
|
1801’ – 2000’ |
1 |
|
> 2000’ |
0 |
Scoring for Distance to the Low Point Pump Pit
|
Site A |
Site B |
Site C |
Site D |
|
|
Distance, ft. |
250 |
625 |
950 |
1250 |
|
Raw score for processing cost, points |
15 |
15 |
15 |
7 |
|
Raw score for transfer line cost, points |
9 |
7 |
6 |
4 |
|
Raw Score, total, points |
24 |
22 |
21 |
11 |
Subcategory - Disruption to Existing Infrastructure/ Utilities - 10:
The sites were evaluated for disruption to existing infrastructure and utilities.
Sites with no disruption were given the maximum ratings with intermediate rating
based on the extent of disruption. This subcategory was applied:
|
No Disruption |
10 points |
|
Moderate Disruption- Items requiring disruption to existing services but no operating facility impact |
5 points |
|
Significant Disruption- Disruption to operating facility including outage requiring process shutdown. |
0 |
Site A and Site B are located inside the current "S" area fence and require disruption of support facilities. Site-A requires relocation of the railroad track east of the 221-S building and Site B requires disruption of support facilities located in southeast corner of S-Area. Hence both these sites are given a score of 5 for moderate disruption.
Site C and Site D are proposed over existing under ground lines. A domestic water line is located under the proposed location of Site C and transfer line to "Z" area is under Site D. Both the lines will require rerouting . Hence both these sites are also given a score of 5.
Subcategory - Access to Utilities 10:
The salt disposition facilities require numerous utilities and services that are necessary for facility operation. These services include domestic water, fire water, steam, and electrical power supply. The cost of these new services is directly proportional to the distance to an available tie-in point in an existing line. Because of this relationship, sites are evaluated on these linear distances at 200-ft. intervals:
Rating for Cost
|
Distance to Tie-In |
Distance to domestic water, |
Distance to fire water, |
Distance to steam supply, raw score |
Distance to electric power, raw score |
Total Raw Score |
|
< 200’ |
2.5 |
2.5 |
2.5 |
2.5 |
10 |
|
201’-400’ |
2.25 |
2.25 |
2.25 |
2.25 |
9 |
|
401’-600’ |
2.0 |
2.0 |
2.0 |
2.0 |
8 |
|
601’-800’ |
1.75 |
1.75 |
1.75 |
1.75 |
7 |
|
801’-1000’ |
1.5 |
1.5 |
1.5 |
1.5 |
6 |
|
1001’-1200’ |
1.25 |
1.25 |
1.25 |
1.25 |
5 |
|
1201’-1400’ |
1.0 |
1.0 |
1.0 |
1.0 |
4 |
|
1401’-1600’ |
.75 |
.75 |
.75 |
.75 |
3 |
|
1601’-1800’ |
.5 |
.5 |
.5 |
.5 |
2 |
|
1801’-2000’ |
.25 |
.25 |
.25 |
.25 |
1 |
|
> 2000’ |
0 |
0 |
0 |
0 |
0 |
Scores for Distance to Utility Tie-In.
|
Site A |
Site B |
Site C |
Site D |
|
|
Distance to domestic water, |
2.5 |
2.25 |
2.5 |
2.5 |
|
Distance to fire water, |
2.5 |
2.25 |
2.5 |
2.5 |
|
Distance to steam supply, raw score |
2.25 |
2.0 |
2.5 |
2.25 |
|
Distance to electric power, raw score |
1.75 |
1.25 |
2.5 |
0.75 |
|
Raw score, total, points |
9.0 |
7.8 |
10.0 |
8.0 |
Subcategory - Sanitary Plant Tie-In 2:
The cost of sanitary tie-in line is directly proportional to the distance to existing treatment facility lines. Hence the scoring subcategory used as follows:
Subcategory - Distance to an Existing NPDES Discharge Point 3:
The storm water system through-process facilities are sampled and monitored at NPDES (National Pollutant Discharge Elimination System) discharge points. The distance to these monitoring locations has direct bearing on the cost of the storm water collection and discharge system for the new facility. Hence the scoring subcategory is as follows:
Subcategory - Construction Site Suitability - 15:
From a cost effectiveness perspective several site attributes are considered and included in the weighting for the above subcategory. They are as follows:
Construction Site Separation - 4:
Each of the four proposed sites can be separated from existing operating areas and fully meet the established subcategory. A score of 4 is recorded for each site.
Laydown Yard 6:
Site A has the required laydown space required adjacent to and surrounding the facility. Space is available for a concrete batch plant within 2000 feet of the facility. Existing and previously used access roads can be used for heavy truck travel. A score of 6 is recorded for Site A.
Site B has the required laydown space with a lessor amount available adjacent to and surrounding the facility. Space is available for a concrete batch plant within 2000 feet of the facility, however access roads will require improvement for heavy truck travel. A score of 5 is recorded for Site B.
Site C has the required laydown space with a substantial amount not adjacent to and surrounding the facility. Preparation of satellite laydown areas will require additional work and transport cost when compared to Site A and B. Space is available for the a concrete batch plant within 2000 feet of the facility, however the location will require considerable site preparation and construction of temporary roads. A score of 4 is recorded for Site C.
Site D has a very minimal amount of the required laydown space adjacent to and surrounding the facility. Space is available in satellite areas, requiring considerable preparation work including temporary roads. The travel distance the satellite laydown areas is greater than a distance normally traversed by material handling equipment. Space is available for a concrete batch plant within 2000 feet of the facility, however the location will require considerable site preparation and construction of temporary roads. A score of 3 is recorded for Site D.
Temporary Construction Facilities - 1:
There is not available at any of the proposed sites temporary facilities that can be used during construction of the facility. A score of 0 is recorded for each site.
Warehouse Facility Space - 2:
There is not available at any of the proposed sites, warehouse facilities that can be used during construction of the facility. A score of 0 is recorded for each site.
Excess Spoil Disposal Area - 2:
All proposed sites have soil disposal areas within 2500 feet of the facility.
Site A and C have existing temporary roads that with minimal improvements can be used by heavy earthmoving equipment. A score of 2 is recorded for Sites A and C.
Sites B and D do not have existing temporary roads that can be used and considerable temporary road construction will be required. A score of 1 is recorded for Sites B and D.
Construction Site Suitability

Subcategory - Primary Road and Rail Proximity 3:
Location near existing SRS road and rail infrastructure to provide personnel access and material deliveries, both during construction and long term facility operation. If these standards can be met, considerable cost savings for temporary and permanent roads can be realized.
All proposed sites are located in the close proximity of existing paved road and rail infrastructure for personnel access and material deliveries. All sites are immediately adjacent to existing railroad spurs.
Sites A and C have existing temporary roads that with minimal improvements can be used for vehicle and heavy truck access from the paved roads. A score of 3 is recorded for Site A and C.
Sites B and D do not have existing temporary roads that can be used for vehicle and heavy truck access. Major temporary road construction will be required. A score of 2 is recorded for Site B and D.
Proposed Site

Subcategory - Archaeology 2:
Archaeology scores are based entirely upon the archaeology sensitivity zone (SRARP 1989) in which the proposed facility will be constructed. Maximum points are given for the least sensitive zone.
Sites A, B, and D were given identical maximum scores for Archaeology because they all fall within the lowest archaeological sensitivity zone (SRARP, 1989). Site C was given one point since it does fall within the next higher sensitivity zone.