WSRC-MS-99-00660
Modeling Atmospheric Deposition from a Cesium Release in
Spain Using a Stochastic Transport Model
Westinghouse Savannah River Company
Savannah River Site
Aiken, SC 29808
Introduction
The removal of gases and particulate suspensions from the atmosphere by surface transfer mechanisms (dry and wet deposition) is important for assessing contaminant doses. Mesoscale and long-range transport problems are also strongly affected by the resulting plume depletion that occurs when deposition is considered. A majority of the pollution in the atmosphere is removed by chemical transformations to other compounds, or by transport into the soil, vegetation or water. The concern in this study is with the latter mechanism. Deposition is the transfer of airborne material (gaseous and particulate) to the earth's surface, and may be classified as `dry' or `wet', depending on whether or not precipitation is involved. Dry deposition occurs near the earth's surface, while wet deposition involves absorption of airborne pollutants onto precipitable elements (water droplets, ice particles, graupel, etc.) and is another means by which pollutants reach the earth's surface. Although deposition is very difficult to parameterize due to its dependence on so many items, it is important to include this physical removal mechanism in atmospheric transport codes.
This paper discusses the incorporation of dry and wet deposition into a stochastic particle transport model (the Lagrangian Particle Dispersion Model, LPDM (Uliasz 1993)). Particles are advected and dispersed subject to meteorological fields generated using a prognostic mesoscale model (the Regional Atmospheric Modeling System, RAMS, Pielke et al. 1992). Background and a general description of deposition and the transport model are first discussed. The deposition is parameterized in two ways in this paper. The first method assumes constant properties in time and space in calculating deposition, while the more complex method determines the deposition as a function of meteorology, land-cover, and precipitation. Implementation of deposition in the transport model is discussed, followed by an application using the LPDM for a release of Cesium-137 from Algeciras, Spain.
Deposition
In modeling applications of turbulent diffusion, the surface boundary condition is often described as perfectly reflecting, implying that no physical or chemical interaction of the pollutant with the ground occurs. When deposition is introduced into the problem, the surface boundary condition changes such that the surface is partly reflecting/absorbing. The surface deposition is expressed as a downward mass flux, which is often parameterized as the product of a deposition velocity, vD, and the average surface concentration. If the deposition velocity is known, or can be calculated, then deposition (mass per area) is determined by the product of the deposition flux and the time interval over which the calculation is made.
Measurements of deposition velocity are discussed in detail in the literature (e.g. Sehmel 1980). In practice, a constant deposition velocity in both time and space is often used. This represents the simple way in which dry deposition calculations are incorporated into the transport model. The more complex calculation treats the deposition velocity as variable. This velocity depends on many factors, including boundary layer meteorology, surface characteristics, and the material being deposited. An analogy to electrical current flow across resistances is used, e.g.

where the terms on the right-hand side represent aerodynamic, quasi-laminar, and surface resistance, respectively (Hicks et al. 1987). Different formulations are used depending on whether the source is a gaseous or particulate material. Gaseous deposition is typically a function of chemical activity, solubility, and diffusion characteristics, while particulate deposition depends on particulate shape, size distribution, density, impaction, solubility, gravitational settling, and diffusion (Sehmel 1980). Note that in all of these applications, it is assumed that particles obey Stokes law.
Wet deposition occurs through rainout (within cloud scavenging) and washout (below cloud scavenging). Detailed theoretical analysis may be found in Slinn (1984). Due to the great uncertainty in precipitation scavenging measurements, and in generating precipitation within the mesoscale model, a simplified approach is taken in this study. The removal process is parameterized as a first-order decay process in which concentration is related to a scavenging (or washout) coefficient, commonly related to rainfall rates. In the simplified deposition calculations, the washout coefficient is a user-defined constant value in those areas in which rainfall exists, whereas in the complex calculation, the washout coefficient is a function of the rate at which precipitation is falling (ApSimon et al. 1988).
Model Descriptions
The atmospheric mesoscale model used in this study (RAMS) is a three-dimensional primitive-equation, finite-difference model with a two-way nested grid option. In addition to supplying the transport model with wind and turbulence fields, the microphysical parameterization available within RAMS (Cotton et al. 1982) is utilized to generate precipitation for use in estimating wet deposition. Although interactions of rainwater droplets with graupel, hail, snow, pristine ice, or aggregates are modeled in the parameterization, the generation of rainwater is the only item considered. A mean droplet diameter is specified from which rain-mixing ratio is determined. This value is passed on to the transport model for use in wet deposition calculations.
Input for the stochastic transport model (LPDM) comes in the form of three-dimensional wind and turbulence (Gaussian) fields generated by the atmospheric model. A large number of particles may be released and their positions tracked by numerically solving the Langevin stochastic differential equation for subgrid-scale turbulent velocities (Gifford 1982).
Each particle represents a discrete element of pollutant mass that may be used in the calculation of concentration. Concentrations are estimated using the "cell" method, whereby the mass of individual particles in a physical cell volume is summed. The initial mass of each particle released into the atmosphere is determined from a user-defined mass release rate. This is a discrete method in which the concentration estimate is assumed to be constant throughout the sampling volume.
It is also important to note that in LPDM a collection of virtual `particles' makes up the mass of pollutant released into the atmosphere. A particle released in LPDM should not be confused with aerosols (denoted in this paper as particulate suspension, matter, etc.) whose characteristics (i.e. diameter, settling velocity, etc.) may be totally different. Each particle released in LPDM is assigned varying attributes, including location, turbulent velocity fluctuations, and age. The deposition is assumed to be dependent on the particle species, and multiple species may be released for a given source location. With the inclusion of deposition, each particle is assigned a mass. The initial mass of each released particle is assumed to be the same for a given source location and species.
Implementation
The incorporation of deposition implies that the mass of each LPDM particle is reduced if it is subjected to a depositing mechanism (i.e. it exists near the surface or within a cell containing precipitation). It is assumed that the surface concentration is calculated within the lowest model layer within LPDM (~25 m AGL) and that surface characteristics such as vegetative roughness length are contained within this surface cell. After particles are emitted into the simulation domain with assigned individual masses, the mass loss of these particles due to wet and dry deposition is calculated.
For wet deposition, mass is depleted according to the scavenging coefficient only in those regions where RAMS predicts rain. The concentration (C, related to mass through the cell volume) is assumed to decay following a first-order process
where [Lambda] is the scavenging coefficient (units of inverse time). For the simple case, [Lambda] is constant, while for the complex case, [Lambda] varies with the intensity of the rainfall. The total mass accumulated at the surface in a given cell due to wet deposition is determined by summing the mass loss over all grid cells in a vertical column above that cell. The instantaneous wet deposition to the surface [mass per area] is then found by dividing this mass loss by the surface area of the grid cell.
Calculation of dry deposition requires knowledge of each particle's location and mass. If a particle enters a surface cell (the lowest model level above ground), it is subjected to mass loss. The dry deposition flux (Fd) within a cell is determined knowing the volume (V) of the grid cell, the total mass of particles in that cell (M), and the deposition velocity of each particle:
The dry deposition within a grid cell is then the product of this flux and the model time-step. This quantity can be used to determine the mass loss of each particle in a cell, assuming the mass loss is distributed equally among all particles. The updated individual particle masses are determined from the difference in the original particle mass and the incurred loss due to dry deposition.
Cumulative deposition values are continuously summed after each time-step and the mass of each LPDM particle is then updated after this entire process by subtracting out the previously determined mass losses. In this manner, the mass of each particle is depleted according to various physical mechanisms, and deposition values are formulated according to this change in particle mass. The total mass within each cell is also used to determine the concentration, commonly used in displaying results.
Application
As a result of melting a medical radiotherapy source, a steel-processing furnace in Algeciras, Spain released Cesium-137 leading to radioactive contamination covering much of southern Europe during late May and early June 1998. The mesoscale model (RAMS) was used to simulate meteorological conditions in Europe for the period covering 12 GMT, 29 May 1998 to 00 GMT, 05 June 1998. Lateral and initial boundary conditions were provided using large-scale dynamical conditions obtained from the NCEP Medium Range Forecast (MRF) model. In addition, surface and upper-air meteorological reports for fixed land stations were blended with the large-scale gridded information. The horizontal grid spacing is 50 km, while the vertical spacing stretches from 60 m at the surface to 1.25 km at the model top (~17 km). Meteorological conditions used as input for LPDM were generated on an hourly basis.
The general synoptic pattern revealed a low-pressure system centered off the western coast of France during the release (00 GMT, 30 May), leading to west to southwesterly winds at Algeciras (Fig. 1). Over the next several days, this low pressure intensified while a ridge of high pressure formed in central Europe. This resulted in pollutant being transported along the southeastern Spanish border and into northern Italy. Following this, the majority of the pollutant near the surface was caught up in the clockwise flow about a high pressure centered near southern Italy. This high pressure weakened, leading to strong southerly flow through Sardinia and Corsica, and strong northerly flow through the Adriatic Sea and the Balkan States by 12 GMT, 03 June. Wind in central Europe became lighter and varied from southerly to westerly in direction, which resulted in pollutant traversing northern Italy and Austria before traveling south through the Balkan States. By the end of the period (00 GMT, 05 June), winds became light and variable in the northern Balkans, while stronger northerly winds remained through Greece.
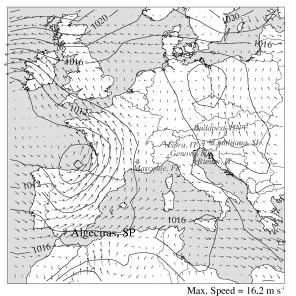
Figure 1: Synoptic surface conditions using MRF (Aviation) analysis at 1000 mbar at 00 GMT, 30 May 1998. Contours of sea-level pressure (mbar) are shown as solid lines, while arrows represent wind speed and direction. The maximum speed indicates the length of the longest arrows. Several measurement sites are also shown.
Results are shown for three separate transport simulations. The first simulation assumes no deposition occurs. Constant deposition parameters which are typically used in deposition modeling applications (vD = 0.1 cm s-1, [Lambda]= 0.0001 s-1) are used in the second simulation (i.e. the `simple' case of deposition), while variable deposition is assumed to occur in the third model run. Using estimates of the source release (Vogt et al. 1999), each simulation assumed 80 Ci of Cesium-137 (equivalent to ~0.8 g for this species) was released over a 30-minute period at 50 m AGL beginning at 01:30 GMT, 30 May. Integrated surface concentration is shown after the 6-day period in Fig. 2 for the three simulations. The darker shading indicates higher concentration in orders of magnitude. Contaminant is seen to spread northeasterly from the release out over the Mediterranean Sea, southern France, Italy, and into Eastern Europe. In all cases, the most intense surface concentration is near the source, and on a line east-northeast through the island of Corsica and into central Italy, a result of the low-pressure system near France and England.
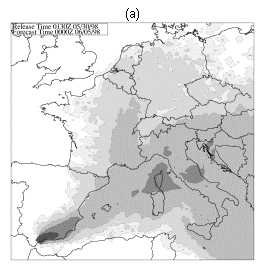
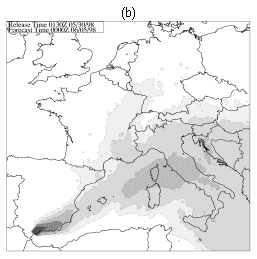
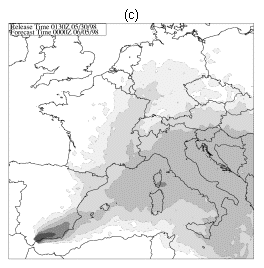
Figure 2: Integrated airborne concentration near the surface after 6 days. Contour values decrease in orders of magnitude from 106 µBq m-3 (darkest shading) to 102 µBq m-3 (lightest shading). (a) No deposition, (b) constant deposition, (c) variable deposition.
As seen in Fig. 2a, plume migration assuming no deposition is more widespread than for either of the other cases. Concentrations of greater than 100 µBq m-3 are simulated as far north as northern Germany. Assumption of constant deposition (Fig. 2b) in this case yields smaller airborne (surface) concentrations than when it is allowed to vary as a function of meteorology, surface characteristics, and rainfall intensity (Fig. 2c). This implies larger total mass loss, leading to greater deposition.
Figure 3a illustrates the difference in total mass lost as a function of time for the simulations. A large portion of the overall mass is lost within the first 18 hours of the simulation (more than half for the variable deposition case and more than 80% assuming constant deposition). This sudden drop is a combination of both depositing mechanisms. Particles are released very near the surface and are being deposited out due to dry deposition mechanisms. However, rainfall was also simulated near the source during this time period, resulting in a large percentage of mass being quickly deposited out due to scavenging processes. After 3 days, particles begin to leave the LPDM grid domain, resulting in mass loss for the case of no deposition. By this time, roughly one-third of the original mass (80 Ci, or 0.8 g) remained for the variable deposition simulation, while only 7% of the original mass stayed in circulation for the constant deposition case. This mass loss may be changed through modification of the deposition velocity and the scavenging coefficient.
The percentage of effluent mass as a function of distance above ground for each of the simulations at three different times (Fig. 3b) reveals a very high percentage near the surface initially, which is not surprising since all particles are released near ground level. After three days (dotted lines), the peak of the mass distribution lifts to 250-m above ground, while a more even vertical distribution to higher levels is evident. This is a result of particles being lifted higher into the atmosphere due to flow through mountainous terrain and/or frontal passage. By the end of the simulation, the largest percentage of mass is again near the ground (dashed lines), as many of the particles have returned to the surface. However, as evidenced by the increased mass percentages above 2000 m AGL, a non-trivial amount of particles is still being elevated. The simulation with no deposition exhibits higher mass totals aloft compared with the deposition simulations as a result of scavenging for the latter simulations.
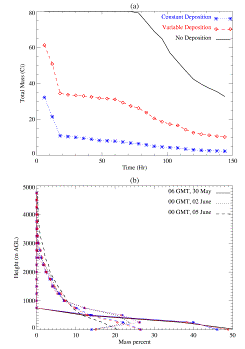
Figure 3: (a) Total mass (Ci) as a function of time since the start of the LPDM simulation (every 6-hrs) for constant deposition (dotted line, asterisks), variable deposition (dashed line, diamonds), and no deposition (solid line). The total mass released is 80 Ci (0.8 g). (b) Percentage of mass by height (at 250-m intervals) at three different times for each simulation. Simulation case denoted by markers as in part (a). Linestyle differs for differing times.
This reduced mass at higher elevations also accounts for the larger surface mass percentages. In other words, the inclusion of wet deposition has lowered the vertical center of mass over the entire simulation domain.
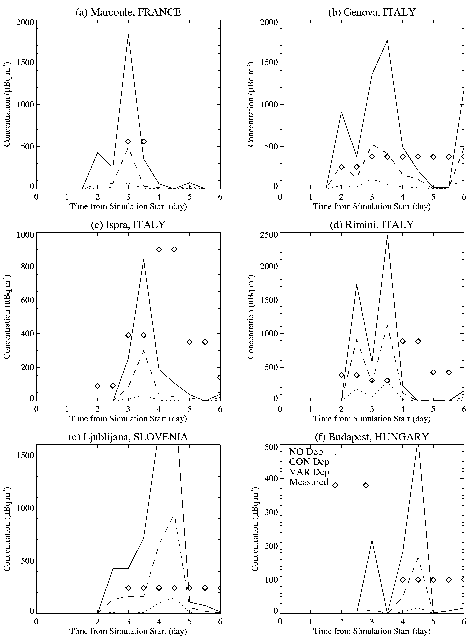
Figure 4: Comparison of measured averaged airborne surface concentration (µBq m-3) and simulated averaged surface concentrations over time and for the various locations. The solid line indicates no deposition in the LPDM simulation, while the dotted line shows constant deposition calculations. The dashed line indicates variable deposition, while the diamonds represent measured quantities. Simulated averages are for a 12-hr period, while measured values are for 1 to 5-day periods. Note the differing vertical scales.
Comparisons of measured airborne concentrations near the surface (Vogt et al. 1999) with the three simulations are depicted in Fig. 4 for several locations over the 6-day simulation period. The simulated concentrations are averaged over a 12-hr period, beginning at 00 GMT, 30 May, and continuing until 00 GMT, 05 June. The measured values are typically given in 1 to 5-day averages. For the given measurement period, the value is merely shown repeatedly at 12-hr intervals on the graph. It is difficult to make general statements regarding the strength of one simulation over another given the limited data with which to compare results and the uncertainty of the source strength and location (Vogt et al 1999).
In all cases, the variable deposition simulation yields higher concentrations than the constant deposition case, in agreement with Fig. 3a. Simulated concentrations in Marcoule, France (Fig. 4a) indicate peak values in all cases occurring at roughly the same time as measurements. This is not the case for Ispra, Italy, where the simulated peak airborne concentrations occur 12 hours early. As seen in most locations, the existence of deposition in the model aids in reducing the airborne surface concentration nearer to measured levels compared to the assumption of no deposition.
In summary, deposition enhanced the simulation predictions, especially further downwind of the release point (eastern Italy to Austria). The constant deposition velocity of 0.1 cm s-1 appears to be too high in this instance as simulated concentrations are consistently too low. Based on measurements, the plume footprint depicted in Fig. 2, which tends to exhibit maximums on an east-northeasterly line through Corsica and central Italy, is slightly south of the actual plume. The highest measured concentrations tended to be in northern Italy (i.e. Milan) and southern France (i.e. Toulon, Nice). Concentrations for all simulations were underestimated in these regions (not shown). Therefore, errors in meteorology play a major role in concentration estimates.
Conclusions
A stochastic atmospheric Lagrangian particle transport model has been modified to incorporate both dry and wet deposition. Each particle is initially assigned a mass, which is depleted according to the various mechanisms discussed in the paper. A set of simulations has been performed and compared with measured data obtained during an accidental release of Cesium-137 in Algeciras, Spain. No removal mechanism is employed in the first case, while constant wet and dry deposition rates are assumed in the second case, and variations in deposition according to surface conditions, meteorology, and rainfall intensity are used in the third case.
While definitive conclusions regarding the `best' simulation are difficult to make, due to potential error from sources other than the deposition models themselves, it is seen that reductions in airborne surface concentration due to inclusion of the mass removal mechanisms can result in improvements in the transport calculations. Underestimates in concentration using constant deposition velocities and scavenging coefficients can be corrected by modifying their values. However, as shown in much of the literature, these values are not constant in nature, and the added physical mechanisms involving aerodynamic, sublayer, and surface resistance, as well as variations in wet deposition due to rainfall intensity, improve the basic premise behind the modeling effort.
References
- ApSimon, 1988: The use of weather radar in assessing deposition of
radioactivity from Chernobyl across England and Wales. Atmos Environ.,
22 (9), 1895-1900.
- Cotton, W. R., M. A. Stephens, T. Nehrkorn, and G. J. Tripoli, 1982:
The Colorado State University three-dimensional cloud model--1982. Part
II: An ice phase parameterization. J. Rech. Atmos., 16,
295-320.
- Gifford, F. A., 1982: Horizontal diffusion in the atmosphere: a Lagrangian-dynamical
theory. Atmos. Environ., 16, 505-512.
- Hicks, B. B., D. D. Baldocchi, T. P. Meyers, R. P. Hosker Jr., and
D. R. Matt, 1987: A preliminary multiple resistance routine for deriving
dry deposition velocities from measured quantities. Water, Air and
Soil Pollut., 36, 311-330.
- Pielke, R. A., W. R. Cotton, R. L. Walko, C. J. Tremback, W. A. Lyons,
L. D. Grasso, M. E. Nicholls, M. D. Moran, D. A. Wesley, T. J. Lee,
and J. H. Copeland, 1992: A comprehensive meteorological modeling system--RAMS.
Meteor. Atmos. Phys., 49, 69-91.
- Sehmel, G. A., 1980: Particle and gas dry deposition: a review. Atmos.
Environ., 14, 981-1011.
- Slinn, W. G. N., 1984: Precipitation Scavenging. In Atmospheric
Science and Power Production (D. Randerson, ed.), pp. 466-532. U.
S. Department of Energy, Technical Information Center, Oak Ridge, TN.
- Uliasz, M., 1993: The atmospheric mesoscale dispersion modeling system.
J. Appl. Meteor., 32, 139-149.
- Vogt P. J., B. M. Pobanz, F. J. Aluzzi, R. L. Baskett, and T. J. Sullivan, 1999: ARAC simulation of the Algeciras, Spain steel mill CS-137 release, 51 pp.,UCRL-JC-131330, Lawrence Livermore National Laboratory, Livermore, California.