Distinguishing Micron-sized UO2, UO3, etc. Particles from Other Common Mineral Particles by Single-shot Fluorescence Spectra
Justin Halverson
Westinghouse Savannah River Company
Aiken, SC 29808
Yong-Le Pan
and Richard K. Chang
Yale University
New Haven, Connecticut 06520
Abstract
An optical system for detecting the single-shot fluorescence spectrum from a single flowing particle was built. With this system, the single-shot fluorescence spectrum was observed from an individual UO3 particle around 50 mm in diameter. The fluorescence spectra from UO2, UO3, U3O8 were centered around 520 nm when excited by a 266 nm or 355 nm laser. The fluorescence spectra from UOx showed different peak wavelengths and different spectral profiles from those of SiO2, Al2O3, CaO, CdO, CrO3, Cr2O3, FeO, Fe2O3, Li2O, PbO, PbO2, and Pb3O4, which could be the main interfering mineral-oxide particles. These differences provide the possibility of a quick and simple method for distinguishing UO2, UO3, U3O8, and other uranium oxide particles from many common mineral-oxide particles. By measuring single-shot, single-particle fluorescence spectra, it also may be possible to monitor the ambient aerosols that are contaminated with uranium oxide in the respiratory size aerosols (1-10 mm in diameter).
Introduction
Uranium is commonly used in the nuclear fuel cycle and in the production of nuclear weapons. In addition, the following activities may produce uranium-oxide aerosols: mining, grinding, and milling of uranium ores, burning of uranium metal chips and smelting operations. Beside of nuclear weaponsthe nuclear fuel cycle, uranium is used as armor, armor piercing ordnance, and catalysts for many chemical reactions. The uUranium oxide is also used in production of fluorescent glasses, in photographic processes, alloying steel, radiation shielding, and aircraft counterweights. In all cases of the use of uranium, there is a need to monitor industrial exposures and environmental environmental aerosol releases. When released either to the work area or to the environment from these processes, uranium will usually occur as an oxide (most commonly UO2, or UO3), or as a compound containing the uranyl group [(UO2)2+]. The oxide and uranyl group have similar fluorescence spectra that provide the ability to detect this class of compounds by laser-induced fluorescence spectroscopy.
Laser-induced fluorescence spectroscopy (LIF, or laser fluorometric) has been widely used for determination of uranium in soil, rock, plant ash, red mud, and even biological medium samples (Brina et al, 1992; Deniau et al, 1993; Hunter et al, 1998; Moulin et al, 1998; Premadas et al, 1999; Scapolan et al, 1997; Smith et al, 1999). Time-resolved LIF spectroscopy has detected uranium at 5 mg within 1 liter pure nitric acid solutions at room temperature (Deniau et al, 1993). By using kinetic phosphorimetry technique, detection of UO22+ in aqueous solutions has reached the detection limit 1 ng/L (Brina et al, 1992). However, most of these analytical methods require extensive pretreatment and the measurements are carried out in the nitric acid, solvent, or ion forms. In the mineral soils and ambient aerosols, uranium exists in various complicated forms, e.g., in the different oxidation state or complex state. Therefore, a sensitive and fast method for the determination of aerosol particles that contain uranium-oxide or compounds containing the uranyl group is still needed particularly in industrial and environmental hygiene. A real-time, in situ method may be applicable in the detection of uranium-containing particles in the presence of large amounts of soils with other mineral-oxide particles.
In this paper, preliminary studies performed in a system for detecting single-shot fluorescence spectrum from individual flowing particle show the possibility of quick on-line detection of particles containing uranium in the presence of other mineral-oxide particles. The fluorescence spectra from UO2, UO3, and U3O8 centered around 520 nm have different spectral profiles and peak positions than those of some common ambient aerosols such as SiO2, Al2O3, CaO, CdO, CrO3, Cr2O3, FeO, Fe2O3, Li2O, PbO, PbO2, and Pb3O4 particles, when they are excited by a 266 nm or 355 nm laser. The sensitivity and high sample rate of our system allow us to determine the fluorescence spectrum of UO3 particle of 50 micron-diameter with single-laser-shot and at a rate of 1,400 particles per second.
Experimental
The samples used in our experiments were purchased from Alfa Aesar without any further purification. The UO2, UO3, Al2O3, CaO, CdO, CrO3, Cr2O3, FeO, Fe2O3, Li2O, PbO, PbO2, and Pb3O4 samples, were in the particulate form and sized in the tens to hundreds of micron diameter range. The U3O8 was in the nitride acid solution with a 5% concentration. The 0.1 N nitric acid, used for dissolving these samples, was also purchased from Alfa Aesar.
The absorption spectra were measured with a UV-Visible Spectrophotometer (CARY 3E). The 0.1% concentration solution (by weight) of the oxide samples within the 0.01 N HNO3 was measured simultaneously with the reference 0.01 N HNO3 solvent. Both liquids were placed in quartz cells (1 cm ×1 cm × 3cm).
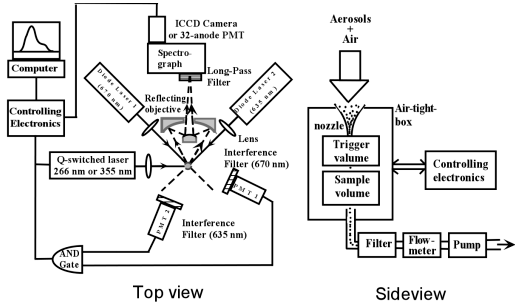
The fluorescence spectra were measured from dry particles within a quartz cell. A pulsed 266 nm or 355 nm UV laser (4th or 3rd harmonic of a Q-switched Nd:YAG laser, 30 ns pulse duration) is used as the illumination light. The fluorescence from the particles is collected by an Schwartzchild reflecting objective, and focused onto a spectrograph slit for dispersion. A long-pass filter is placed in front of the spectrograph to block the elastically-scattered radiation (266 nm or 355 nm) and to pass the fluorescence. The fluorescence spectra were detected by an image-intensified CCD camera (ICCD) or a 32-anode photomultiplier-tube (PMT, pan et al, 2001) that attached to the exit port of the spectrograph.
The single-shot fluorescence spectrum was obtained via a high-speed single-shot fluorescence spectrum analyzer (HSFSA, pan et al, 2001), which was re-designed for drawing the particles into an air-tight-box with filtered output that prevented release of the uranium particles to the laboratory or environment. The optical arrangement of this system has been described in detail previously (see detail in Fig. 1, Pan et al, 1999 and 2001). Briefly, sample particles are drawn from an inlet funnel and exit from a nozzle. The nozzle is designed to aerodynamically focus the aerosols after exiting from the nozzle. These particles flow down stream toward a trigger volume, defined by the intersection of two (635 and 670 nm wavelength) diode laser beams. Only when a particle crosses both of these beams, a trigger pulse is generated to fire the UV laser and gated the detector. The UV laser fires about 2 µs after received the trigger pulse, during which time the particle travels about 20 µm from the trigger volume to the sample volume. The UV laser is focused (500 µm spot size) at the sample volume to excite the single particle. The fluorescence collection, dispersion, and detecting parts are the same as above description.
Particles flowing from the nozzle into an air-tight-box are drawn by the lower atmospheric pressure within the box. The box, which contains the trigger diode lasers and detectors, lenses, mounts, translation stages, and the reflecting objective, is evacuated by a pump through an induction tube, which is aligned about 2 cm below the nozzle. The pump rate is adjustable from 0 to 3 liter/min, which determines the particle velocity through the nozzle inlet. The exhaust is connected to a particle filter before passing through a mass flow meter and a pump (side view in Fig. 1). Alignment of the optical components can be adjusted outside the box by using DC motor driving micrometer through a 25 pin electrical feedthrough connector.
Result and Discussion
1. Absorption spectra of UO2, UO3 etc. solutions
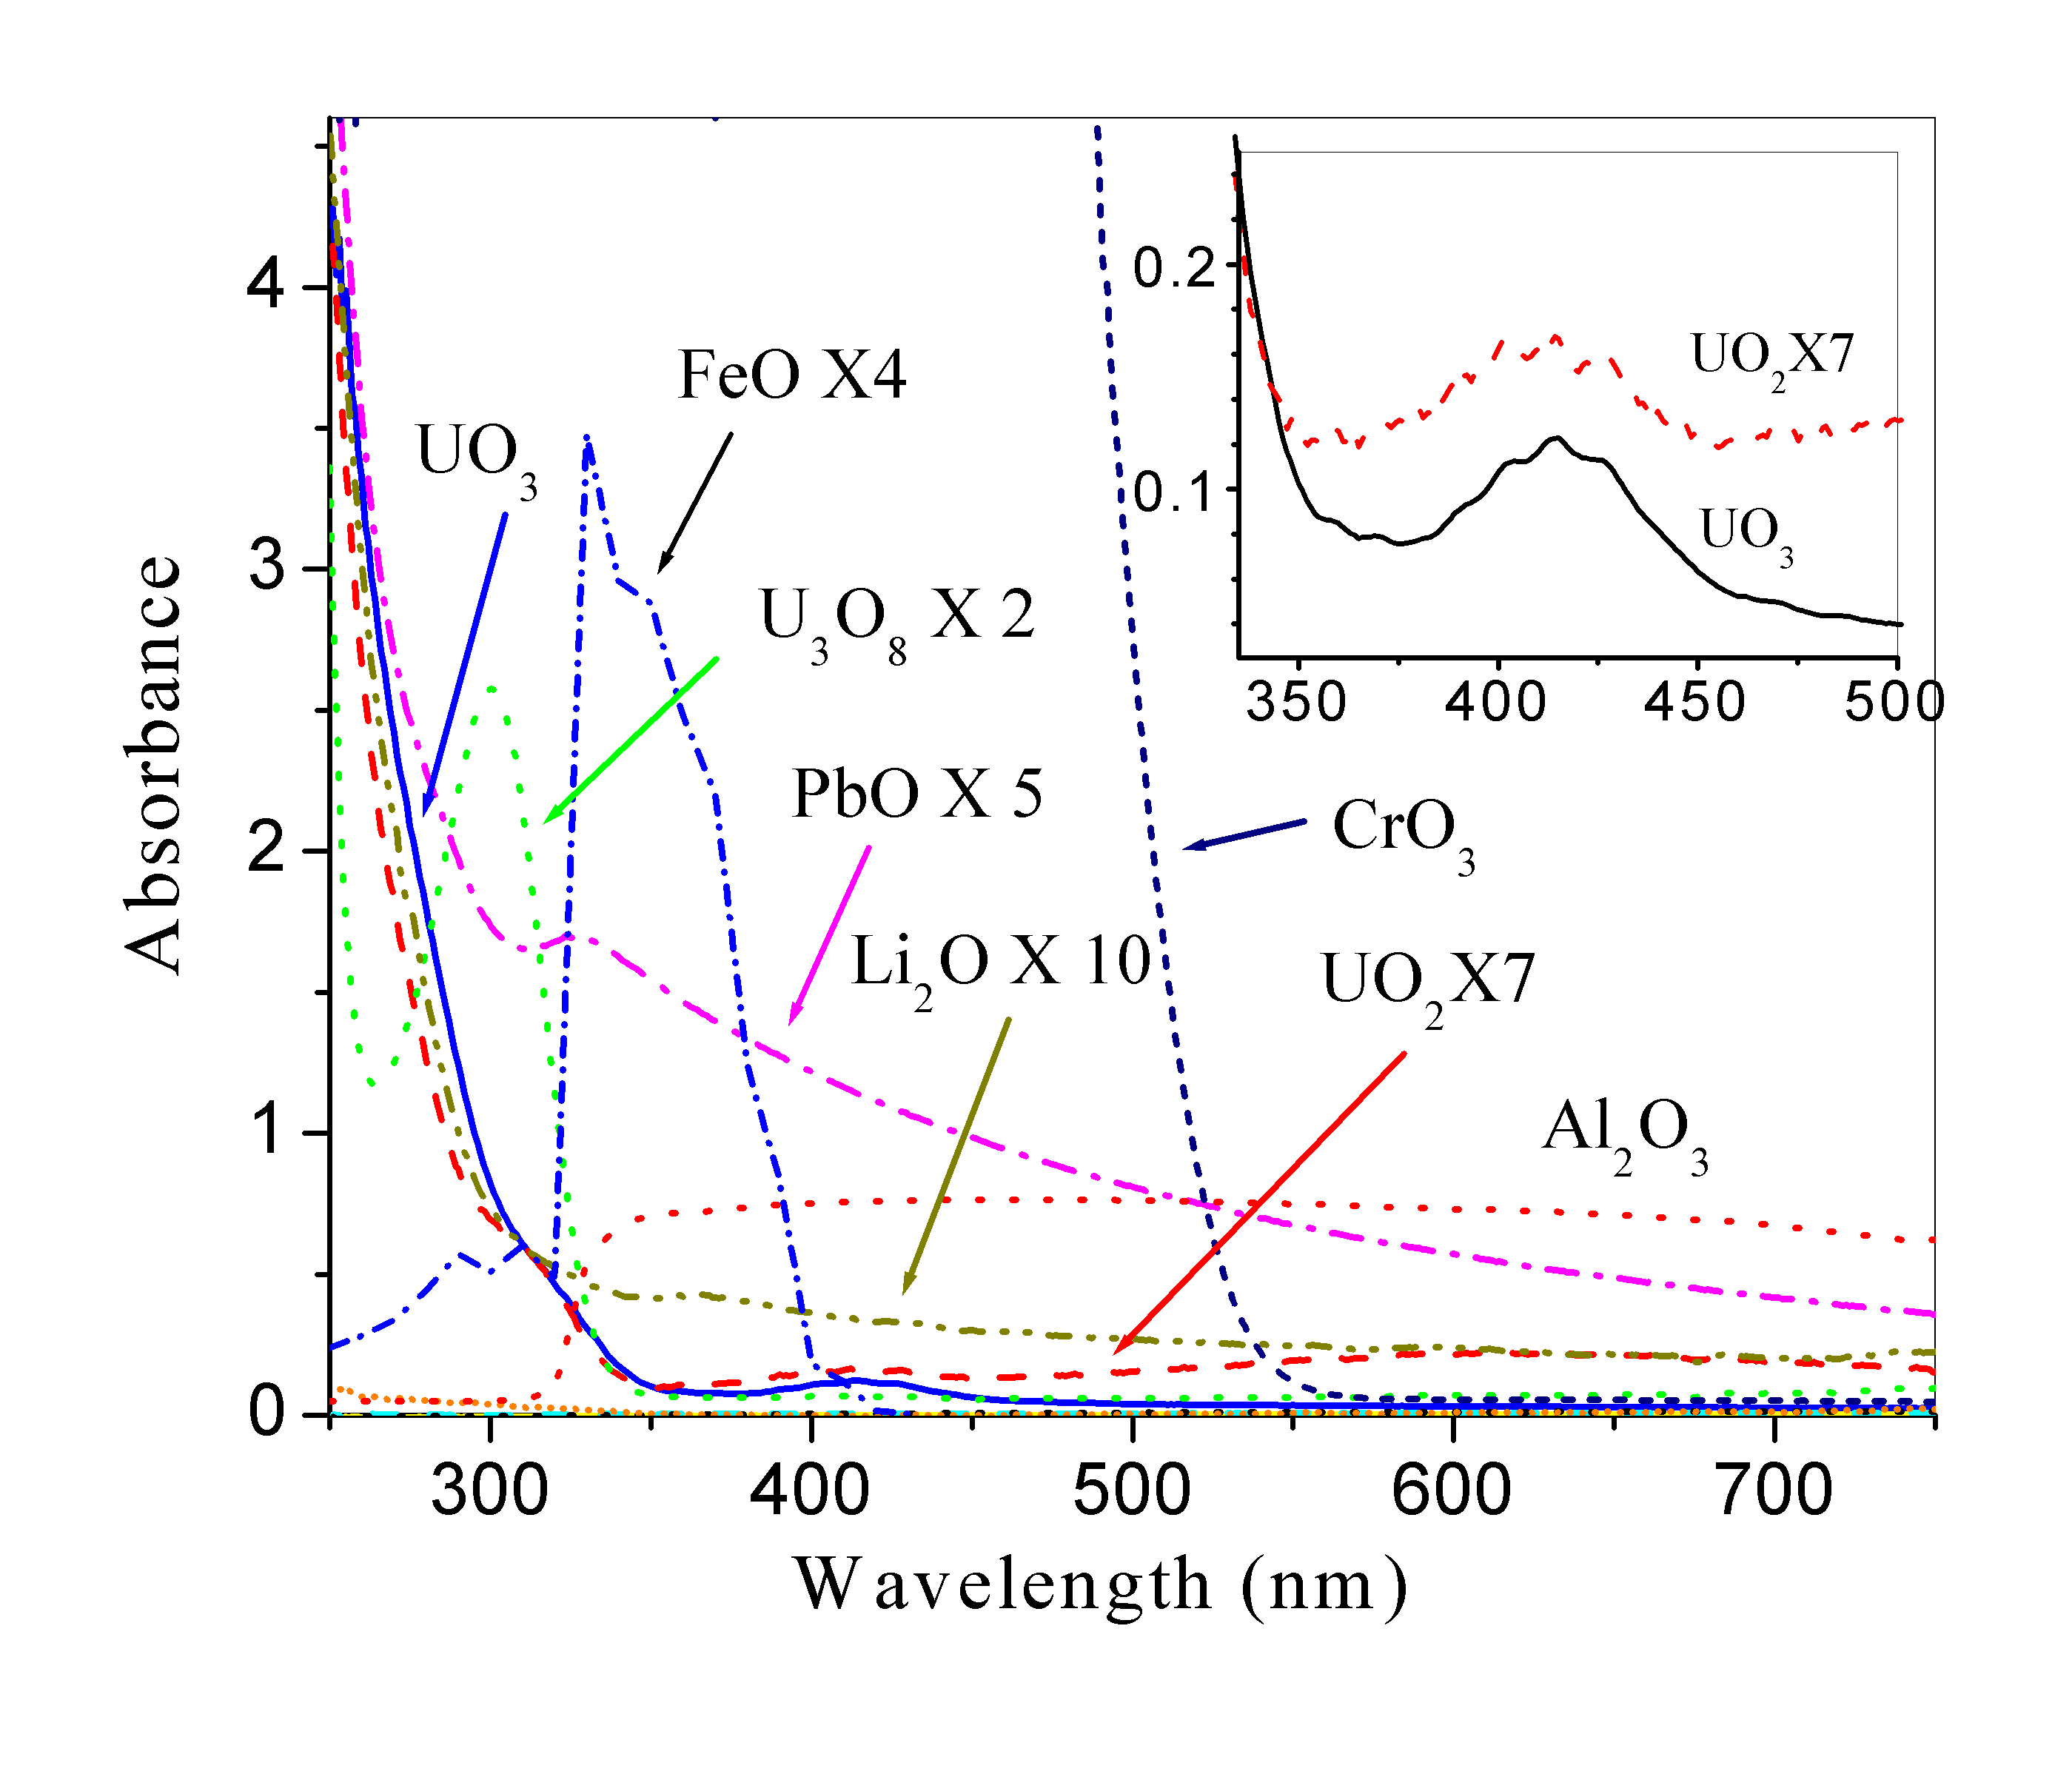
Fig. 2 shows the absorption spectra of UO2, UO3, U3O8, Al2O3, CrO3, FeO, Li2O, and PbO. All the spectra have subtracted the absorption of the corresponding solvent (HNO3). As most of the materials are not solvuable in water, the HNO3 was selected as the solvent. However, HNO3 may cause the samples to be further oxidized. Therefore, the absorption spectra we observed here were the data from their corresponding cations like uranyl cations (UO2+2) of U3O8 and UO3 in a nitric acid solution.
Most of these materials have high absorption in the UV wavelength range, especially for wavelength shorter than 350 nm. Hardly any obvious absorption was found for the CaO, CdO, Cr2O3, Fe2O3, PbO2, and Pb3O4 solution within the 250 nm - 750 nm range. For UO2 and UO3, there is a weak blue absorption band from 350 to 500 nm (shown in the inset of Fig.2.) confirming previous report on the absorption of different uranium (VI) speciations (Meinrath G., 1997, 1998).
The observation of the absorption spectra of these materials is useful in selecting an optimized excitation wavelength with two criteria. First, it should efficiently excite the uranium to the excited electronic energy-state and leading to strong fluorescence emission from these particles. Second, the excitation wave should cause weak fluorescence emission from other materials. For uranium, regardless of its form (atomic, oxidized, ionic, or compounded), it always emits the characteristic green fluorescence band, when it is optically excited by a UV laser (e.g. 266 nm and 355 nm, Moulin et al, 1998 and Scapolan et al, 1997; 337 nm, Deniau et al, 1993 and Brian et al, 1992; 365 nm, Sugitani et al, 1980), or even by an X-ray (Hunter, 1998), although difference does occur in peak positions and/or their relative intensities from different vibrational transitions.
Other researchers have shown that the strong UV absorption band in uranium is associated with excitation from the ground state to the higher electronic states. Transition from the higher electronic states to the first excited electronic state or the ground state occurs by direct non-radiative relaxation within nanoseconds. The green fluorescence emission, from the first excited electronic state (3Pu) to the ground state (1Sg+, e.g. Meinrath G., 1997), takes sub-microsecond to several hundred microseceond in different uranium forms (e.g. Moulin et al, 1998, Meinrath G. et al, 1998). The first excited electronic state also can be directly populated through a forbidden electronic dipole transition, i.e. via the weak absorption band from 350 to 500 nm. Occupation of the first excited electronic state via this direct weak absorption band is lower than via the higher excited states. Hence, excitation through the UV absorption band is often preferred in LIF studies (Meinrath G., 1997).
In our study, the available 266 nm and 355 nm from harmonic generation of a Q-switched Nd:YAG laser is used to excite the uranium oxides and other mineral-oxides particles to search the possibility of distinguishing uranium oxides from other mineral-oxides particles by comparing their fluorescence spectra. However, most of materials have weaker absorption in the blue region than in the UV. It might be more advantageous to excite the uranium-oxide through the 420 nm band and thereby, to avoid the overlapping fluorescence spectra from the other mineral-oxide materials from being efficiently excited.
2. Fluorescence spectra of the UO2, UO3 etc. particles excited by a 266 nm and 355 nm laser
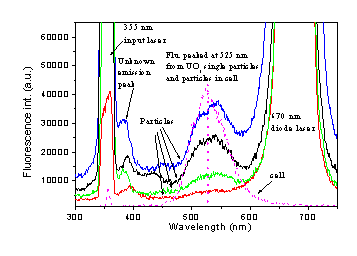
Figure 3 shows the fluorescence spectra from UO2, UO3, CaO, Li2O particles, and U3O8 in 5% HNO3 solvent excited by a 266 nm laser (50 mJ/pulse). The dashed lines show that the fluorescence peaks of UO2, UO3, and U3O8 are located within the wavelength of the two lines, and the others are out of this region. The small sharp fluorescence peaks at 266 nm and 532 nm are the scattering leakages from 4th and 2nd harmonic of the laser, respectively. It indicates that U3O8 has a strong fluorescence emission peaked at 500 nm, UO3 has a green emission with about 4 times weaker intensity centered at 540 nm, and UO2 has about 10 times weaker emission peaked around 505 nm. Li2O has an even stronger (5 times stronger than that of U3O8) fluorescence emission around 320 nm, while CaO has a blue emission around 450 nm with a similar intensity as UO3. There was barely any observable fluorescence from the other materials (Al2O3, CdO, CrO3, Cr2O3, FeO, Fe2O3, PbO, PbO2, and Pb3O4.) when they were excited by a 266 nm laser (with the same excitation energy). However, the SiO2, which forms the most component of miner sand, has a red emission (Skuja L, 1994). This result indicates that from fluorescence spectra it is possible to distinguish uranium-oxide of various forms among the other mineral-oxides.
Figure 4 shows the fluorescence spectra of UO2, UO3, Al2O3, CaO, Cr2O3, FeO, Fe2O3, Li2O, PbO, Pb3O4, particles, and U3O8 in 5% HNO3 solvent excited by a 355 nm laser (0.2 mJ/pulse). The small sharp fluorescence peaks at 355 nm and 532 nm are the scattering leakages from 3rd and 2nd harmonic of the laser, respectively. It indicates that UO3 has the strong fluorescence emission around 525 nm, and the fluorescence of UO2 peaked around 510 nm, is about 15 times weaker. The fluorescence from U3O8 is centered at 515 nm and about 26 times weaker. The fluorescence peaks from other materials all are located at a wavelength outside of the two dashed lines where the fluorescence peaks of UO2, UO3, and U3O8 are located. Other particles such as CaO and Al2O3 have similar intensity emissions as UO3, and Cr2O3, Li2O, Pb3O4 have comparable fluorescence intensity as UO2. However, their peak positions are far away from 510 and 525 nm. The spectrum from PbO with a peak around 540 nm is the closest to that from UO2. Nevertheless, the PbO peak and the UO2 peak is far enough for spectral separation. Other materials (FeO, Fe2O3) emit even weaker fluorescence at the blue region. For PbO2, CrO3, CdO, there was barely any fluorescence can be observed. It shows that uranium materials can also be distinguished from the other metal-oxide materials by the 355-nm laser excited fluorescence spectra. The interfering effect from the other metal-oxides is not likely to hamper the effort to distinguish uranium from non-uranium aerosols.
As we have mentioned above, different uranium compounds generally emit similar green fluorescence. In nature, most uranium is present in the uranyl group, such as hydrolysis and complexation of (UO22+) with carbonate, fluoride, sulfate, and phosphate ligands (e.g., UO22+, UO2OH+, UO2(OH)2, UO2(OH)3- (UO2)2(OH)22+, (UO2)3(OH)5+, (UO2)3(OH)7-, UO2CO30, UO2(NO3)26H2O, UO2C2O43H2O, UO2SO40.5H2O, H2(UO2)2(PO4)28H2O, UO2(CH3COO)22H2O, UO2(ClO4)25H2O, RbUO2(NO3)3, UO2NO3+). All these uranium materials emit fluorescence within the 470-590 wavelength range with their strongest ro-vibrational transmission around 520 nm (Deniau et al, 1993; Hunter et al, 1998; Kato et al, 1994; Meinrath, 1997; Moulin et al, 1998; Sugitani et al, 1980). The difference among them is a slight shift in peak positions and/or a small variation in relative intensities from different ro-vibrational transitions. Our fluorescence measurements obtained from the UO2, UO3 particles, as well as from U3O8 in HNO3 solvent show the similar characteristic with slight peak wavelength shift. This simplicity of fluorescence from different uranium valence states allows us to distinguish the uranium-oxide from other mineral-oxides by the LIF technique.
It might be necessary to look over the excitation spectrum to select the optimized excitation wavelength while monitoring the green fluorescence emission. We found that the fluorescence intensity of UO3 is about 5 times stronger when it is excited by the 355 nm than that by the 266 nm laser. A similar result was also found for the UO2 particles (under the same laser energy and experimental conditions). The fluorescence intensity of (UO2)3(OH)5+ has observed to be stronger when excited by 355 nm laser rather than by 266 nm laser, but it is in a revised way for UO22+ and UO2OH+ (Moulin et al, 1998). Therefore, the fluorescence might be stronger by exciting through the direct absorption band around 420 nm. Further investigation is needed for this assumption.
3. Single-shot fluorescence spectra from single UO3 particles excited by a 355 nm laser
The selection of the incident laser wavelength maximizing the green UOx fluorescence requires having an excitation-emission spectrum for each of the UOx samples. It might be necessary to look over the excitation spectrum to select the optimized excitation wavelength while monitoring the green fluorescence emission. We found that the fluorescence intensity of UO3 is about 5 times stronger when it is excited by the 355 nm than that by the 266 nm laser (for the same input energy). A similar result was also found for the UO2 particles (under the same laser energy and experimental conditions). The fluorescence intensity of (UO2)3(OH)5+ was observed also to be stronger when excited by 355 nm laser rather than by 266 nm laser, but it is reversed for UO22+ and UO2OH+ (Moulin et al, 1998). Therefore, the UOx fluorescence might be stronger by exciting the direct absorption band around 420 nm than at 355 nm or 266 nm. Further investigation is needed for this conjecture.
Figure 5 (a) shows 200 consecutive single-shot fluorescence spectra from individual flowing UO3 particles excited by the 355 nm laser. Particles are released above the inlet tube of the air-tight-box with a size about 50 mm in diameter. The corresponding typical spectral profiles are also shown in Fig. 5 (b). All these spectra have a characteristic spectral peak around 525 nm. The strong elastic-scattering of the 670 nm diode laser, used for defining the trigger volume, distorts the spectral profiles around 525 nm and make them appear red-shifted comparing to the spectrum observed from thousands UO3 particles in a cell. With a green band filter, the spectrum will improve because of the reduction of the elastic-scattering intensity at 670 nm. Obviously, the fluorescence intensity increases with the particle size, which can be deduced from the intensities of the elastic-scattering peaks at 355 and 670 nm. These characteristic UO3 fluorescence band can be detected with a good signal to noiseS/N ratio, which preliminarilyy shows that our system is sensitive enough to captured the fluorescence spectrum from single UO3 particle with a single laser-shot. The high-speed capture rate of fluorescence-spectrum by our system allows us to analyzesis the fluorescence spectrum from individual particles passing through the sample volume at a high rate (1,400 particles within one second, Ppan et. al., 2001).
With such an optical system, the mineral particles in the ambient will be drawn into the sample volume for spectral observation and detectionpre-selection. Planned future work will investigate the possibility A computer will of comparing the captured spectra in real-time compare the captured spectra with the characteristic uranium oxide spectra in its databasein real-time, and thensend a command to deflect the suspicious only the uranium bearing particles into a separate location for subsequent detailed analysis, possibly using on-line instruments.but not all the other non-uranium oxide particles. The pPreliminary results presented here shows that it is possible to distinguish uranium particles from the most common mineral oxides particles down to several ten microns by measuring their single-shot, single-particle fluorescence spectra.
Acknowledgment
We gratefully acknowledge the financial support from the Department of Energy (through Education R&D Association of Georgia University, GA0051-1).
References
- Brina, R., and Miller, A. G., (1992). Direct Detection of Trace Levels of Uranium by Laser-induced Kinetic Phosphorimetry, Anal. Chem., 64:1413-1418.
- Deniau, H., Decambox, P., Mauchien, P., and Moulin, C., (1993). Time-resolved Laser-induced Spectrofluorometry of (UO2) 2+ in Nitric-acid Ssolutions-premilinary-results for Online Uranium Monitoring Applications, Radiochimica Acta, 61 (1):23-28.
- Hunter, D. B., and Bertsch, P. M., (1998). In situ Examination of Uranium Contaminated Soil Particles by Micro-X-ray Absorption and Micro-fluorescence Spectroscopies, J. Radioanaly. Nuclear Chem., 234 (1-2):237-242.
- Kato, Y., Meinrath, G., Kimura, T., and Yoshida, Z., (1994). A Study of U(VI) Hydrolysis and Carbonate Complexation by Time-resolved Laser-induced Fluorescence spectroscopy (TRLFS), Radiochimica Acta, 64 (1):107-111.
- Meinrath, G., (1997). Uranium (VI) Speciation by Sspectroscopy, J. Radioanaly. Nuclear Chem., 224 (1-2): 119-126.
- Meinrath, G., (1998). Chemometric Aanalysis: Uranium (VI) Hydrolysis by UV-Vis Sspectroscopy, J. Alloys Compounds, 275-277: 777-781.
- Meinrath, G., Kato, Y., Kimura, T., and Yoshida, Z., (1998). Stokes Relationship in Absorption and Fluorescence Spectra of U(VI) Species, Radiochimica Acta, 82 (1):115-120
- Moulin, C., Laszak, I., Moulin, V., and Tondre, C., (1998). Time-resolved Laser-induced Fluorescence as a Unique Tool for Low-level Uranium Speciation, Appl. Spectrosc., 52 (4): 528-535.
- Pan, Y. L., Cobler, P., Potter, A., Chou, T., Chang, R. K., Pinnick, R. G., Hill, S. C., and Wolf, J. P., (2001). High-peed, High-sensitivity Aerosol Fluorescence Spectrum Detection Using a 32-anode Photomultiplier Tube Detector, Rev. Sci. Instru., 72: 1831.
- Pan, Y. L., Holler, S., Chang, R. K., Hill, S. C., Pinnick, R. G., Niles, S., Bottiger, J. R., (1999). Single-shot Fluorescence Spectra of Individual Micro-sized Bioaerosols Illuminated by a 351 nm or 266 nm Laser, Opt. Lett., 24 (2): 116-119.
- Premadas, A., and Srivastrava, P. K., (1999). Rapid Laser Fluorometric Method for the Determination of Uranium in Soil, Ultrabasic Rock, Plant Ash, Coal Fly Ash and Red Mud Samples, J. Radioanaly. Nuclear Chem., 242 (1): 23-27.
- Scapolan, S., Ansoborlo, E., Moulin, C., and Madic, C., (1997). Uranium Sspeciation in Biological Medium by Means of Capillary Electrophoresis and Time-resolved Laser-induced Fluorescence, J. Radioanaly. Nuclear Chem., 226 (1-2):145-148.
- Skuja L., (1994). The Origin of the Intrinsic 1.9 eV Luminescence Bands in Glassy SiO2. J. Non-Crystal. Solids, 179 (1): 51-69
- Smith, B. W., Quentmeier, A., Bolshov, M., and Niemax, K., (1999). Measurement of Uranium Isotope Ratios in Solid Samples Using Laser Ablation and Diode Laser-excited Atomic Fluorescence Spectrometry, Spectrochimica Acta B., 54:943-958.
- Sugitani, Y., Nomura, H., and Nagashima, K., (1980). A Photoacoustic and Fluorescent Spectroscopic Study of Uranyl Compounds, Bull. Chem.. Soc. Jpn., 53: 2677-2678.
Figure
1. Schematic of the experimental setup used for measuring single-shot
laser-induced fluorescence spectra from single flowing UO3
particles. The Q-switched UV laser is on-demand triggered
when a particle was passing through both diode lasers.
The fluorescence is collected by the reflecting objective
and focused onto the input slit of the spectrograph for
dispersion, and recorded with an ICCD or 32-anode PMT.
The particles for fluorescence measurement are drawn by
the lower pressure within the air-tight-box, which is
evacuated by a pump.
Figure
2. Absorption spectra of 0.1% UO2, UO3, U3O8,
Al2O3, CrO3, FeO, Li2O and
PbO in HNO3 solution. All the spectra have subtracted absorption
of the corresponding solvent (HNO3).
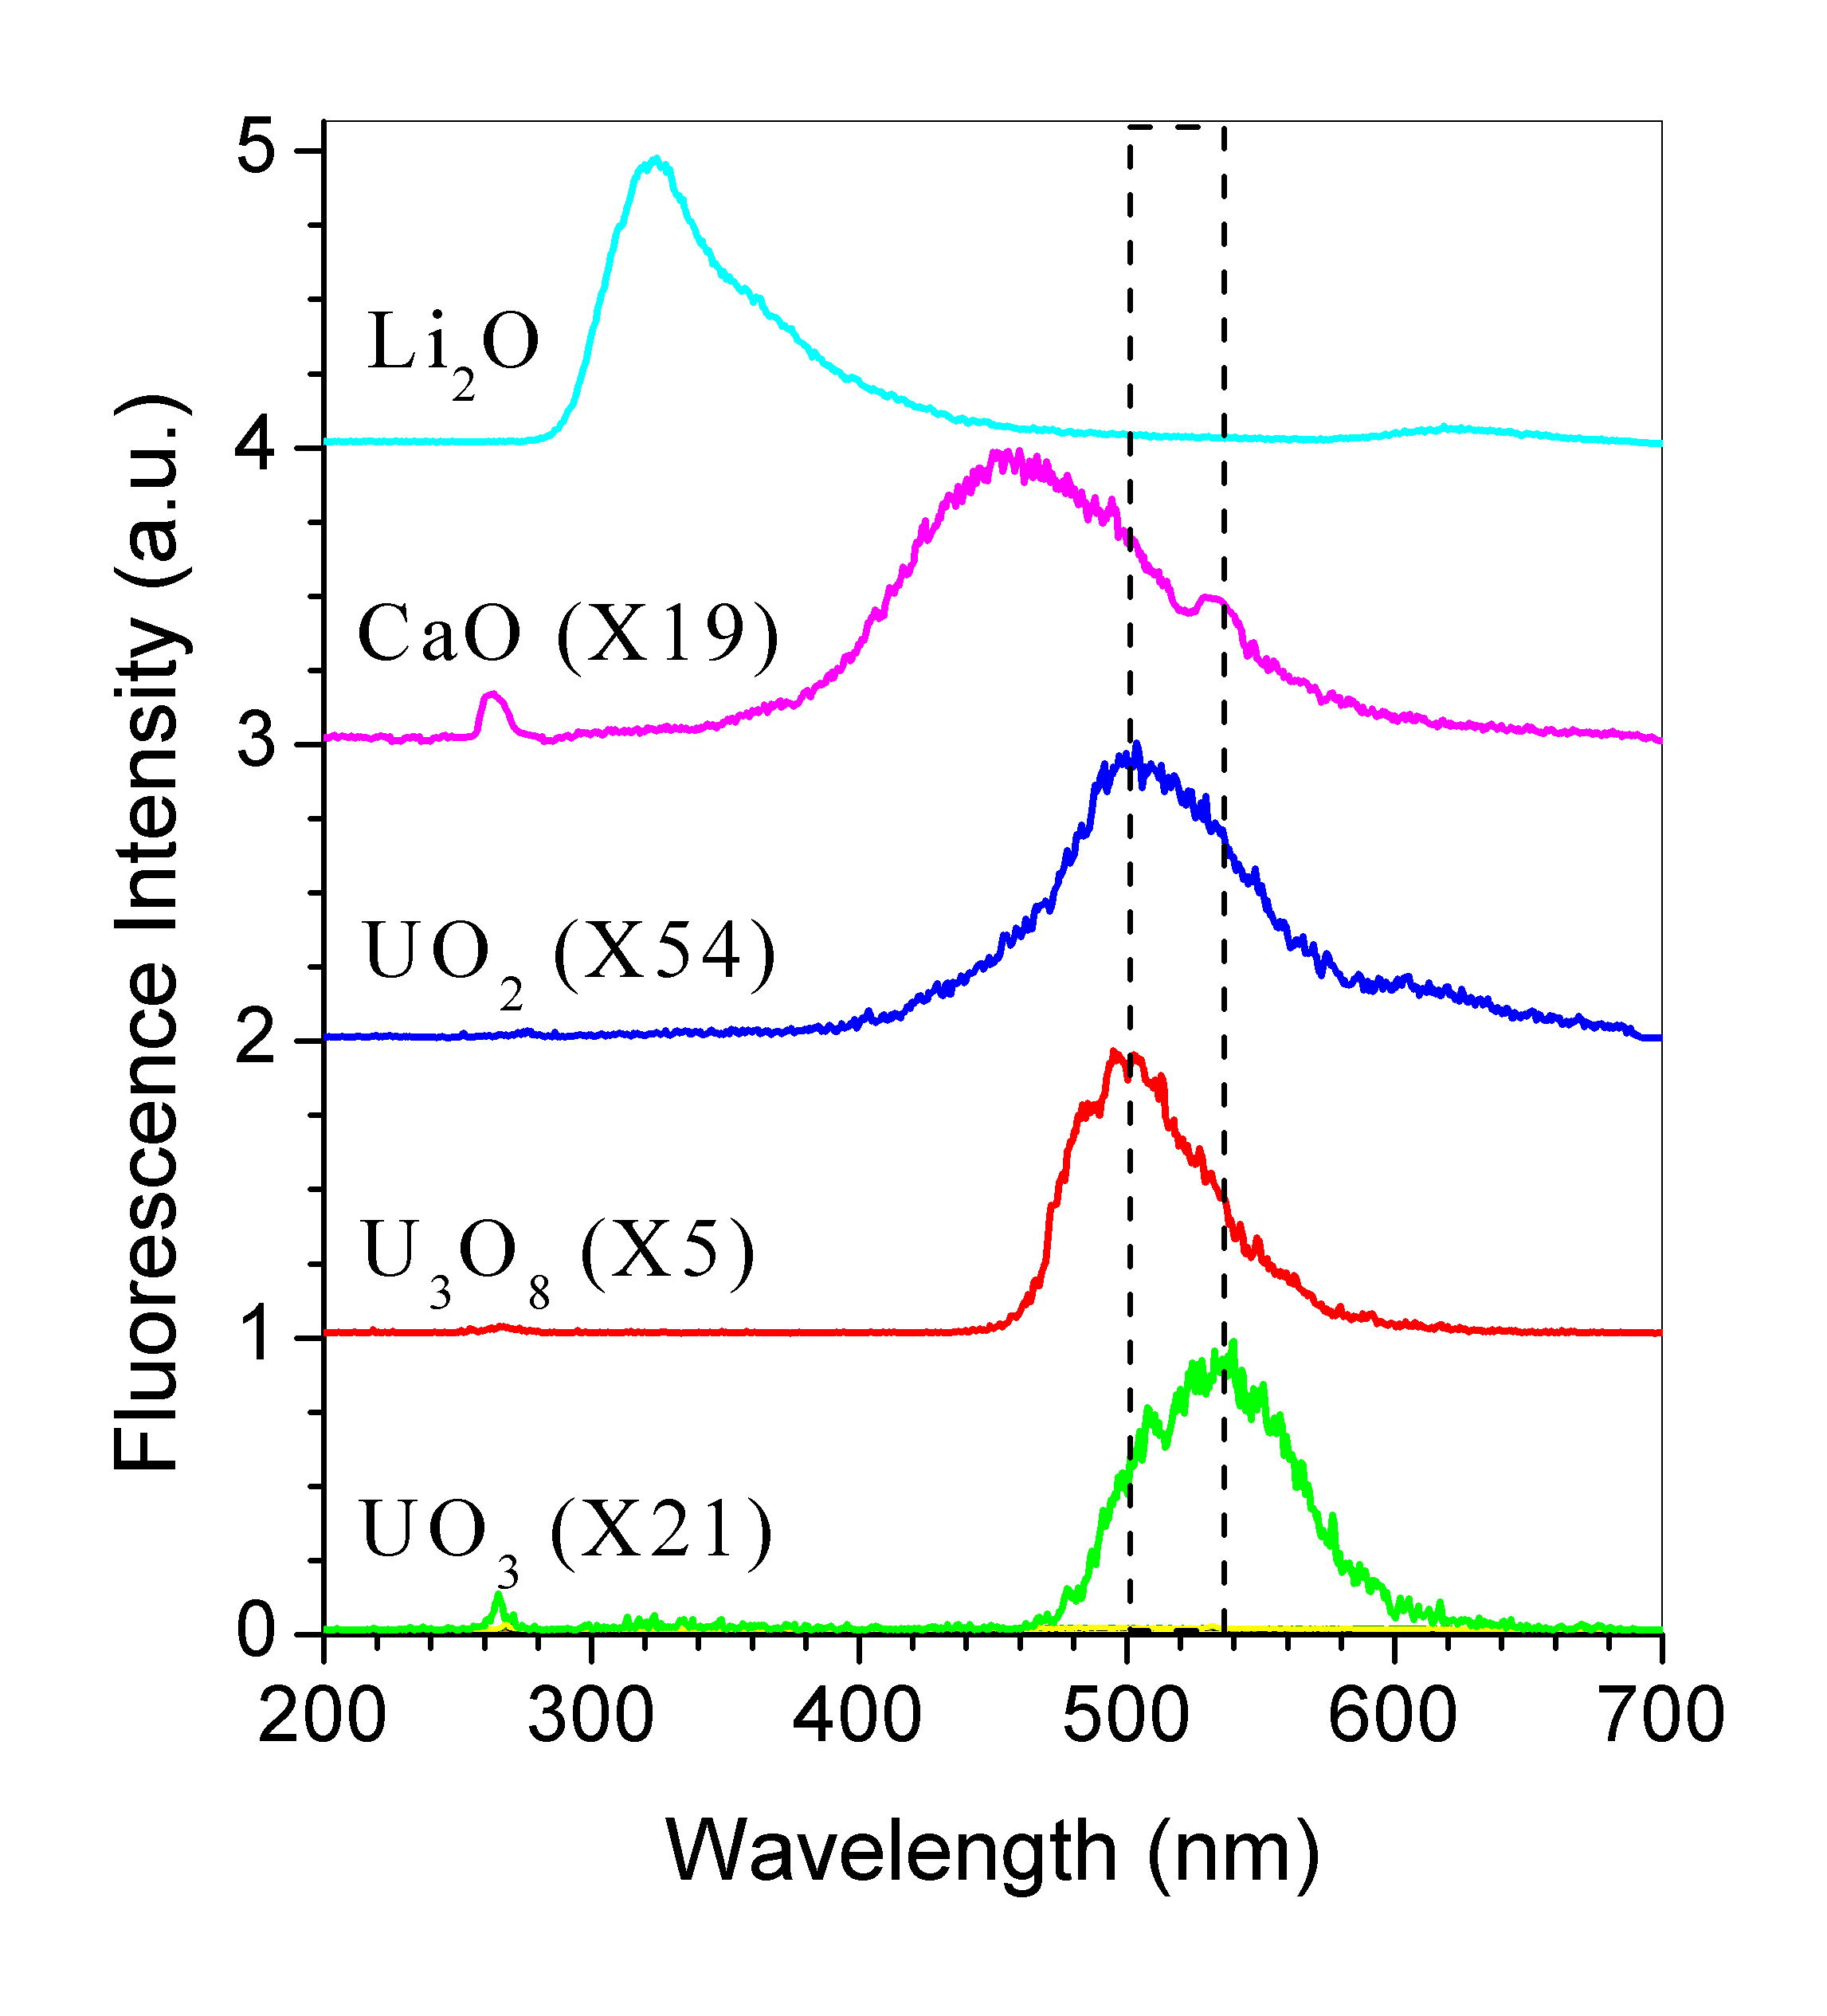
Figure
3. Fluorescence spectra of UO2, UO3, CaO, Li2O
particles, and
U3O8 in 5% HNO3 solvent excited by a
266 nm laser.
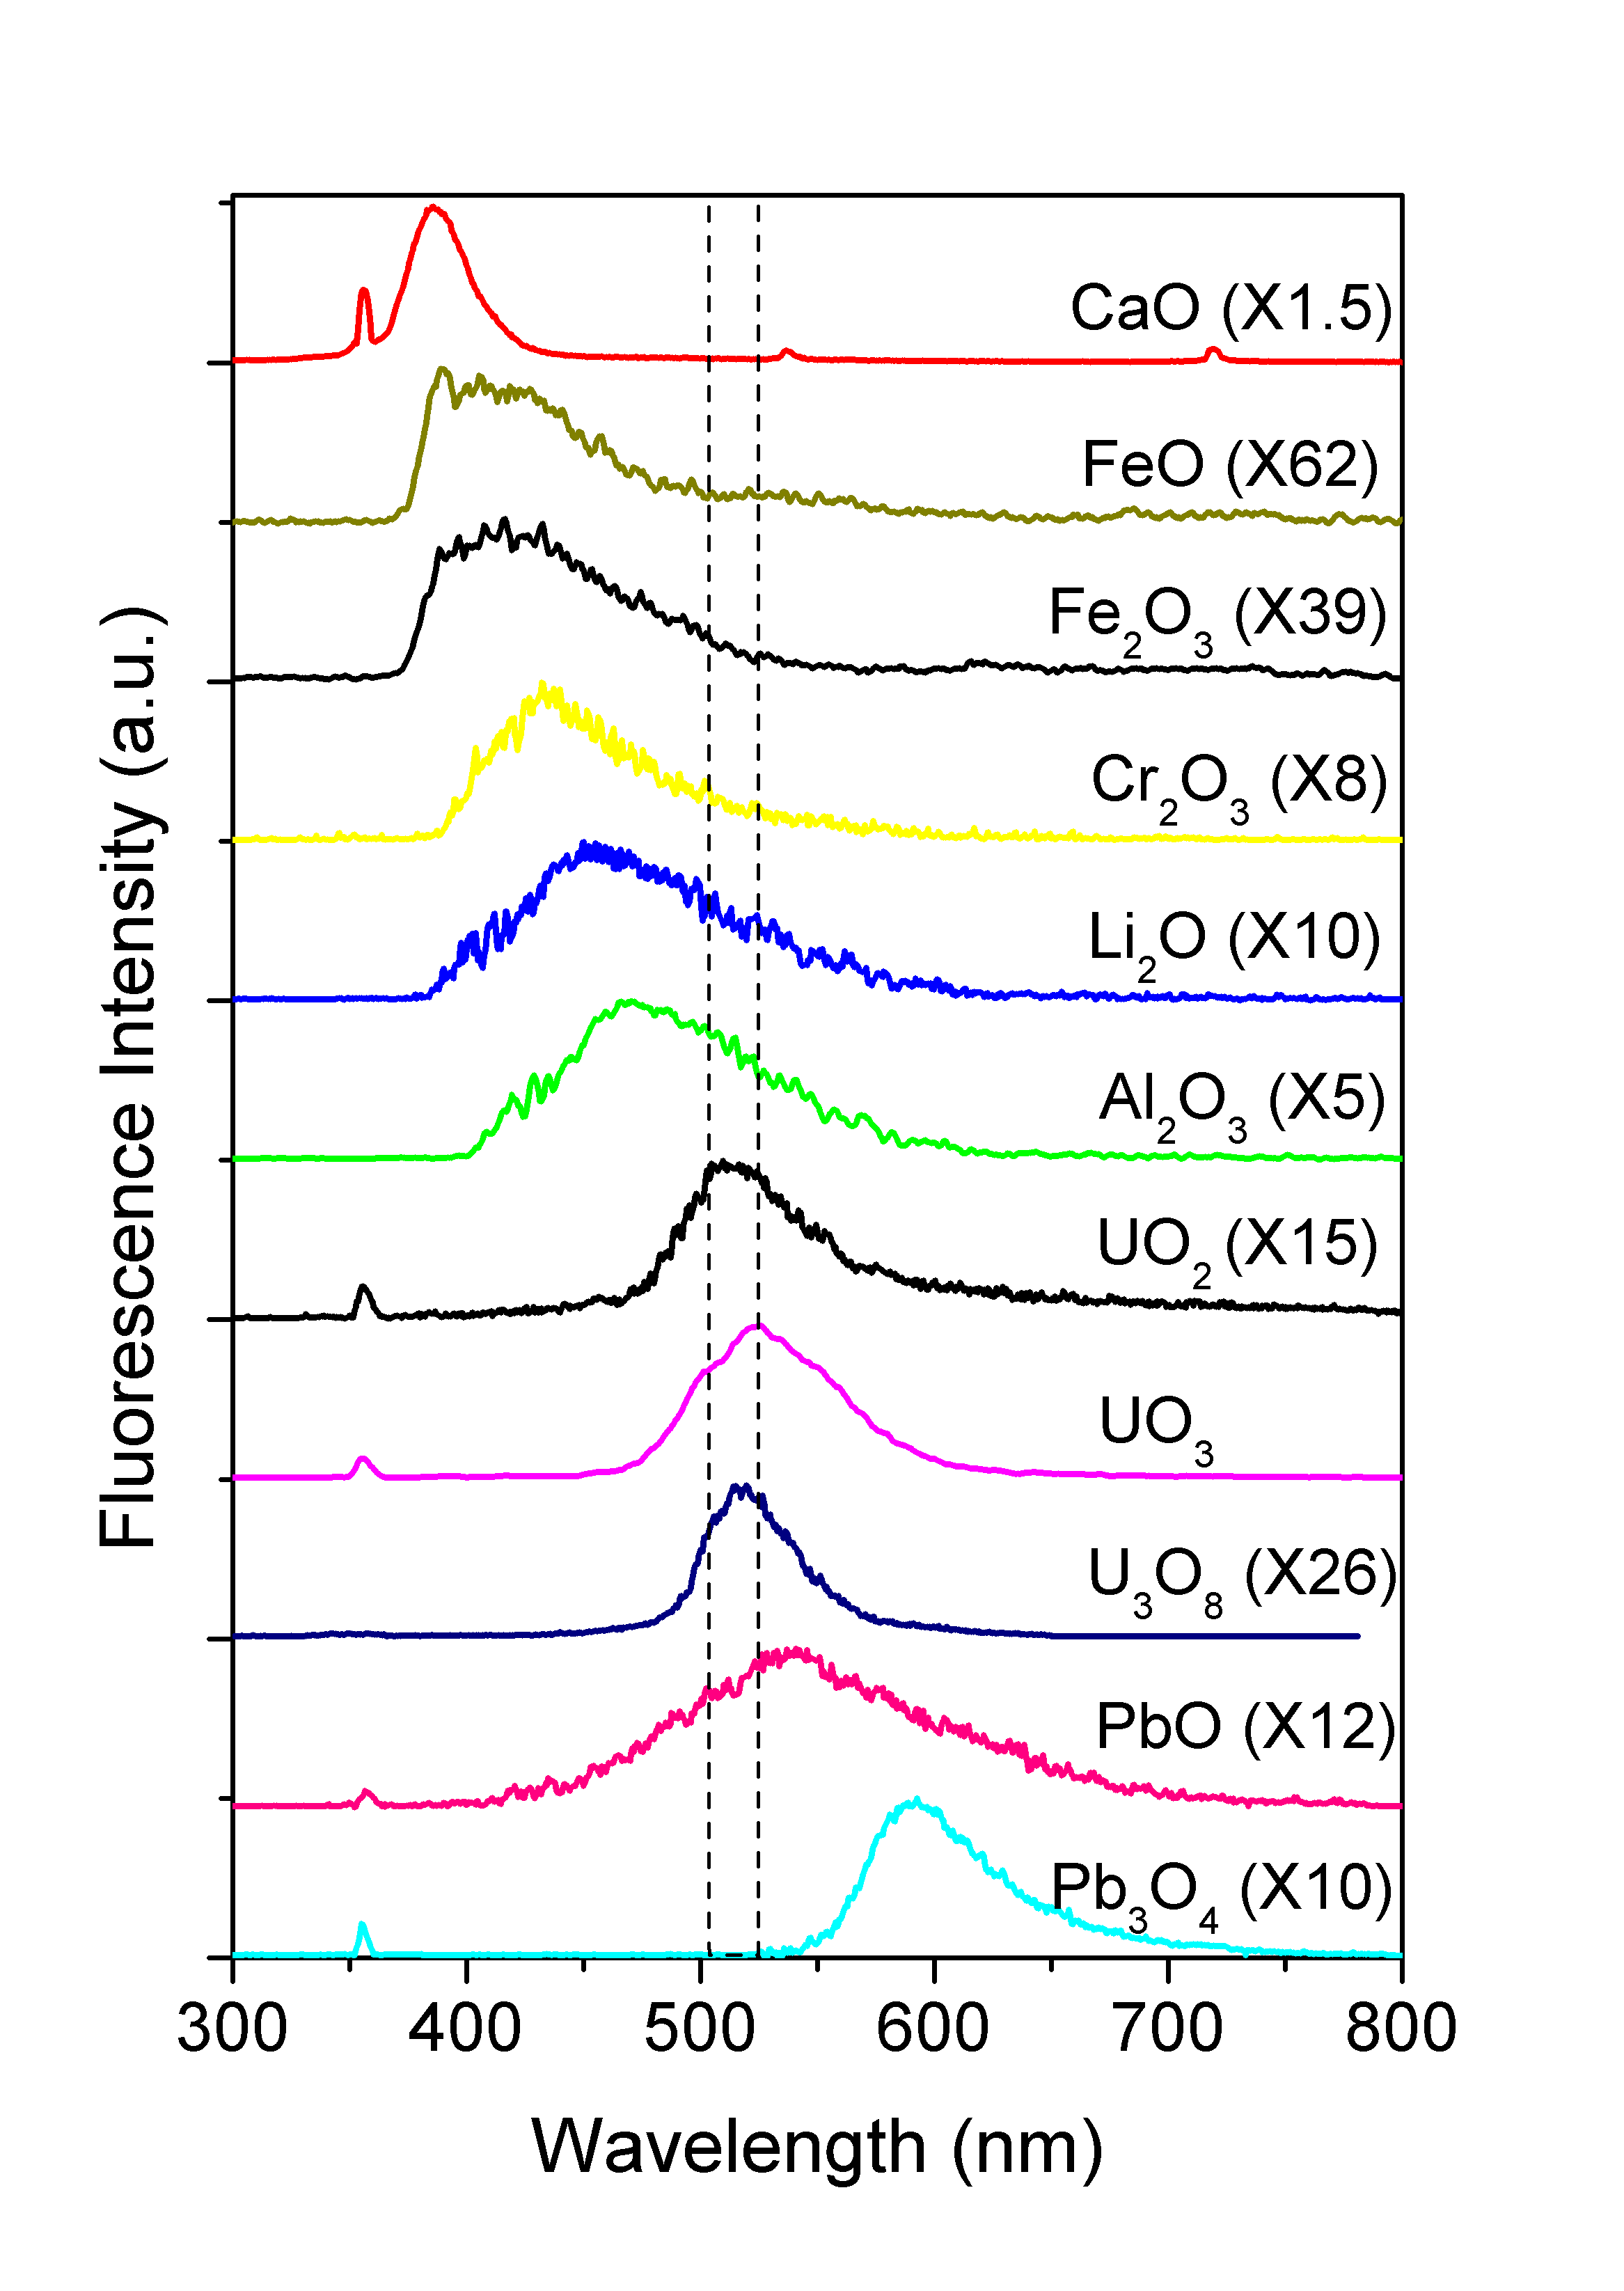
Figure 4. Fluorescence spectra of UO2, UO3, Al2O3, CaO, Cr2O3,
FeO, Fe2O3, Li2O, PbO, Pb3O4 particles, and
U3O8 in 5% HNO3 solvent excited by a
355 nm laser.
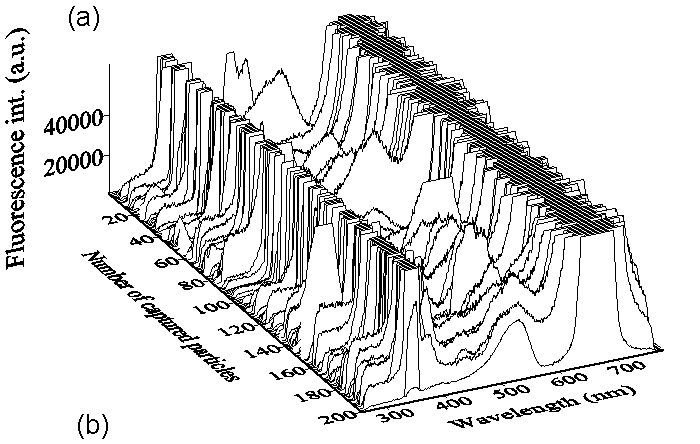
Figure
5. (a) 200 consecutive single-shot fluorescence spectra from single
flowing UO3 particles (about 50 mm in diameter)
excited by the 355 nm laser. (b) The corresponding
typical spectral profiles at different particle size.