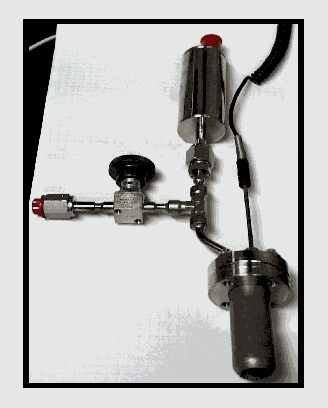
Figure 1. Test Apparatus used to Measure Gas Generation rates for PuO2.
WSRC-MS-2002-00705
Gas Generation Testing of Plutonium Dioxide
Jonathan M. Duffey and Ronald R. Livingston
Westinghouse Savannah River Company
Aiken, SC 29808
This report was prepared as an account of work sponsored by an agency of the United States Government. Neither the United States Government nor any agency thereof, nor any of their employees, makes any warranty, express or implied, or assumes any legal liability or responsibility for the accuracy, completeness, or usefulness of any information, apparatus, product or process disclosed, or represents that its use would not infringe privately owned rights. Reference herein to any specific commercial product, process or service by trade name, trademark, manufacturer, or otherwise does not necessarily constitute or imply its endorsement, recommendation, or favoring by the United States Government or any agency thereof. The views and opinions of authors expressed herein do not necessarily state or reflect those of the United States Government or any agency thereof.
This report has been reproduced directly from the best available copy.
Available for sale to the public, in paper, from:
U.S. Department of Commerce, National Technical Information Service, 5285
Port Royal Road, Springfield, VA 22161,
phone: (800) 553-6847,
fax: (703) 605-6900,
email: orders@ntis.fedworld.gov
online ordering: http://www.ntis.gov/help/index.asp
Available electronically at http://www.osti.gov/bridge
Available for a processing fee to U.S. Department
of Energy and its contractors, in paper, from:
U.S. Department of Energy, Office of Scientific and Technical Information, P.O.
Box 62, Oak Ridge, TN 37831-0062,
phone: (865 ) 576-8401,
fax: (865) 576-5728,
email: reports@adonis.osti.gov
Abstract
Hydrogen and oxygen gas generation rates were measured for purified plutonium oxide (PuO2) powder as a function of water content, specific surface area (SSA), dose rate, and initial fill gas composition. Gas generation rates were found to increase with water content and dose rate and to decrease with specific surface area for given water content. Hydrogen generation rates were similar in air, nitrogen and argon, but oxygen generation rates were greater in nitrogen and argon than in air. The potential for reaching a steady state container pressure for PuO2 of given calcination temperature (i.e., SSA) and water content was evaluated by adding hydrogen to some test vessels and monitoring the effect on container pressure over time.
I. Introduction
Hydrogen gas generated from decomposition of water adsorbed on plutonium-bearing oxides is described by DOE-STD-3013-2000 as the largest contributor to container pressurization during fifty years of storage.1 The DOE-STD-3013-2000 (STD-3013) limits oxide contents to 0.5 wt.% water. Based on an analysis of hydrogen generation under bounding conditions for container pressurization, the 3013 container is designed to safely contain gas pressures of 4927 kPa (699 psig).
Operating experience at many DOE plutonium facilities shows that plutonium-bearing oxide materials prepared under conditions less rigorous than imposed by the STD-3013 typically do not pressurize storage containers.2 These observations suggest that the volumes and rates of gas generation for these contents are sufficiently small to prevent container pressurization even after storage for many years. Consequently, the complete decomposition of water evaluated by the STD-3013 is not anticipated to occur during storage of stabilized oxides. This discontinuity between observed and theoretical hydrogen pressure has led to the present investigation of gas generation from radiolysis of water adsorbed on plutonium dioxide (PuO2).
Hydrogen gas generation from radiolysis of water contained in plutonium-bearing materials has been described in reports dating back to the 1960s.3 These studies frequently focus on establishing process conditions required to minimize the water content of plutonium products. However, no systematic evaluation to determine the impact of key parameters like water content, specific surface area (SSA), dose rate, or initial gas composition on gas generation rates has been identified. Consequently, the Savannah River Technology Center (SRTC) is researching the effects of these variables on gas generation for PuO2 storage. These test results support both transportation and storage activities where concerns arise surrounding the potential loss of containment due to excessive pressure or flammability of hydrogen-air mixtures.
II. Experimental
The gas generation tests at SRTC were conducted using pure PuO2 derived from thermal decomposition of plutonium(III) oxalate following purification by anion exchange and oxalate precipitation. Plutonium materials with two different isotopic compositions (i.e., weapons grade (WG) and fuel grade (Mk42)) were processed in this manner to provide materials with different dose rates (Table I).
Table I. Isotopic Compositions and Decay Energies of PuO2
used in Gas Generation Tests.
|
Material |
Pu Isotopic Composition |
Decay |
||||
|
238 |
239 |
240 |
241 |
242 |
(MeV s-1 g-1)
|
|
|
WG |
0.013 |
93.6 |
6.2 |
0.15 |
0.02 |
(1.42 ± 0.01) x 1010 |
|
Mk42 |
0.096 |
83.8 |
15.3 |
0.81 |
0.02 |
(2.04 ± 0.05) x 1010 |
The SSA of the PuO2 was varied by thermal treatment (calcination) at three different temperatures. SSA decreases with increasing calcination temperature4 All materials were initially calcined for 4 h at 450°C. Approximately one half of the WG oxide was calcined an additional 2 h at 700°C. The Mk42 oxide was divided into three equal portions after the initial calcination period. One third was calcined an additional 2 h at 700°C and one third an additional 2 h at 950°C. Water content was varied by exposure of the PuO2 to controlled relative humidity (RH) conditions. Samples of PuO2 were stored in sealed containers containing distilled water (100% RH), or saturated salt solutions of NaCl (76% RH) or MgCl2·6H2O (33% RH).5 Different RH levels were employed to help control the rate of water adsorption by PuO2. The amount of water adsorbed during storage was tracked by weight change of the PuO2 sample. Water content was estimated by loss on ignition (LOI) at 950°C using thermogravimetric analysis (TGA) before and after water adsorption. The estimated precision (2 sigma) of this measurement was approximately ± 0.4 wt% for the WG oxide. For the Mk42 oxide moisture measurements, the TGA instrument performance was improved and the estimated precision improved to ± 0.2 wt.%. In either case, the loss on ignition measurement is not specific for water and may overestimate the water content if other volatile impurities are present.
The PuO2 samples (nominally 9.0 g) with the desired water contents were loaded into leak-tight stainless steel vessels equipped with Sensotec pressure transducers (0 to 50 psig or 0 to 100 psig) and type J thermocouples (Fig. 1). The gas volume was nominally 25 mL for each test. Tests were run with air, argon, or nitrogen as the initial headspace gas. The pressure and temperature in the sample containers were measured at regular time intervals and recorded using a computerized data acquisition system (LabView). Test duration usually ranged from 200 h to 400 h. Tests were concluded by sampling the headspace gas from each container for gas chromatographic analysis. The change in gas composition between start and end of the test was used to calculate hydrogen and oxygen generation rates. Between tests with a particular sample, the sample container was evacuated briefly, flushed with the next fill gas, then back-filled to the desired pressure with the next fill gas. In addition to measuring gas generation rates, the potential for reaching a steady state container pressure for PuO2 of given calcination temperature (i.e., SSA) and water content was evaluated. This was accomplished by adding hydrogen to some test vessels and monitoring the effect on container pressure over time.

Figure 1. Test Apparatus used to Measure Gas Generation rates for PuO2.
III. Results and Discussion
III.A. Results for Weapons Grade PuO2
Table II summarizes the results of gas generation tests with weapons grade (WG) PuO2. Immediately following calcination and prior to exposure to humid conditions, the 450ºC and 700ºC oxides were found to have water contents of 2.0 wt.% LOI and 1.0 wt.% LOI, respectively. After exposure to 100% RH conditions for several days, the water content of the 450ºC oxide increased to 3.5 wt.% LOI and that of the 700ºC oxide to 2.0 wt.% LOI. The decreased water adsorption by the 700ºC oxide as compared to the 450ºC oxide is attributed to the decrease in SSA following calcination at the higher temperature.
The hydrogen and oxygen generation rates are plotted as a function of percentage LOI (i.e., water content) in Figures 2 and 3, respectively. For a given calcination temperature (i.e., SSA), both the hydrogen and oxygen generation rates increased in a nearly linear fashion with increasing water content. At the same percentage LOI (e.g., 2.0 wt.%), both hydrogen and oxygen generation rates were greater for the 700ºC calcined material (lower SSA) than for the 450ºC calcined material (higher SSA). Thus, gas generation rates are a function of SSA as well as water content.
Table II. Results of Gas Generation Rate Measurements for
Weapons Grade PuO2.
|
Calcination Temperature |
Water Content by LOI |
|
Number of Replicates |
Average H2 Generation Rate |
Average O2 Generation Rate |
|
450 |
2.0 |
air |
2 |
1.5 ± 0.1 |
-3.4 ± 1.2 |
|
450 |
3.0 |
air |
2 |
7.3 ± 0.7 |
1.7 ± 1.6 |
|
450 |
3.5 |
air |
4 |
10.6 ± 1.3 |
8.2 ± 1.9 |
|
700 |
1.0 |
air |
2 |
0.46 ± 0.04 |
-3.9 ± 1.2 |
|
700 |
1.3 |
air |
2 |
3.7 ± 1.0 |
-1 ± 3 |
|
700 |
2.0 |
air |
4 |
17.2 ± 1.6 |
6.5 ± 1.6 |
|
Blankb |
N/A |
Air |
7 |
Not Detected |
-0.2 ± 1.9 |
Water adsorption on PuO2 occurs in a stepwise fashion until as many as 10 monolayers have accumulated.6 For a given amount of adsorbed water, the number of water layers on the PuO2 surface is inversely proportional to the SSA. The initial adsorbed water layers are tightly bound to the oxide surface and subsequent layers are progressively less tightly bound. Therefore, the observed increase in gas generation rate with decreased SSA for a given water content suggests that the gas generation rates are a function of the number of adsorbed water layers, not simply the mass fraction of adsorbed water. Plans are in place at SRTC to install a surface area analyzer that will allow us to better understand the relationship between gas generation rates and layers of adsorbed water. The relationship between gas generation rate and number of water layers is discussed more fully in a companion paper in this symposium series.7
While some hydrogen generation was observed for all test cases, the oxygen concentration was found to decrease for both 450ºC and 700ºC oxides at the lowest water contents (i.e., 2.0% and 1.0%, respectively). Above some threshold water content (i.e., 2.5% for 450ºC oxide and 1.4% for 700ºC oxide), oxygen generation was observed for both materials (Figure 3). At the highest water contents, hydrogen and oxygen were generated in approximately stoichiometric amounts (i.e., H2 + ½O2). These results suggest that 3013 contents packaged following calcination at lower temperature or with up to 1% LOI may not compromise the inert gas used to prevent formation of flammable gas mixtures.
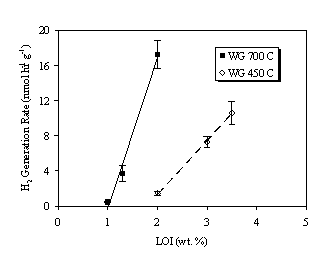
Figure 2. Hydrogen Generation Rate in Air Over Weapons Grade PuO2.
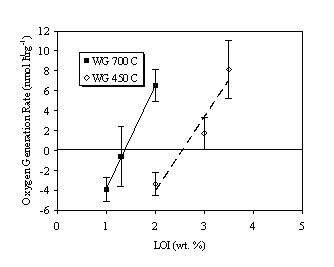
Figure 3. Oxygen Generation Rate in Air Over Weapons Grade PuO2.
III.B. Results for Fuel Grade PuO2
Table III summarizes the gas generation test results with fuel grade PuO2 (Mk42). As with the WG PuO2, water adsorption by the oxide decreases with increasing calcination temperature (decreasing SSA). The hydrogen and oxygen generation rates as a function of percentage LOI are plotted in Figures 4 and 5, respectively. Again, gas generation rates increased with percentage LOI (i.e., water content) for a given calcination temperature and decreased with calcination temperature for given water content. The rates were assumed to increase linearly with water content, as was the case with the WG oxides.
Changing the initial fill gas from air to argon or nitrogen had little impact on hydrogen generation rate. However, in every case the oxygen generation rate increased on changing from air to a non-oxygen-containing atmosphere (Table III).
Table III. Results of Gas Generation Rate Measurements for
Fuel Grade PuO2.
|
Calcination Temperature |
Water Content by LOI |
|
Number of Replicates |
Average H2 Generation Rate |
Average O2 Generation Rate |
|
450 |
2.3 |
air |
3 |
3.13 ± 0.14 |
-8 ± 4 |
|
450 |
4.1 |
air |
3 |
28.5 ± 1.8 |
11.2 ± 0.7 |
|
450 |
4.1 |
Ar |
3 |
25.0 ± 1.6 |
16.4 ± 1.6 |
|
700 |
0.5 |
air |
3 |
0.5 ± 0.4 |
-10 ± 3 |
|
700 |
1.3 |
air |
3 |
16.0 ± 1.3 |
2.1 ± 0.8 |
|
700 |
1.3 |
N2 |
1 |
14.4 ± 1.6 |
6.3 ± 0.3 |
|
700 |
1.3 |
Ar |
2 |
13 ± 6 |
7.2 ± 0.9 |
|
950 |
0.4 |
air |
3 |
0.14 ± 0.10 |
-5.1 ± 0.7 |
|
950 |
0.5 |
air |
2 |
0.47 ± 0.04 |
-3.72 ± 0.14 |
|
950 |
0.5 |
N2 |
1 |
0.25 ± 0.02 |
0.25 ± 0.02 |
|
950 |
0.5 |
Ar |
2 |
0.22 ± 0.02 |
0.18 ± 0.02 |
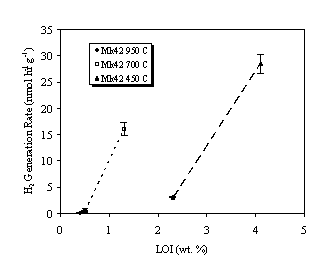
Figure 4. Hydrogen Generation Rate in Air Over Fuel Grade PuO2.
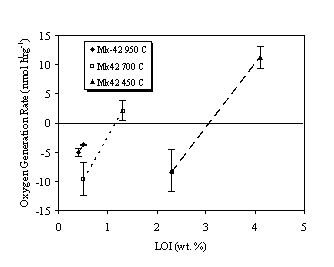
Figure 5. Oxygen Generation Rate in Air Over Fuel Grade PuO2.
Figure 6 compares the hydrogen generation rates for WG and Mk42 oxides calcined at 450ºC and 700ºC. In general, the hydrogen generation rates were greater for Mk42 oxides than for WG oxides. However, the percentage increase in hydrogen generation rate did not scale linearly with the approximate 43% increase in dose rate. This may be due to the relatively large uncertainty in the measured LOI value (i.e., ± 0.2 to 0.4 wt.%) inherent to the technique. As we have shown, hydrogen generation rates vary dramatically with small changes in LOI value. Efforts are underway at SRTC to install a TGA-mass spectrometer to improve our moisture measurement capabilities.
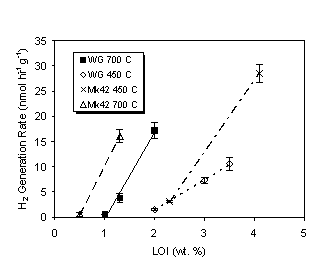
Figure 6. Comparison of Hydrogen Gas Generation
Rates for Weapons Grade and Fuel Grade PuO2.
III.C. Effect of Added Hydrogen on Container Pressurization
The potential for reaching a steady state container pressure for PuO2 of given calcination temperature (i.e., SSA) and water content was evaluated by adding hydrogen to some test vessels and monitoring the effect on container pressure over time. Figure 7 illustrates the effect of hydrogen pressure on the differential container pressure for Mk42 PuO2 calcined at 700°C with 1.3% LOI. With no added hydrogen in an initial atmosphere of argon, the container pressure increased linearly at a rate of 0.11 Torr h-1. The hydrogen pressure was increased to approximately 3500 Torr and the container pressure decreased linearly at a rate of 0.15 Torr h-1. Finally, the hydrogen pressure was reduced to approximately 1600 Torr and the container pressure decreased linearly at a rate of 0.019 Torr h-1. Similar trends were observed for WG PuO2 calcined at 450°C with 4.3% LOI; however, a greater hydrogen pressure was required to halt container pressurization. Both experiments were run in duplicate at several different added hydrogen pressures. These data were plotted as differential pressure vs. hydrogen partial pressure (Figure 8). The hydrogen pressure at which no change in pressure was observed was calculated from a linear fit of the data. Hydrogen pressures of approximately 560 kPa (82 psia) and 170 kPa (25 psia) correspond to a differential pressure of zero for the WG oxide and Mk42 oxide, respectively. These results indicate that the maximum pressures reached in the 3013 container are likely to be much less than predicted by the pressure equation in the STD-3013.
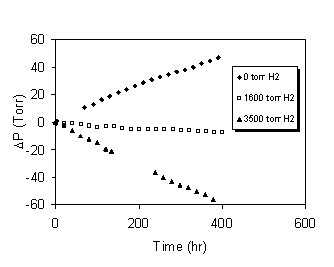
Figure 7. Effect of Added Hydrogen on Container
Pressure for 700°C Fuel Grade PuO2 with 1.3%LOI.
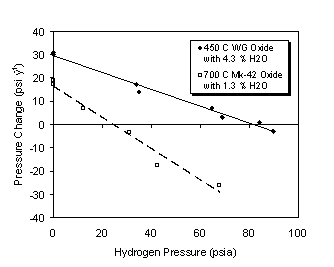
Figure 8. Differential Container Pressure as a Function of
Hydrogen Partial Pressure for Weapons Grade and Fuel Grade PuO2.
IV. Conclusions
The results of these tests demonstrate that water content, SSA and isotopic composition impact the gas generation rates associated with radiolysis of adsorbed water. The hydrogen generation rates observed for water adsorbed on PuO2 appear to be a function of the number of adsorbed water layers. At moisture contents similar to that required by the STD-3013 (i.e., < 0.5 wt.%) the hydrogen generation rates become very slow (e.g., < 0.5 nmol h-1 g-1). These measurements made at low hydrogen pressures have minimum impact from back reactions. Consequently, these measurements provide a conservative basis for modeling pressure build-up in the STD-3013.
Tests to evaluate the steady state hydrogen pressure during storage of plutonium dioxide demonstrate the impact of back reactions to limit total hydrogen pressure. Evaluation of this test data indicates that the hydrogen pressure of a 3013 container should be more closely aligned with observations from operating history in DOE plutonium facilities rather than the pressure equation presented in the current STD-3013.
Acknowledgments
This research was made possible through funding provided by the Nuclear Materials Stabilization Program Office, United States Department of Energy, Albuquerque Operations and Headquarters Offices, under the auspices of the DNFSB 94-1 Research and Development Project.
References