 (1)
(1)WSRC-MS-2002-00056
Mercury Geochemistry in a Wetland and its Implications
for In-situ Remediation
D. I. Kaplan
Westinghouse Savannah River Company
Aiken, SC 29808
J. Myers
Clemson University
Clemson, SC 29634
This report was prepared as an account of work sponsored by an agency of the United States Government. Neither the United States Government nor any agency thereof, nor any of their employees, makes any warranty, express or implied, or assumes any legal liability or responsibility for the accuracy, completeness, or usefulness of any information, apparatus, product or process disclosed, or represents that its use would not infringe privately owned rights. Reference herein to any specific commercial product, process or service by trade name, trademark, manufacturer, or otherwise does not necessarily constitute or imply its endorsement, recommendation, or favoring by the United States Government or any agency thereof. The views and opinions of authors expressed herein do not necessarily state or reflect those of the United States Government or any agency thereof.
This report has been reproduced directly from the best available copy.
Available for sale to the public, in paper, from: U.S. Department of Commerce, National Technical Information Service, 5285 Port Royal Road, Springfield, VA 22161, phone: (800) 553-6847, fax: (703) 605-6900, email: orders@ntis.fedworld.gov online ordering: http://www.ntis.gov/support/index.html
Available electronically at http://www.osti.gov/bridge
Available for a processing fee to U.S. Department of Energy and its contractors, in paper, from: U.S. Department of Energy, Office of Scientific and Technical Information, P.O. Box 62, Oak Ridge, TN 37831-0062, phone: (865 ) 576-8401, fax: (865) 576-5728, email: reports@adonis.osti.gov
Abstract
The objective of this study was to characterize the nature of Hg sorption on a wetland sediment with the intent of providing guidance for the selection of an appropriate in-situ remediation strategy. Total Hg concentrations in the sediments were as high as 10-mg/kg, whereas associated pore water Hg concentrations were below detection, <0.010-mg/L. Sediment Hg was not in an exchangeable form, and <8% of it was associated with organic matter. The remainder of the Hg was strongly associated with Fe-oxides and/or with a precipitated phase, presumably a sulfide. Sediment Hg concentrations were significantly correlated (r = 0.94) to Fe-oxide concentrations. Thermodynamic calculations based on field Eh/pH measurements and laboratory results suggest that under present field conditions meta-cinnabar (HgS) would not be stable due to the relatively low pH (~4.2) and sulfate concentrations (0.14-mM) and high Eh levels at the study site. However, these calculations indicate that meta-cinnabar may have formed when the Hg first entered the wetland at elevated concentrations (~5-mg/L). Given the ecologically sensitive nature of the wetland and the fact that the Hg is strongly bound to the sediment, it was concluded that a monitored natural attenuation approach for site remediation may be appropriate.
Introduction
Mercury (Hg) is toxic, it accumulates in biota, and it biomagnifies in the food chain. Its bioavailability and propensity to sorb to sediments is largely controlled by its oxidation state. As the oxidation state of Hg increases, the solubility of Hg generally increases; elemental Hg(0) and Hg(I) are sparingly soluble, whereas Hg(II) is highly soluble (5-g/L at 25°C). Elemental Hg(0) is rarely detected in natural waters because it is eliminated quickly from the aqueous phase due to rapid settling of its high density droplets or as a result of volatilization to Hg0(g) (Benes and Havlik 1979). Hg(I) and Hg(II) readily form inorganic complexes, but only Hg(II) can form covalent bonds with carbon to produce methyl-Hg species, the most toxic form of Hg. Wetlands contribute up to 80 times more methyl-Hg per unit area than upland terrain (St. Louis et al. 1994) and methyl-Hg concentrations correlate positively with percent wetland area in a catchment (Hurley et al. 1995). The greater amount of methyl-Hg in wetlands is attributed to the greater populations of microbes, primarily sulfur-reducing bacteria (Gilmour et al. 1992, Pak and Bartha 1998).
Wetland sediments commonly have a lower oxidation-reduction potential (ORP), or Eh, thereby promoting the reduction of Hg(II) to Hg(I) or Hg(0). Perhaps more importantly, oxidation-reduction potentials also influence Hg speciation through its affect on sulfur chemistry. Decreases in oxidation-reduction potential promote microbially mediated sulfur-reduction, which in turn promotes Hg methylation. Furthermore, the accumulation of reduced sulfur, primarily as dissolved sulfide, will precipitate inorganic Hg as a highly insoluble HgS mineral, cinnabar (red coloration) or meta-cinnabar (black and slightly more soluble). Increases in of dissolved sulfide concentrations result in decreases in Hg methylation rates because inorganic Hg is removed as a sparingly soluble solid (Gilmore et al. 1992; Paquette and Helz 1997). Finally, wetlands typically have very high concentrations of organic matter due to the slow rate of organic matter oxidative degradation occurring in this environment. The organic matter may either act as a sorbent or may provide high concentrations of dissolved ligands that form very strong complexes to Hg(II) (Cleam and Gamble 1974; Wallschlager et al. 1998b).
A pilot-scale, nuclear-research facility at the TNX site located on the Savannah River Site, Aiken, South Carolina, introduced several radionuclides and metals into an unlined seepage basin. These materials have since migrated by overland flow, subsurface flow, and a discharge gully into an adjoining wetland site (WSRC 1999). Among the contaminants that have entered the wetland area is Hg, which was introduced to the seepage basin as aqueous mercury nitrate (Figure 1). Mercury was detected in 97 of 98 sediment surface samples, ranging from 0.007 mg/kg to 30.8 mg/kg. Mercury concentrations in an adjoining uncontaminated portion of the site ranged from 0.007 to 0.12 mg/kg. A surface sediment concentration of 1-mg/kg Hg was measured as far as 300-m southwest from the point source (Figure 1).
The objective of this study was to characterize Hg sorption to TNX sediments with the intention of providing a conceptual geochemical model for use in risk assessment calculations and to provide guidance for the selection of an appropriate in-situ remediation strategy. Our approach was to characterize the sediment Hg through a series of adsorption and desorption tests. Data generated from these tests, as well as field measurements of the oxidation-reduction potential, were then used to predict Hg speciation at the contaminated site.
Materials and Methods
Sediment Characterization
Sediment samples were collected from four locations within the contaminated area of the TNX site and from one adjacent location 400-m north of the contaminated area (Figure 1). Samples A-5, B-3, and C-5 were selected because they were believed to have high Hg and radionuclide concentrations (radionuclide data is not presented). Sample D-28 was selected because it was found previously to have high Hg concentrations, yet it was far, 250-m, from the point source (WSRC 1999). None of the sample sites were submerged under water at the time of sampling. The leaf litter on the sediment surface (the O horizon) was removed prior to collecting the surface 30-cm in plastic tubes. All sediment samples were stored moist and in the dark at 4°C. Tests were conducted with moist sediment samples within 1-month of collection. Moist samples were used in an effort to minimize experimental artifacts introduced by drying sediments, such as changing Fe and Mn oxide reactivity or oxidizing (degrading) organic matter (Bartlett and James 1980). For example, drying (60°C, 24 h) river particles has been reported to cause a 92% loss of Hg (Garland and Wildung 1974). Analogous drying of sediments caused a 25% loss of Hg (Garland and Wildung 1974).
The sediments were characterized for pH in a 1:1 water-sediment slurry, organic matter by the wet digestion method (Nelson and Sommers 1996), particle-size distribution by the sieve and pipette method (Miller and Miller 1987) cation- and anion- exchange capacities by the unbuffered ammonium and chloride exchange method (Sumner and Miller 1996), and free Fe by the dithionite-citrate buffer method (Loeppert and Inskeep 1996). Semi-quantitative mineralogy was determined by x-ray diffraction analyses of the <2-m m and <0.5-m m fractions that were separated by sedimentation and then H2O2-treated to remove organic matter. X-ray diffraction was conducted on Mg-saturated samples that had been subjected to three sequential heat treatments: 16-h at 25°C, 16-h at 65°C, and then 16-h at 300°C.
Mercury Sorption to Sediment
There were three studies conducted to characterize the sorption of Hg to the TNX sediments. In the first study, the total Hg concentrations were measured as a function of sediment particle size. In the second study, a sequential extraction of Hg from the sediments was determined to provide a measure of how strongly and to which operationally defined fraction the Hg had sorbed to in the sediment. In the third study, Hg2+ (ad)sorption to an uncontaminated sediment was measured.
For the first study, Hg concentrations in three size fractions were measured by first sizing the sediment, digesting the fraction in a solution of 1 part aqua regia (1 part HNO3:3 parts HCl) and 10-parts 48% HF in a Parr Bomb at 105°C for 3-h, and then measuring the total Hg concentrations in the digest by cold-vapor atomic absorption. The three size fractions were the whole sediment, the <2-m m fraction, and the <0.5-m m fraction. The latter two fractions were collected by dispersing the sediment in 50-g/L sodium hexametaphosphate solution and then permitting the sediment to settle for a duration and a depth dictated by Stokes’ Settling Law. The settling procedure was repeated three times for each sample to ensure that a majority of the minerals of a given size fraction was collected.
Sequential extractions of the five sediments were conducted in duplicate using the four extractions described in Table 1. The first extraction was collected from a water-saturated sediment paste. The water used to create the saturated waste was collected from an uncontaminated portion of a stream located ~500-m up-gradient from the TNX site (Table 2). The saturated paste was created by slowly adding and mixing surface water to 100-g (wet wt) of sediment over a 2-day period until the paste obtained a gel-like consistency, following the procedure of Rhoades (1996). After 7-days of equilibration, the water in the paste was recovered by vacuum extraction and analyzed for total Hg. This extraction provided a measure of the sediment pore-water Hg concentrations under steady-state field conditions.
Approximately 1.3-g (wet wt) of the sediment used to create the saturated paste was transferred to a 40-mL centrifuge tube for use in the three remaining extraction steps. 30-mL of the dilute-acid extract (Table 1) was added to each tube and then the tubes were placed on a platform shaker for one day. The suspensions were centrifuged and filtered (0.45-m m) and the filtrates were analyzed for total Hg by cold-vapor atomic absorption spectroscopy. This extraction targets the exchangeable Hg fraction, exchanging Ca2+ for surface-Hg2+. Prior to the next extraction step, two 20-mL washes with 0.0125-M Ca(NO3)2 were then conducted to remove the interstitial liquid remaining in the sediment.
The next sequential extraction step involved adding 30-mL of 0.1-M sodium pyrophosphate (Na4P2O2) to each tube. The tubes were placed on a platform shaker for one day and then the suspensions were centrifuged and filtered. The filtrates were analyzed for total Hg. This extraction targets the relatively easily oxidizable fraction, which largely consists of organic matter. Two Ca(NO3)2 washes were again used to remove the interstitial liquid. The extracted sediment was washed with two 20-mL aliquots of 0.0125-M Ca(NO3)2 to remove the interstitial liquid prior to the next extraction step.
For the last step in the sequence, the solid residues remaining from the previous extractions were dried at 105 ° C until constant weight. Between 0.2 and 0.3-g of residue was transferred to a Parr Bomb Teflon container. 1-mL of aqua regia (1 part HNO3 + 3 parts HCl) and 10-mL 48% hydrofluoric acid was added to each container. The Parr Bombs were placed for 3-h in a 110°C oven. After cooling the bombs, the digests were filtered and the filtrates analyzed for total Hg.
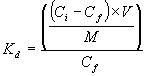
Batch tests were conducted to quantify the amount of Hg2+ that sorb to these sediments under steady state conditions. The test was conducted on the laboratory bench top, i.e., under oxidizing, or partially reducing, conditions. A 1-g aliquot of Background sediment was pre-equilibrated with three 50-mL washes of the uncontaminated surface water (Table 2) by shaking on a platform shaker overnight. The purpose of the pre-equilibration step was to isolate the Hg-sorption reaction from other reactions that may occur while sediments and solutions come to chemical equilibrium. The pre-equilibrated sediment was then put in contact with 50-mL of 0.8-mg/L Hg2+ (from Hg(NO3)2× 2H2O) prepared in the uncontaminated surface water. The suspensions were placed on a platform shaker for 1-week, after which the suspensions were centrifuged and filtered (0.4-m m). The filtrate was analyzed for total Hg by cold-vapor atomic absorption spectroscopy. These data were used to calculate distribution coefficients (Kd; mL/g) by Equation 1:
(1)
where Ci and Cf are the initial and final Hg concentrations in the aqueous phase, respectively (m g/mL), V is the volume of the Hg2+-spiked solution (mL), and M is the dry mass of sediment (g).
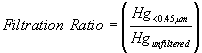
A positive control, consisting of the Hg2+-spiked solution without any sediment, and a negative control, consisting of surface water and sediment but without added Hg2+, was carried through the experiment. Results from the positive control indicated that sorption to the glassware, Hg precipitation, or Hg volatilization did not occur to a measurable degree during the experiment. Results from the negative control indicated that only negligible amounts of Hg were introduced into the system from the uncontaminated sediment and surface water. Finally, the degree to which Hg could be filtered from the spiked solutions (the positive controls) was determined. It was quantified as a filtration ratio:
 (2)
(2)
where Hg<0.45-m m and Hgunfiltered are the Hg concentrations in the spiked solution after and before, respectively, passing through a 0.45-m m filter. The filtration ratio was included to provide another index as to whether precipitation of the added Hg2+ occurred during the equilibration period.
Oxidation-Reduction Potential (ORP) Field Measurements
A survey of oxidation-reduction potentials (ORP), or Eh values, existing at the TNX site was conducted over a two-day period. The purpose of this survey was to provide a range of Eh values that could be used for calculating the thermodynamic speciation of Hg at the site. A total of 58 Eh, pH, and temperature measurements were taken from 23 locations. Duplicate or triplicate measurements were collected at each location. Forty-two sets of measurements were taken from surface sediments (0 to 5-cm depth). The remaining 16 measurements were made in duplicate at two locations at four depths. About half of the sample locations were submerged beneath water, and the remaining sample locations were in drier, slightly elevated, areas.
The oxidation-reduction potential, pH, and temperature were measured directly in the field following the procedure of Patrick et al. (1996). Briefly, sediment samples were collected by scraping away the litter layer from the ground and scooping 20-cm3 of the surface mineral layer into a disposable plastic cup. Approximately 20-cm3 of distilled-deionized water was added to the sediment. The suspensions were stirred and allowed to equilibrate for 30-min. Eh, pH, and temperature were measured in the sediment slurry. Eh was measured with a Pt/Ag-AgCl probe (Cole Palmer Ref. N99-8978, Vernon Hills, IL) and an Eh/pH/temperature portable meter (Orion, 250A: Boston, MA). A single point validation of the Pt-electrode Eh measurement was made using the quinhydrone technique. Briefly, the test involved dissolving 0.2-g of quinhydrone into 100-mL of pH-7 and pH-4 buffer solutions. The pH-7/quinhydrone solution is expected to read between +70 and +110 mV; all our calibration tests were within this range, averaging 84-mV. The pH-4/quinhydrone solution is expected to read between +240 and +280 mV; again, all our calibration tests were within this range, averaging 259 mV. Results were converted to Standard Hydrogen Electrode (SHE), taking into consideration field temperature at the time of the Eh measurement. The pH electrode was calibrated with NIST traceable pH 4 and 7 buffers between every 10 field measurements.
Chemical Speciation Calculations
The speciation of aqueous Hg, as a function of oxidation-reduction potential, was calculated using the MINTEQA2 software (Allison et al. 1991). The chemical reactions listed in Table 3 and their associated thermodynamic stability constants were added to the existing MINTEQA2 database, which contains constants for >1500 species, including 32 Hg species. As will be discussed in more detail below, it is important to note that these calculations do not take into consideration microbial or sorption processes that may be very important to Hg speciation.
Thermodynamic equilibrium calculations were conducted at pH 4 and pH 7, as a function of Eh. These pH values span the range expected at the site. For each set of calculations, the Eh was set to 33 values ranging between –200 and +800 mV. The background aqueous chemistry in these simulations is presented in Table 2. A total Hg concentration of 0.002 mg/L was used in these simulations because it is the Maximum Concentration Level (MCL). As will be discussed in more detail below, the actual concentration of total Hg in the pore water was <0.01-mg/L. To simplify data presentation, only those components present at concentrations >1-m g/L were included in the summary graphs for this speciation modeling effort.
Results and Discussion
Sediment Characterization
The clay content in the five sediments used in this study were rather low, ranging from 6.2 to 12.3 wt-%. The pH was acidic ranging from 4.00 to 5.78. Organic carbon was moderately high, reflecting in part that the samples were collected from just below the organic layer (i.e., below the O horizon). These low organic carbon concentrations indicate that relatively little organic carbon is translocated beneath the surface organic layer. Based on visual inspection of the 30-cm sediment cores, there was little evidence that organic matter existed below 10-cm depth. The cation exchange capacity of the sediments was relatively low, but consistent with levels commonly measured in sediments from this region. The measurable amount of anion exchange capacity is consistent with the low pH of these sediments and the presence of variable charge minerals (kaolinite and Fe-oxides) and organic matter. The <2-m m and the <0.5-m m fractions of the sediment had similar mineralogy, consisting primarily of kaolinite and hydroxy-interlayered vermiculite, with trace amounts of quartz, illite, and gibbsite (Table 5).
Mercury Sorption to Sediment
Background total Hg concentrations in the whole sediment were 0.02 m g/g (Table 6). The Hg concentrations increased moderately in the smaller size fractions of this sediment. In the contaminated sediments, Hg concentrations ranged from 0.64 to 9.45 m g/g, and were generally not concentrated in the smaller size fractions (except for Sediment B-3). These results suggest that soil washing, a remediation strategy in which the fine-grained materials of a contaminated soil are remove, would not be an effective remediation approach for this site.
Total Hg concentrations were correlated directly with total sediment silver, chromium, and lead concentrations, cation exchange capacity, anion exchange capacity, and Fe-oxide concentrations (Table 7). The significant correlation coefficients with silver and lead, which were also contaminants at this study site, may be attributed to the fact that, like Hg, they are soft metals and whatever process(es) that were responsible for sorbing Hg, may also have been responsible for sorbed these contaminants. Finally, sediment Hg concentrations were inversely related to sand concentrations, likely the result of the low surface area of sand and the relatively low affinity of Hg for SiO2.
There was no detectable Hg in the saturated paste extracts of all five sediments, suggesting that the Hg was strongly bound to the sediment (Table 8). The Hg in the solid phase was almost entirely associated with the Structural/Precipitated/Fe-oxide fraction. In all five sediments, no Hg was detected in the exchangeable fraction and £ 8% of the Hg was detected in the organically bound fraction. These results suggest that a majority of the Hg was associated with Fe-oxides, precipitates (likely as sulfides), and/or in the structure of minerals as trace impurities. Indirect evidence in support of the conclusion that Hg is strongly held is provided by the fact that numerous indigenous plants growing at the study site have been shown to take up very little Hg into their aboveground biomass (Kaplan et al. 2001). Mercury concentration ratios (concentration in plant divided by the concentration in the sediment) for most plant species growing at the site were <0.0007. Among the largest concentration ratios were 0.001 for Tupelo (Nyssa sylvatica var. biflora [Walt.] Sarg.), 0.006 for Water Oak (Quercus nigra L.), and 0.007 for the Netted-chain fern (Woodwardia areloata [L.] Moore).
The significant positive correlation (r = 0.94, P < 0.01) between Fe-oxides and total Hg sediment concentrations (Table 7), though devoid of causality, suggests that Fe-oxides may be involved in removing Hg from the aqueous phase. If the Hg is in fact associated with the Fe-oxide phases, then these data indicate that the Hg is not exchanged onto the surfaces of these phases, but is more strongly retained, perhaps into the structure of or beneath coatings of these minerals. Most sequential extraction procedures includes two increasingly more reducing extraction steps targeted at dissolving the amorphous Fe-oxides (ammonium oxalate [pH 3] in the dark) and the crystalline Fe-oxides (dithionite citrate buffer) (Miller et al. 1986). When these extraction steps were included, Hg mass balance could not be achieved, likely the result of the Hg2+(aq) being reduced to Hg0(aq) and then escaping without detection as Hg0(g).
The extent that Hg2+ sorbed to uncontaminated sediments under oxidized, or partially reduced conditions was quantified through batch experiments. The filtration ratio (Equation 2) of the spiked solution (positive control) was near unity, indicating that little of the Hg2+ in the spike solution was filterable. The average sorption Hg-Kd value for this sediment was 5337 ± 553 mL/g. For purposes of comparison, in-situ desorption Kd values were calculated from the sequential extraction data (Table 8). The in-situ desorption Kd values were defined as:
![]()
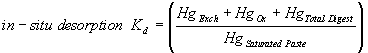 (3)
(3)
where HgExch., HgOx, HgTotal Digest, and HgSaturated Paste represent the Hg concentration in the exchangeable, oxidizable, total digest, and saturated paste, respectively. Among the shortcomings of this operational definition is that it violates the implicit assumption associated with the theoretical definition of the Kd construct that the sorbate is reversibly adsorbed to the solid. This is clearly not the case in these sediments. Given this caveat, the in-situ desorption Kd for:
All of the in-situ desorption Kd values are "greater-than" values because the Hg concentration in the saturated paste was below detection limit, <10-m g/L.
Oxidation-Reduction Potential (ORP) Field Measurements
The results from the Eh and pH measurements are presented in Figure 2. Also included in Figure 2 is an inscribed region representing the Eh and pH values of most soils identified by a survey of 6,200 soils (Baas-Becking et al. 1960). All the pH/Eh data from the study site, except one, are within this inscribed region. The range of Eh values measured in the study site was 83 to 645 mV and the range of pH values was 3.6 to 6.1. The Eh values were somewhat oxidizing. This is unexpected considering that about half of the samples came from sites that were temporarily submerged beneath water. The pH/Eh measurements were collected within several days after a rain event, which may have temporarily increased the dissolved O2 concentrations in the pore water. Again, the intent of collecting this data was to provide a range of possible Eh values for use in subsequent equilibrium speciation calculations.
Not included in Figure 2 are the Eh values of the two depth profiles. In both profiles, the Eh values tended to slightly decrease with depth. In the drier profile, the Eh at the surface was 480-mV (pH 3.5) and the Eh at 56-cm depth was 461-mV (pH 4.3). In the wetter location, the Eh at the surface was 404-mV (pH 4.4) and at 41-cm depth was 385-mV (pH 4.5).
Chemical Speciation Calculations
The thermodynamic speciation calculations were conducted for this study to provide information regarding trends in speciation with pH and Eh values, especially as they relate to the formation of the sparingly soluble cinnabar (HgS) solid phase. There are two important caveats that must be kept in mind while evaluating the results from these calculations. The first caveat is that the influence of microbes on Hg speciation is not included in the calculations. As mentioned in the Introduction, microbes could reduce Hg from an oxidation state of +2 to 0 (reduction to +1 is not common) and may also methylate Hg. It is generally believed that microbes can methylate only dissolved Hg species, Hg species that are loosely retained on sediment surfaces (perhaps by cation exchange), or Hg associated with the organic fraction (Beijer and Jernelov 1979). Because only 0 to 8% of the total Hg in these sediments are associated with these sediment fractions (Table 8), it is likely that biotic methylation plays only a small role in Hg chemistry at the site. The other important caveat is that the presence of a sorbing solid phase was not included in the modeling. This is likely an important omission, since Hg is strongly sorbed by these sediments (Table 9) and is likely to sorb preferentially some Hg species over other species, thereby skewing the proportion of Hg species remaining in solution. Benes and Havlik (1979) reported that the tendency for Hg(II) species to sorb to sediments increased with the hydrophobicity of the Hg complex. They reported that HgS0(aq) sorbed more than Hg(OH)20(aq), which in turn, sorbed more than HgCl20(aq). The steady-state pH in the sorption tests was 4.2 and the Eh was 380 mV (Table 9). As will be discussed later (Figure 3), the dominant Hg species under these conditions according to thermodynamic calculations are Hg2+(aq), HgCl20(aq), HgCl3-1(aq) and HgCl4-2(aq). Of these species, the HgCl20(aq) would be expected to sorb the strongest due to its greatest hydrophobicity.
Between the Eh range of interest for a pH-4 system, 200 and 600 mV (Figure 2), the dominant Hg species were Hg2+(aq), HgCl2(aq), HgCl3-(aq), and HgCl4-(aq) (Figure 3). Based on these calculations, HgS(s) and Hg(CH3)S-(aq) would not be stable at the site because Eh values would not be sufficient low. The rather low groundwater Cl- concentration, 2.06 mg/L (Table 2), had a significant influence on Hg speciation, especially at elevated Eh values. Electrochemical and spectroscopic studies of Hg2+(aq) (Schuster 1991, Yin et al. 1996) support this conclusion. The calculations indicated that the free ion Hg2+ species existed in moderately reducing conditions. This conclusion is inconsistent with several researchers who have noted that Hg2+ rarely exists in sediment pore water as a free ion due to its propensity to sorb to solids or form complexes, especially to chloride or organic matter (Schuster 1991, Wallschlager et al. 1998a, Wallschlager et al. 1998b). No methylated Hg species were calculated to form by abiotic processes in the modeled system. This conclusion is indirectly supported by the results of Specht (1999), who reported that split samples from sediments D-28 and A-5 used in this study were no more toxic to benthic-invertebrate communities than were sediments from an adjacent non-contaminated area. If even a small percentage of the Hg in the contaminated sediments had been methylated, then toxicity would have been detected and methyl-Hg would have been suspected as present due to its highly toxic nature.
An unexpected result from these calculations was that no organic-Hg species were predicted. Based on stripping voltammetry analyses, 50 to 60% of the dissolved Hg in streams and in coastal waters are associated with organic matter (Benes and Havlik 1979). The apparent inconsistency may be attributed to using too low a Hg-DOM association constant in the speciation calculations (Table 3). Another cause for the low calculated concentration of the Hg-DOM complex may in part be attributed to the fact that only stability constants for the Hg2+(aq) and DOM(aq) complex were included in the calculations; DOM complexes with Hg complexes, such as HgCl2(aq), HgCl-(aq), and Hg(CH3)S-(aq), are not available, and therefore for not included. However, the observation that there was little or no Hg associated with the organic fraction in the solid phase of the sequential extractions (Table 8), supports, though does not confirm, that the Hg in this system was not in a form that partitioned greatly to organic matter.
When 0.2 mg/L total Hg was added to the pH-4 modeled system, all the Hg existed as Hg0(l) or Hg2+(aq) between 200 and 350 mV (data not shown). Elemental mercury, Hg0, would soon be eliminated from the aqueous phase by either settling rapidly as high density droplets or by volatilizing as Hg0(g) (Benes and Havlik 1979). Between Eh values of 350 to 600 mV, similar chloride species as those shown for the 0.02-mg/L total Hg system Figure 3 were predicted to form.
At pH-7, the expected Eh range is –350 to +650 mV (Figure 2). It was not possible to calculate the Hg speciation below Eh values of –200 mV because the calculations would not converge. Between the Eh range of -200 and 650 mV, the dominant species in the pH 7 system were Hg2+(aq), HgCl2(aq), HgCl3-(aq), and HgCl4-(aq) (Figure 4). Importantly, no solid Hg phases were predicted to precipitate. A similar calculation with 0.2 mg/L of total Hg in the system (data not shown) revealed that >70% of the Hg precipitated as HgS(s) between –200 and +400 mV. It is quite likely that the Hg concentrations in the contaminant plume first introduced into the study site exceed ~5-mg/L (WSRC 1999). Therefore, these calculations indicate that it is possible that a portion of the Hg first introduced into the wetland may have precipitated as the sparingly soluble HgS phase and the subsequent dissolution of this mineral phase is relatively slow.
Conclusions
Background sediments contained only 0.02-m g/g total Hg whereas the contaminated sediments contained as much as 9.45-m g/g total Hg. The sediment Hg was neither in an exchangeable form, nor in association with an oxidizable material, such as organic matter. Instead it was strongly sorbed to an inorganic form, in 1) the structure of or beneath newly-formed Fe-oxide coatings, 2) (co)precipitates, or 3) in mineral structures as trace contaminants. Of these phases, the first two appear most likely. The Fe-oxides would be limited to crystalline phases that are less prone to dissolution upon reduction than amorphous Fe-oxide phases. Newly formed crystalline phases may either have buried sorbed Hg or may have coprecipitated the Hg into the mineral structure. A significant correlation coefficient (r = 0.94, P £ 0.01) between total Hg sediment concentrations and Fe-oxide concentrations support the contention that the Hg was in part associated with this phase. Furthermore, the fact that the sediment Hg was not concentrated in the smaller size fraction is consistent with the notion that the Hg was associated with a surface coating, which would be present on particles of varying sizes. Unfortunately, a strong reducing agent, such as dithionite, could not be used to isolate the Hg associated with the Fe(III)-oxides because Hg-mass balance could not be achieved. Presumably, the Hg(II) was reduced to Hg(0) and went undetected because it had volatilized as Hg0(g). As little as 9% Hg mass balance was achieved when a reduction step was included in the sequential extraction scheme.
Cinnabar (HgS) or meta-cinnabar, a more soluble form of cinnabar, are the most likely precipitates to form under the environmental conditions of interest. Mercury-chloride phases are too soluble to exist in natural waters (Benes and Havlik 1979). Thermodynamic calculations based on these Eh values and laboratory results suggest that under present field conditions meta-cinnabar would not be stable primarily due to the relatively low pH (~4.2) conditions at the study site. However, cinnabar may have formed when the Hg first leached from the point source at elevated concentrations (~5-mg/L; WSRC 1999) into the wetland. At such a high Hg concentration, HgS would be expected to form under mildly to strongly reducing conditions, especially at circum-neutral pH values.
Although methyl-Hg was not directly measured in this study, there was indirect evidence suggesting that if it exists, it does so at very low concentrations. First, there were relatively low sulfate concentrations in the system to support the presence of sulfate-reducing bacteria, the primary microbe responsible for Hg methylation in sediments. Secondly, similar sediment samples as used in this study, sediment A-5 and D-28, were no more toxic to benthic-invertebrate communities than were sediments from an adjacent non-contaminated area (Specht 1999). If even a small percentage of the Hg in the contaminated sediments had been methylated, than toxicity would have been detected and methyl-Hg would have been suspected as present due to its highly toxic nature.
Given the ecologically sensitive nature of wetlands, traditional intrusive engineering approaches are not viable remediation options. Among the less intrusive approaches, phytoremediation is not an option at this site because the Hg is too strongly bound to the sediments to permit plants to mine it out of the ground. Soil washing is not an option because the Hg is not concentrated in the smaller particles (and also because soil washing can be very intrusive). Given these considerations and the fact that the Hg is strongly bound, it is reasonable to consider a monitored natural attenuation (MNA) approach at the site. This would involve monitoring for Hg movement in the aqueous phase. A more detailed spectroscopic study of the nature of the Hg solid phases and the environmental conditions conducive to their dissolution is necessary to define the necessary safeguards to impose on the site for successfully implementing MNA. Because the solid phases postulated to hold the Hg are themselves oxidation-reduction sensitive (Fe-oxide or sulfide phases), institutional controls would have to be imposed to safeguard the site from extreme fluxes in the oxidation-reduction potential. This may involve protecting the site from extremely oxidizing conditions, which may result from water being directed away from or drained from the site. Such conditions may promote the dissolution of sulfide precipitates and the degradation of organic matter. Conversely, institutional controls may involve protecting the site from extremely reducing conditions, which may result from sustained flooding conditions that may cause Fe(III)-oxide phases to dissolve. Finally, a safeguard would be needed to protect the site from the loss of its highly contaminated topsoil, which may occur if a forest fire removes trees and flooding followed.
Acknowledgments
We thank Cathy Coffey and Gary Iversen for their assistance in the laboratory and fieldwork and Steve Serkiz for reviewing an earlier version of this manuscript (all with Westinghouse Savannah River Company, Aiken, SC). The Westinghouse Savannah River Company is operated for the U.S. Department of Energy under contract DE-AC09-96SR18500.
Appendix I. Reference
Notation
The following symbols are used in this paper:
Cf = final Hg concentration (m g/L)
Ci = initial Hg concentration (m g/L)
Hg<0.45m m = Hg concentration in the 0.45-m m filtered spiked solution (m g/L)
HgExh = Hg concentrations detected in the Dilute Acid Extract (m g/L)
HgOx = Hg concentrations detected in the Oxidizing Agent Extract (m g/L)
HgSaturated Paste = Hg concentrations detected in the Saturated Paste Extract (m g/L)
HgTotal Digest = Hg concentrations detected in the Total Digestion (m g/L)
Hgunfiltered = Hg concentration in an unfiltered spike solution (m g/L)
Kd = distribution coefficient (mL/g)
M = mass of sediment (g)
V = volume of spiked solution (L)
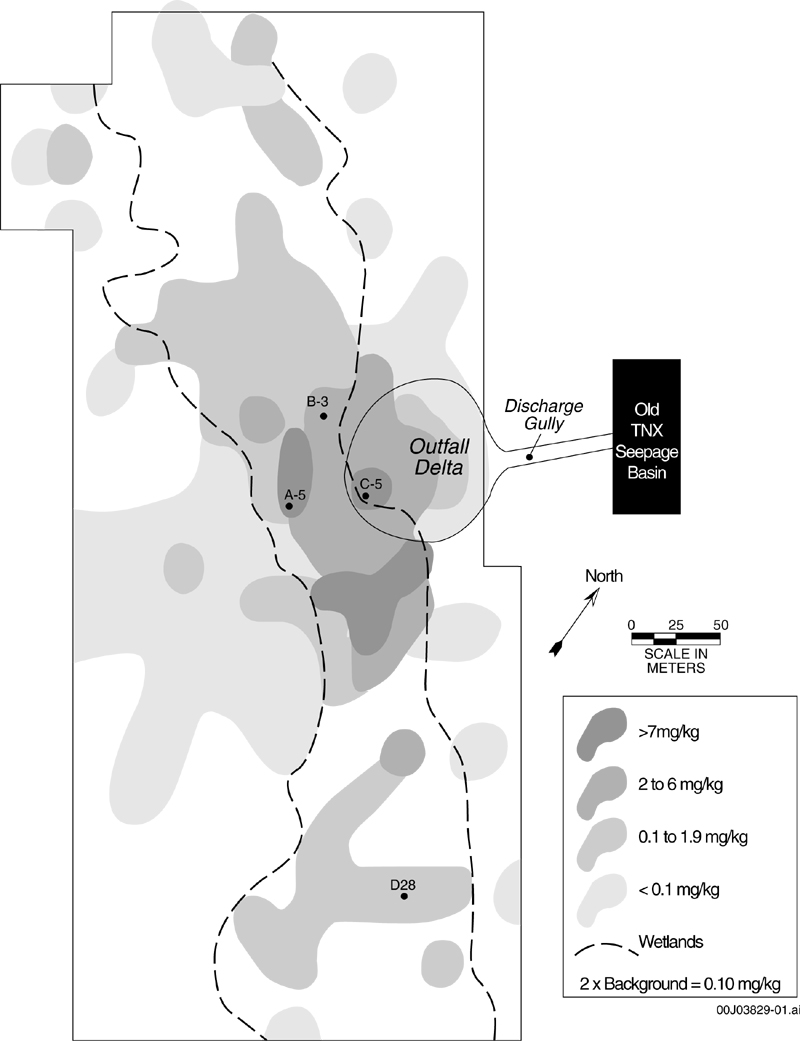
Figure 1. Total-Hg sediment concentrations in the surface 30-cm
of the TNX site.
White areas within map indicate where no Hg measurements
were made (data redrawn from WSRC 1999). Black
dots identify sediment-sampling locations.
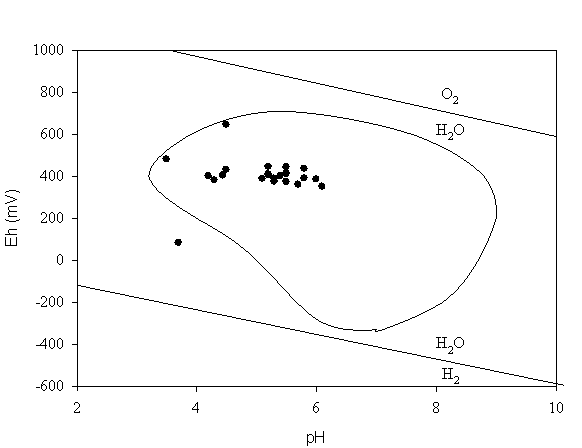
Figure 2. Oxidation-reduction potentials measured from the TNX
site.
The inscribed area was adopted from Baas-Becking et al. (1960)
and is representative of most sediments. The lines representing
the O2/H2O and the H2/H2O couples
provide the limits of
oxidation-reduction potentials in aqueous systems.
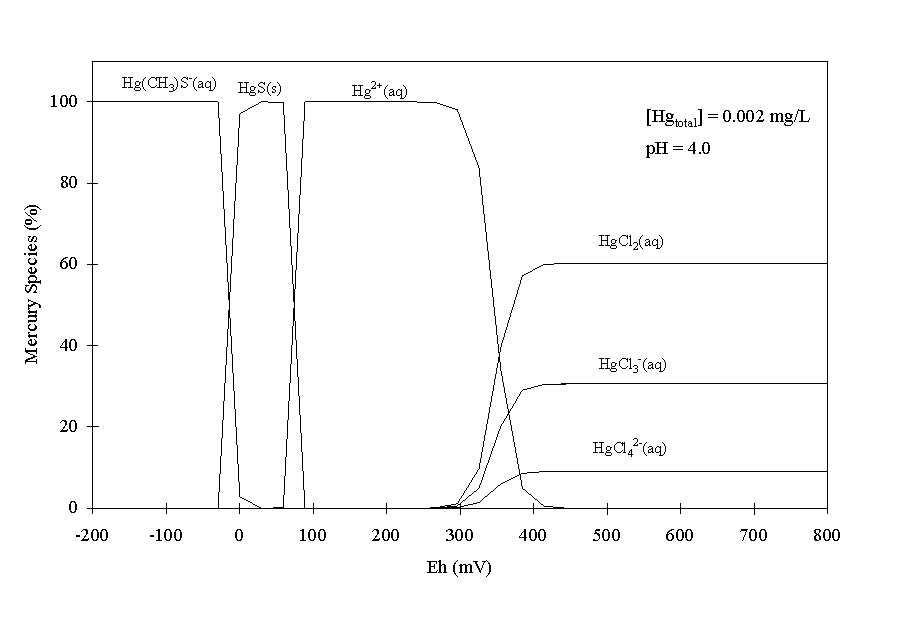
Figure 3. Mercury speciation as a function of reduction potential
in
TNX surface water (Table 2) at pH 4 and 0.002 mg/L
total Hg2+. The range of reduction potentials
expected in pH-4 sediments is between 200 and
600 mV (Baas-Becking et al. 1960; Figure 2).
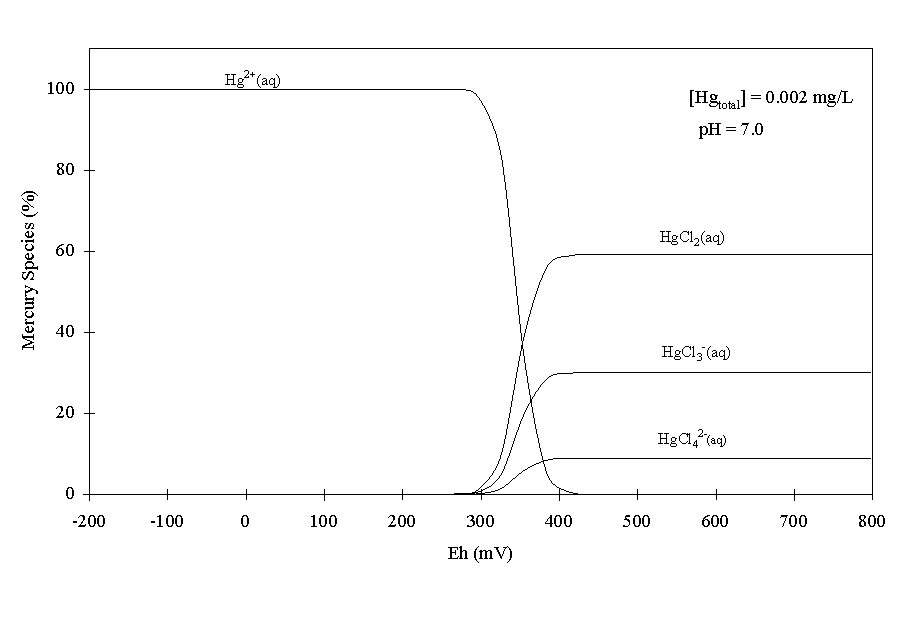
Figure 4. Mercury speciation as a function of reduction potential
in TNX
surface water (Table 2) at pH 7 and 0.002 mg/L total Hg2+.
The range of reduction potentials expected in pH-7
sediments is between -350 and 650 mV
(Baas-Becking et al. 1960; Figure 2).
Table 1. Sequential Extractions.
|
Sequence |
Extractant: Chemical Composition |
Targeted Contaminant Fraction |
Contact Time (days) |
Solid:Liquid (g/g) |
Ref.a |
|
1 |
Saturated Paste Extract: uncontaminated TNX surface water |
Pore Water |
7 |
~1:0.19 |
1 |
|
2 |
Dilute-acid Extract: dilute acetic acid [0.44 M CH3COOH + 0.1 M Ca(NO3)2] |
Exchangeable |
1 |
1:30 |
2 |
|
3 |
Oxidizing Agent: sodium pyrophosphate [0.1 M (Na4P2O7)] |
Bound to Organic Fraction |
1 |
1:30 |
2 |
|
4 |
Total Digestion: Aqua Regia + 48% HF |
Structural/Precipitated/Fe-oxide |
0.125 |
1:30 |
2 |
|
a References: 1 = Rhoades 1996, 2 = Miller et al. 1986. |
|||||
Table 2. Chemical Composition of Uncontaminated Surface Water Collected from Near the TNX Site.
|
Constituent |
Concentration |
Constituent |
Concentration |
|
|
pH |
5.1 (unitless) |
Si |
4390 |
|
|
Al |
9.12 |
Chloride |
2060 |
|
|
Ba |
64.9 |
Nitrate |
186 |
|
|
Ca |
3850 |
Phosphate |
<100 |
|
|
Fe |
99.4 |
Nitrite |
<100 |
|
|
Hg |
0.076 |
Sulfate |
13700 |
|
|
K |
229 |
Inorganic C |
<100 |
|
|
Mg |
1120 |
Organic C |
6050 |
|
|
Mn |
57.9 |
Summation of Cations |
0.33 mM |
|
|
Na |
357 |
Summation of Anions |
0.28 mM |
|
|
a Surface water sample collected about 500-m up-gradient of the contaminated site (Figure 1). |
||||
Table 3. Equilibrium Constants (Log K) Added to the MINTEQA2 Thermodynamic Database.
|
Species |
Log K |
Reference(a) |
|
Hg(OH)2 + CO32- + 8e- + 11H+ = HgCH3+ + 5H2O |
50.2 |
1 |
|
Hg(OH)2 + 2CO32- + 16e- + 20H+ = Hg(CH3)2(aq) + 8H2O |
81.2 |
1 |
|
Hg(OH)2 + CO32- + 8e- + 11H+ + Cl- = Hg(CH3)Cl + 5H2O |
55.02 |
1 |
|
Hg(OH)2 + CO32- + 8e- + 10H+ = Hg(CH3)OH + 4H2O |
45.57 |
1 |
|
Hg(OH)2 + 2CO32- + 8e- + 11H+ = Hg(CH3)CO3- + 5H2O |
56.3 |
1 |
|
Hg(OH)2 + CO32- + 8e- + 11H+ + SO42- = Hg(CH3)SO4- + 5H2O |
51.14 |
1 |
|
Hg(OH)2 + CO32- + 8e- + 10H+ + HS- = Hg(CH3)S- + 5H2O |
84. 14 |
1 |
|
2Hg(OH)2 + 2CO32- + 17e- + 21H+ = (HgCH3)2OH + 9H2O |
101.87 |
1 |
|
2Hg(OH)2 + 2CO32- + 16e- + 21H+ + HS- = (HgCH3)2S + 10H2O |
150.68 |
1 |
|
Hg(OH)2 + DOM2- + 2H+ = Hg-DOM + 2H2O |
5.08 |
2 |
|
(a) References: 1 = Stumm and Morgan 1981; 2 = Cleam and Gamble 1974. |
||
Table 4. Sediment Characterization(a)
|
Sediment |
Distance From Discharge |
>2-mm |
Sand in <2-mm fraction |
Silt in <2-mm fraction |
Clay in <2-mm fraction |
pH |
Org. C |
CEC |
AEC |
Fe-oxides(b) |
|
Gully (m) |
(%,wt) |
(%,wt) |
(%,wt) |
(%,wt) |
(mg/kg) |
(cmol(+) /kg) |
(cmol(-) /kg) |
(%,wt) |
||
|
Background |
650 |
0.8 ± 1.0 |
79.4 ± 2.1 |
13.6 ± 0.3 |
6.3 ± 0.8 |
4.16 ± 0.01 |
1395 |
4.75 ± 0.08 |
1.56 ± 0.17 |
0.01 |
|
A-5 |
130 |
21.2 ± 6.3 |
48.8 ± 6.8 |
23.6 ± 1.6 |
6.4 ± 1.1 |
4.00 ± 0.08 |
1493 |
8.96 ± 0.09 |
2.43 ± 0.05 |
0.08 |
|
B-3 |
110 |
0.5 ± 0.1 |
69.4 ± 0.3 |
19.9 ± 0.4 |
10.2 ± 0.2 |
5.78 ± 0.06 |
973 |
6.99 ± 0.06 |
1.50 ± 0.00 |
0.03 |
|
C-5 |
80 |
1.5 ± 1.1 |
56.9 ± 0.4 |
31.4 ± 0.0 |
10.2 ± 0.7 |
5.26 ± 0.01 |
1167 |
9.31 ± 0.37 |
2.67 ± 0.10 |
0.10 |
|
D-28 |
250 |
2.6 ± 1.0 |
59.4 ± 4.4 |
25.7 ± 5.6 |
12.3 ± 0.2 |
4.29 ± 0.02 |
1435 |
7.83 ± 0.07 |
1.90 ± 0.04 |
0.07 |
|
(a) Analyses were conducted as duplicates
or without duplication (where no standard deviation is presented). |
||||||||||
Table 5. Mineralogy of the <2-m m and <0.5-m m Sediment Fractions.
|
|
|
|
(%, wt)
|
|
B-3 |
Kaolinite |
77 |
76 |
|
Quartz |
1 |
1 |
|
|
Hydroxy-interlayered vermiculite |
17 |
17 |
|
|
Illite |
2 |
3 |
|
|
Gibbsite/Goethite |
3 |
4 |
|
|
Fe-oxides (as Fe2O3) |
0.03 |
Not Measured |
|
|
D-28 |
Kaolinite |
68 |
74 |
|
Quartz |
1 |
0 |
|
|
Hydroxy-interlayered vermiculite |
24 |
21 |
|
|
Illite |
5 |
2 |
|
|
Gibbsite/Goethite |
2 |
3 |
|
|
Fe-oxides (as Fe2O3) |
0.07 |
Not Measured |
|
|
(a) Semi-quantitative estimates based on x-ray diffraction analyses. Fe-oxides concentrations based on sodium dithionite method. |
|||
Table 6. Mercury Concentrations in the Whole, <2-m m, and <0.5-m m Sediment Fractions.
|
Sediment |
Hg Concentration (m g/g) |
||
|
Whole |
<2-m m |
<0.5-m m |
|
|
Background |
0.02 |
0.17 |
0.30 |
|
A-5 |
6.82 |
1.69 |
0.98 |
|
B-3 |
0.64 |
0.85 |
0.75 |
|
C-5 |
9.45 |
6.76 |
5.75 |
|
D-28 |
9.20 |
0.40 |
0.44 |
Table 7. Correlation Coefficients Between Total-Mercury
Sediment
Concentrations and Various Sediment Parameters.
|
Parameter |
Units |
Hg Correlation Coefficientsa |
|
Total Ag Sediment Concentration |
m g/g |
0.83* |
|
Total Al Sediment Concentration |
m g/g |
0.03 |
|
Total Cr Sediment Concentration |
m g/g |
0.95*** |
|
Total Cu Sediment Concentration |
m g/g |
0.55 |
|
Total Fe Sediment Concentration |
m g/g |
0.56 |
|
Total Mn Sediment Concentration |
m g/g |
-0.17 |
|
Total Pb Sediment Concentration |
m g/g |
0.99*** |
|
Gravel (>2-mm) |
%, wt |
0.27 |
|
Sand (2mm > x <50m m) |
%, wt |
-0.82* |
|
Silt (50m m > x <2m m) |
%, wt |
0.53 |
|
Clay (x <2m m) |
%, wt |
0.47 |
|
pH |
unitless |
-0.18 |
|
Organic Carbon |
mg kg-1 |
0.32 |
|
Cation Exchange Capacity |
cmol(+)/kg |
0.83* |
|
Anion Exchange Capacity |
cmol(-)/kg |
0.80* |
|
Fe-oxides(b) |
% Fe2O3, wt |
0.94** |
(a) "*" signifies a significant correlation coefficient at P £ 0.05; critical r is 0.75 for 5 degrees of freedom. "**" signifies a significant correlation coefficient at P £ 0.01; critical r is 0.87 for 5 degrees of freedom. "***" signifies a significant correlation coefficient at P £ 0.001; critical r is 0.95 for 5 degrees of freedom. (b) Fe-oxides: extracted by sodium dithionite from total sediment. This is an estimate of the concentration of free Fe, which is an approximation of the Fe associated with Fe-oxide discrete particles and sediment coatings. |
||
Table 8. Mercury Concentrations in Aqueous and Sediment Phases(a)
|
Sediment |
Aqueous Phase Hg |
Solid Phase Hg (%) |
||
|
(m g/L) |
Exchangeable |
Organic |
Structural/Precipitated/Fe-oxide |
|
|
Background |
<10 |
0 |
0 |
100 |
|
A-5 |
<10 |
0 |
8 |
92 |
|
B-3 |
<10 |
0 |
0 |
100 |
|
C-5 |
<10 |
0 |
4 |
96 |
|
D-28 |
<10 |
0 |
0 |
100 |
|
(a) Operational definitions of these extracts are presented in Table 1. |
||||
Table 9. Mercury Kd Values and Filtration Ratios(a)
|
(mL/g)
|
(mL/g)
|
(unitless)
|
|
|
5582 |
5337 ± 553 |
1.03 |
0.98 ± 0.05 |
|
4704 |
0.94 |
||
|
5725 |
0.98 |
||
|
(a) Mercury was added to uncontaminated TNX surface water (Table 2) as Hg(NO3)× 2H2O to a concentration of 892 m g L-1; the solid:liquid ratio was 0.35-g:35-g; sediment/Hg contact time was seven days. The pH of the system was 4.2 and the Eh was 380-mV. (b) Filtration ratio is the ratio of the <0.45-m m filtered spike solution divided by the unfiltered spike solution. These solutions were carried through the experiment and the filtered solutions were used to calculate the mass of Hg sorbed to the sediments (Equation 2). The intent of this parameter is to provide an index of whether the added Hg precipitated out of solution during the experiment. A ratio <1 suggests precipitation occurred; a ratio >1 is undefined and indicates analytical error. |
|||