WSRC-MS-2001-00744
Palladium-Coated Kieselguhr for Simultaneous
Separation and Storage of Hydrogen
R. H. Hsu and J. E. Klein
Westinghouse Savannah River Company
Aiken, SC 29808
This report was prepared as an account of work sponsored by an agency of the United States Government. Neither the United States Government nor any agency thereof, nor any of their employees, makes any warranty, express or implied, or assumes any legal liability or responsibility for the accuracy, completeness, or usefulness of any information, apparatus, product or process disclosed, or represents that its use would not infringe privately owned rights. Reference herein to any specific commercial product, process or service by trade name, trademark, manufacturer, or otherwise does not necessarily constitute or imply its endorsement, recommendation, or favoring by the United States Government or any agency thereof. The views and opinions of authors expressed herein do not necessarily state or reflect those of the United States Government or any agency thereof.
This report has been reproduced directly from the best available copy.
Available for sale to the public, in paper, from: U.S. Department of Commerce, National Technical Information Service, 5285 Port Royal Road, Springfield, VA 22161, phone: (800) 553-6847, fax: (703) 605-6900, email: orders@ntis.fedworld.gov online ordering: http://www.ntis.gov/support/index.html
Available electronically at http://www.osti.gov/bridge/
Available for a processing fee to U.S. Department of Energy and its contractors, in paper, from: U.S. Department of Energy, Office of Scientific and Technical Information, P.O. Box 62, Oak Ridge, TN 37831-0062, phone: (865 ) 576-8401, fax: (865) 576-5728, email: reports@adonis.osti.gov
Abstract
Palladium finely dispersed in a substrate of kieselguhr, Pd/k for short, has been successfully used for hydrogen storage, separation and pumping for a number of years at the Savannah River Site (SRS). Recently SRS has developed a new pd/k flow through bed (FTB) prototype for separating hydrogen from other gases and simultaneously storing the hydrogen on palladium. The FTB uses single-pass liquid nitrogen cooling during hydrogen absorption/separation/storage and electrical heating for desorption/unloading of hydrogen. Fourteen absorption-desorption or loading/unloading cycles using hydrogen have been conducted with the new FTB prototype. Test results show that all design performance objectives have been successfully achieved: recover >95% of hydrogen gas from feed gas, produce 99.9% hydrogen product gas and < 5% hydrogen in discharge gas. This paper will discuss characteristics of the palladium-coated kieselguhr or diatomaceous earth, design and operation of the FTB, and results of performance tests such as separation efficiency, hydrogen storage capacity and system heat transfer characteristics.
Metal Hydrides
Many metals and alloys readily form metal hydrides on exposure to hydrogen. Some metals that have been used for separating, pumping and storing hydrogen at Savannah River Site include uranium, magnesium, titanium, lithium-aluminum, lanthanum-nickel -aluminum, zirconium and palladium. Hydrogen absorption turns gaseous hydrogen into solid hydride, a phase change that generates heat. Efficient heat removal is necessary for a practical system to sustain hydrogen absorption. To recover hydrogen from the hydride, heat is applied to desorb gaseous hydrogen. Hydrogen absorption and desorption are reversible processes that are driven by thermodynamics of phase equilibria. Fig. 1 is a generic metal hydride isotherm at a constant temperature. The X-axis is H/M, atom ratio of hydrogen to metal. Y-axis is pressure of hydrogen in equilibrium with solid at a particular loading, generally with a log scale. Ideally, it is desirable to have a wide, flat plateau at which hydrogen is absorbed with negligible change in gas equilibrium pressure.
Absorption pressure is higher than desorption pressure, resulting in hysteresis. Repeated hydrogen absorption and desorption leads to changes in the characteristics of the metal, causing fines formation (decrepitation) in unconfined systems and agglomeration due to expansion in confined systems.
Figure 1. A generic metall hydride isotherm
Palladium-Coated Kieselguhr
The Pd/k used in the flow through bed is 50 wt. % Pd coated or dispersed on kieselguhr using an Engelhard proprietary process. Kieselguhr is a diatomaceous earth that acts as an inert, high-surface area substrate procured from Chromosorb®. The Pd/k is charcoal –like in appearance, as shown in the photograph in Fig. 2. An activation heat treatment is generally used to remove oxides, as shown in the X-ray diffraction in Fig. 3.
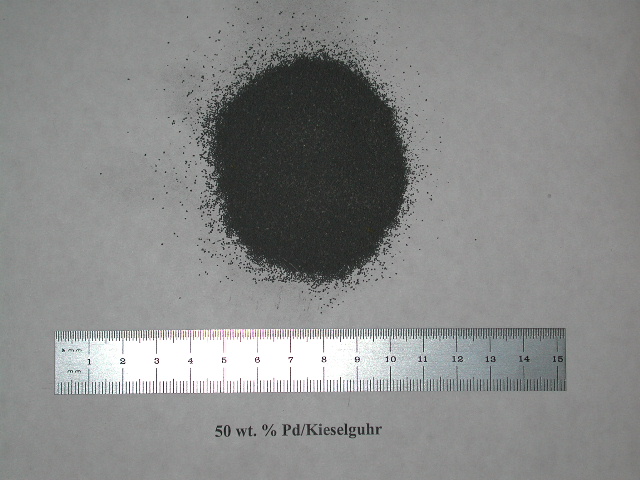
Figure 2. Photograph of 50 wt. percent Pd/ kieselguhr loaded into the flow through bed.
Fig. 4 shows a hydrogen desorption isotherm for a sample of 44.4 wt. % Pd/k at 80 oC. Generally, more desorption isotherms are measured because they are more repeatable. Isotherm correlations have been obtained for both absorption and desorption istherm plateau pressures.
For our experiments, the expected hydrogen-palladium equilibrium absorption pressure at –40 oC and desorption pressure at 180 oC are calculated using the following Pd-hydrogen isotherm correlations, where temperature is in degrees Kelvin:
Absorption isotherm equation:
Ln P (torr) = -4469/T + 17.56
Desorption isotherm equation:
Ln P (torr) = -4932/T + 18.37
Pd-hydrogen desorption and absorption pressures of interest are shown in the following table.
|
Temperature
|
Desorption Pressure |
Absorption Pressure |
|
-40 oC |
0.06 torr |
0.2 torr |
|
-30 oC |
0.15 torr |
0.44 torr |
|
180 oC |
1785 torr |
2206 torr |
Flow Through Bed
The flow through bed prototype is a pipe-in-can design with 50 wt. % Pd/k packed in both the annulus and the center pipe. The uninsulated bed is 6.625" outside diameter by 3’ tall, with a flat plate bottom. The center pipe is 3.5" O.D. schedule 40 pipe. The volume available for Pd/k is 7.4 liters and the FTB is packed with 3.06 kg of 50 wt % Pd/k. Fig. 5 is a photograph of the flow through bed before loading with Pd/k and final assembly. Fig. 6 is a photograph of the bottom view of the center pipe bundle prior to placement in the can. The center pipe is sandwiched by two 1" U-shaped cooling coils and surrounded by four heater wells. There are also two thermocouple (TC) wells, one in the center pipe and one in the annulus. Each thermocouple well holds ten (10) type t thermocouples spaced in the vertical direction. Fig. 7 is a photograph of the assembled flow through bed.
A schematic of the new flow through bed prototype is shown in Fig. 8. The side view of the FTB shown in Fig. 8 shows cooling nitrogen flows through two U-shaped cooling coils in the shell annulus. 5 micron filters protect process lines. FTB heating is provided by four 200-watt electric heaters in the annulus, spaced around the center pipe. The heaters are wired in series so that only one on-off control is needed.
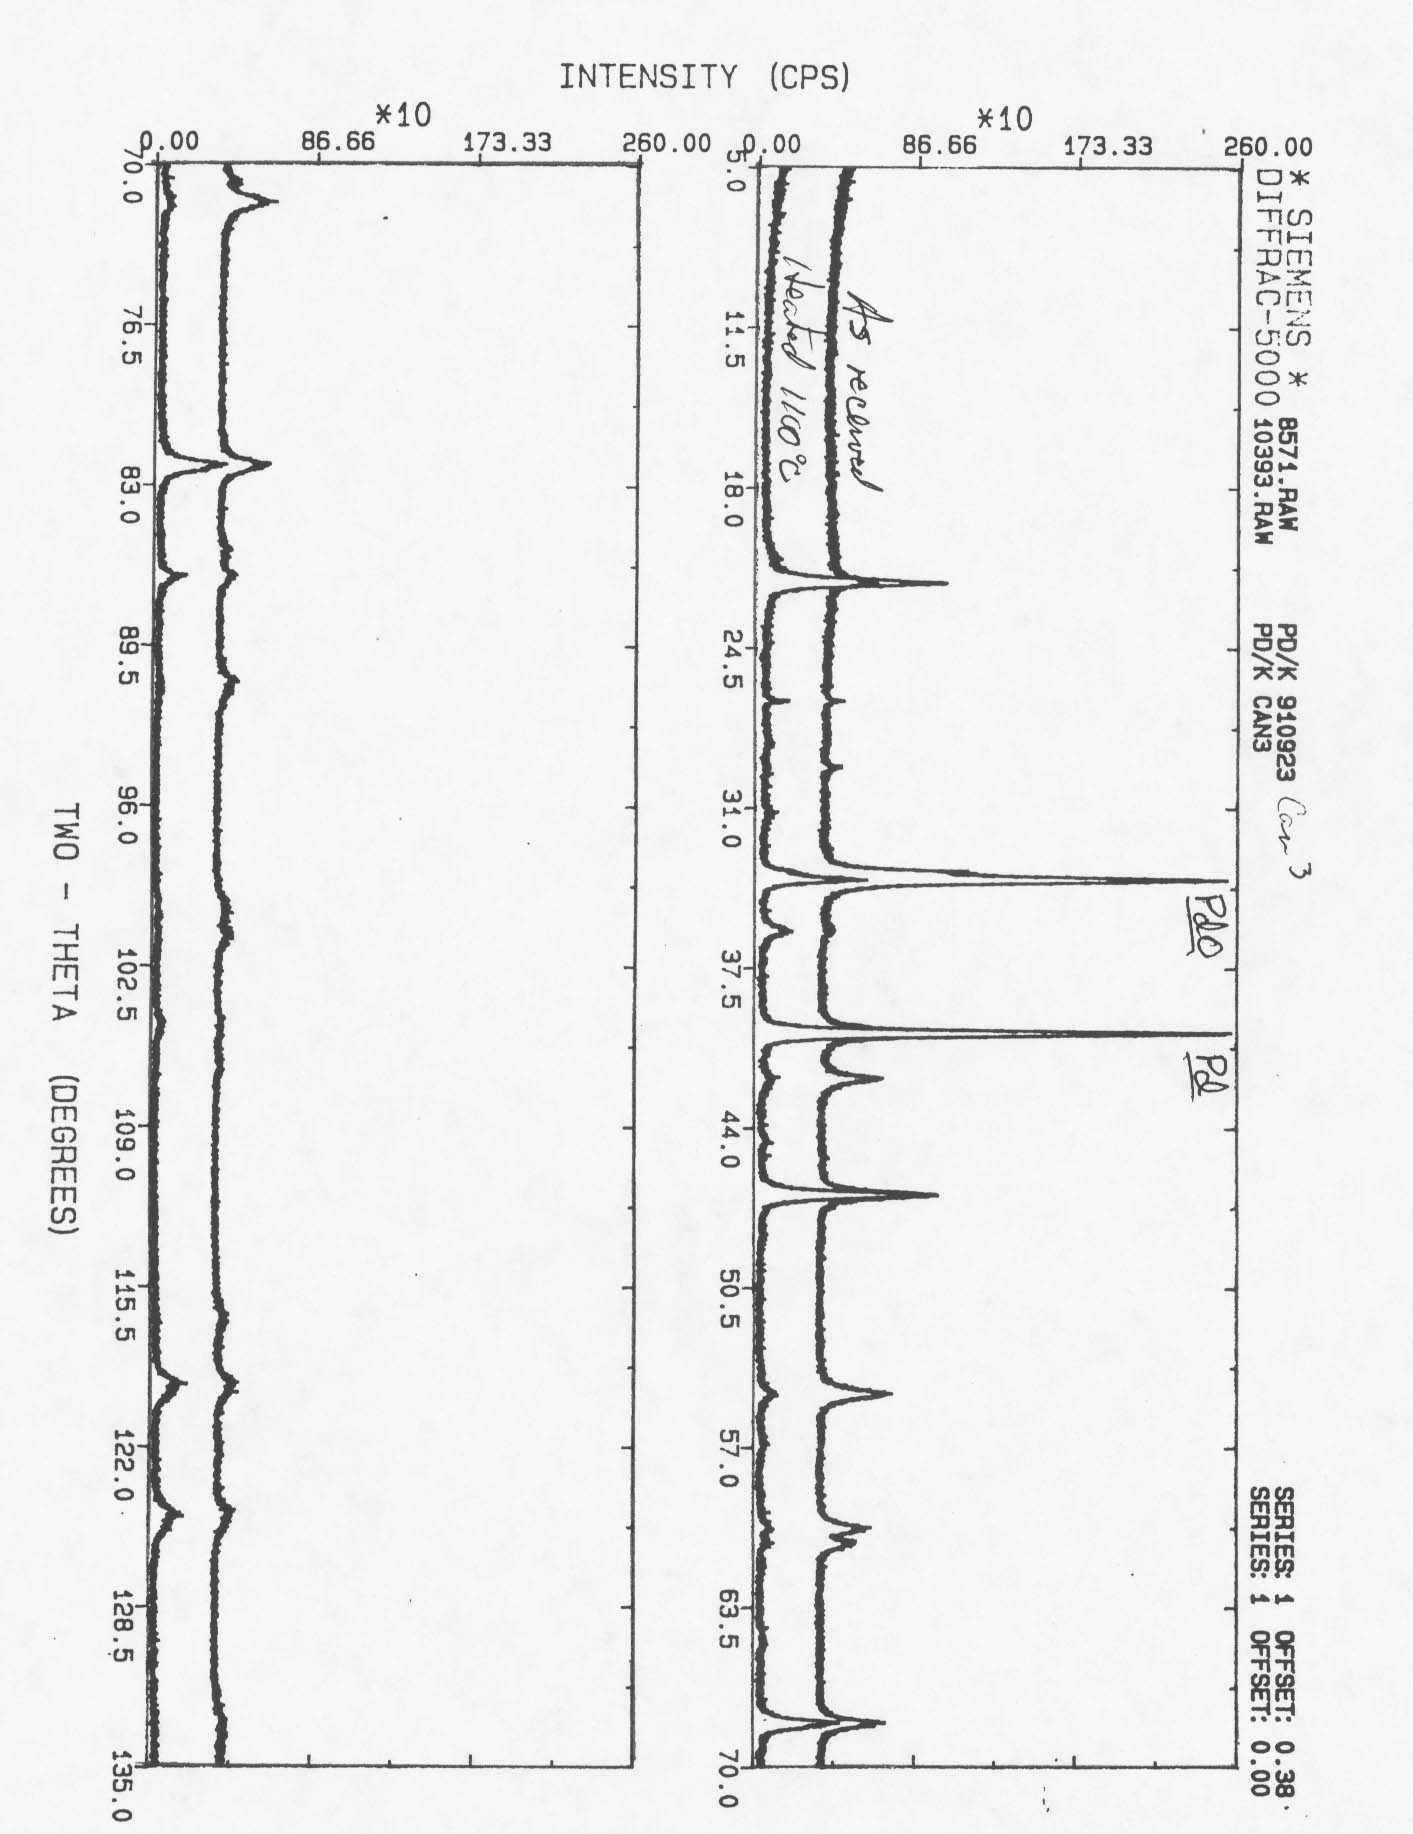
Figure 3. X-ray diffraction of Pd/k .
Figure 4. Desorption isotherm of 44.4 wt. percent Pd/k at 80 degrees C.
The FTB hydrogen absorption tests are conducted at –40 oC to minimize hydrogen in the discharge gas. To prepare the FTB for gas processing, it is first cooled to the desired temperature using single-pass liquid nitrogen. The feed gas containing hydrogen flows into the top of the annulus. Pd in the FTB absorbs hydrogen as the remaining gas flows down the annulus. At the bottom of the annulus, the gas flow makes a U-turn and goes up the center pipe and exits from the top of the FTB. When the Pd in the annulus and inner pipe is completely loaded with hydrogen, feed gas is stopped and the gas blanketing the FTB containing hydrogen is pumped away. The evacuated FTB is then heated to 180 oC to desorb hydrogen to a product tank using the four electric heaters in the annulus.
The design performance objectives for the FTB prototype were to: recover >95% of hydrogen gas from feed gas, produce 99.9% hydrogen product gas and < 5% hydrogen in discharge gas.
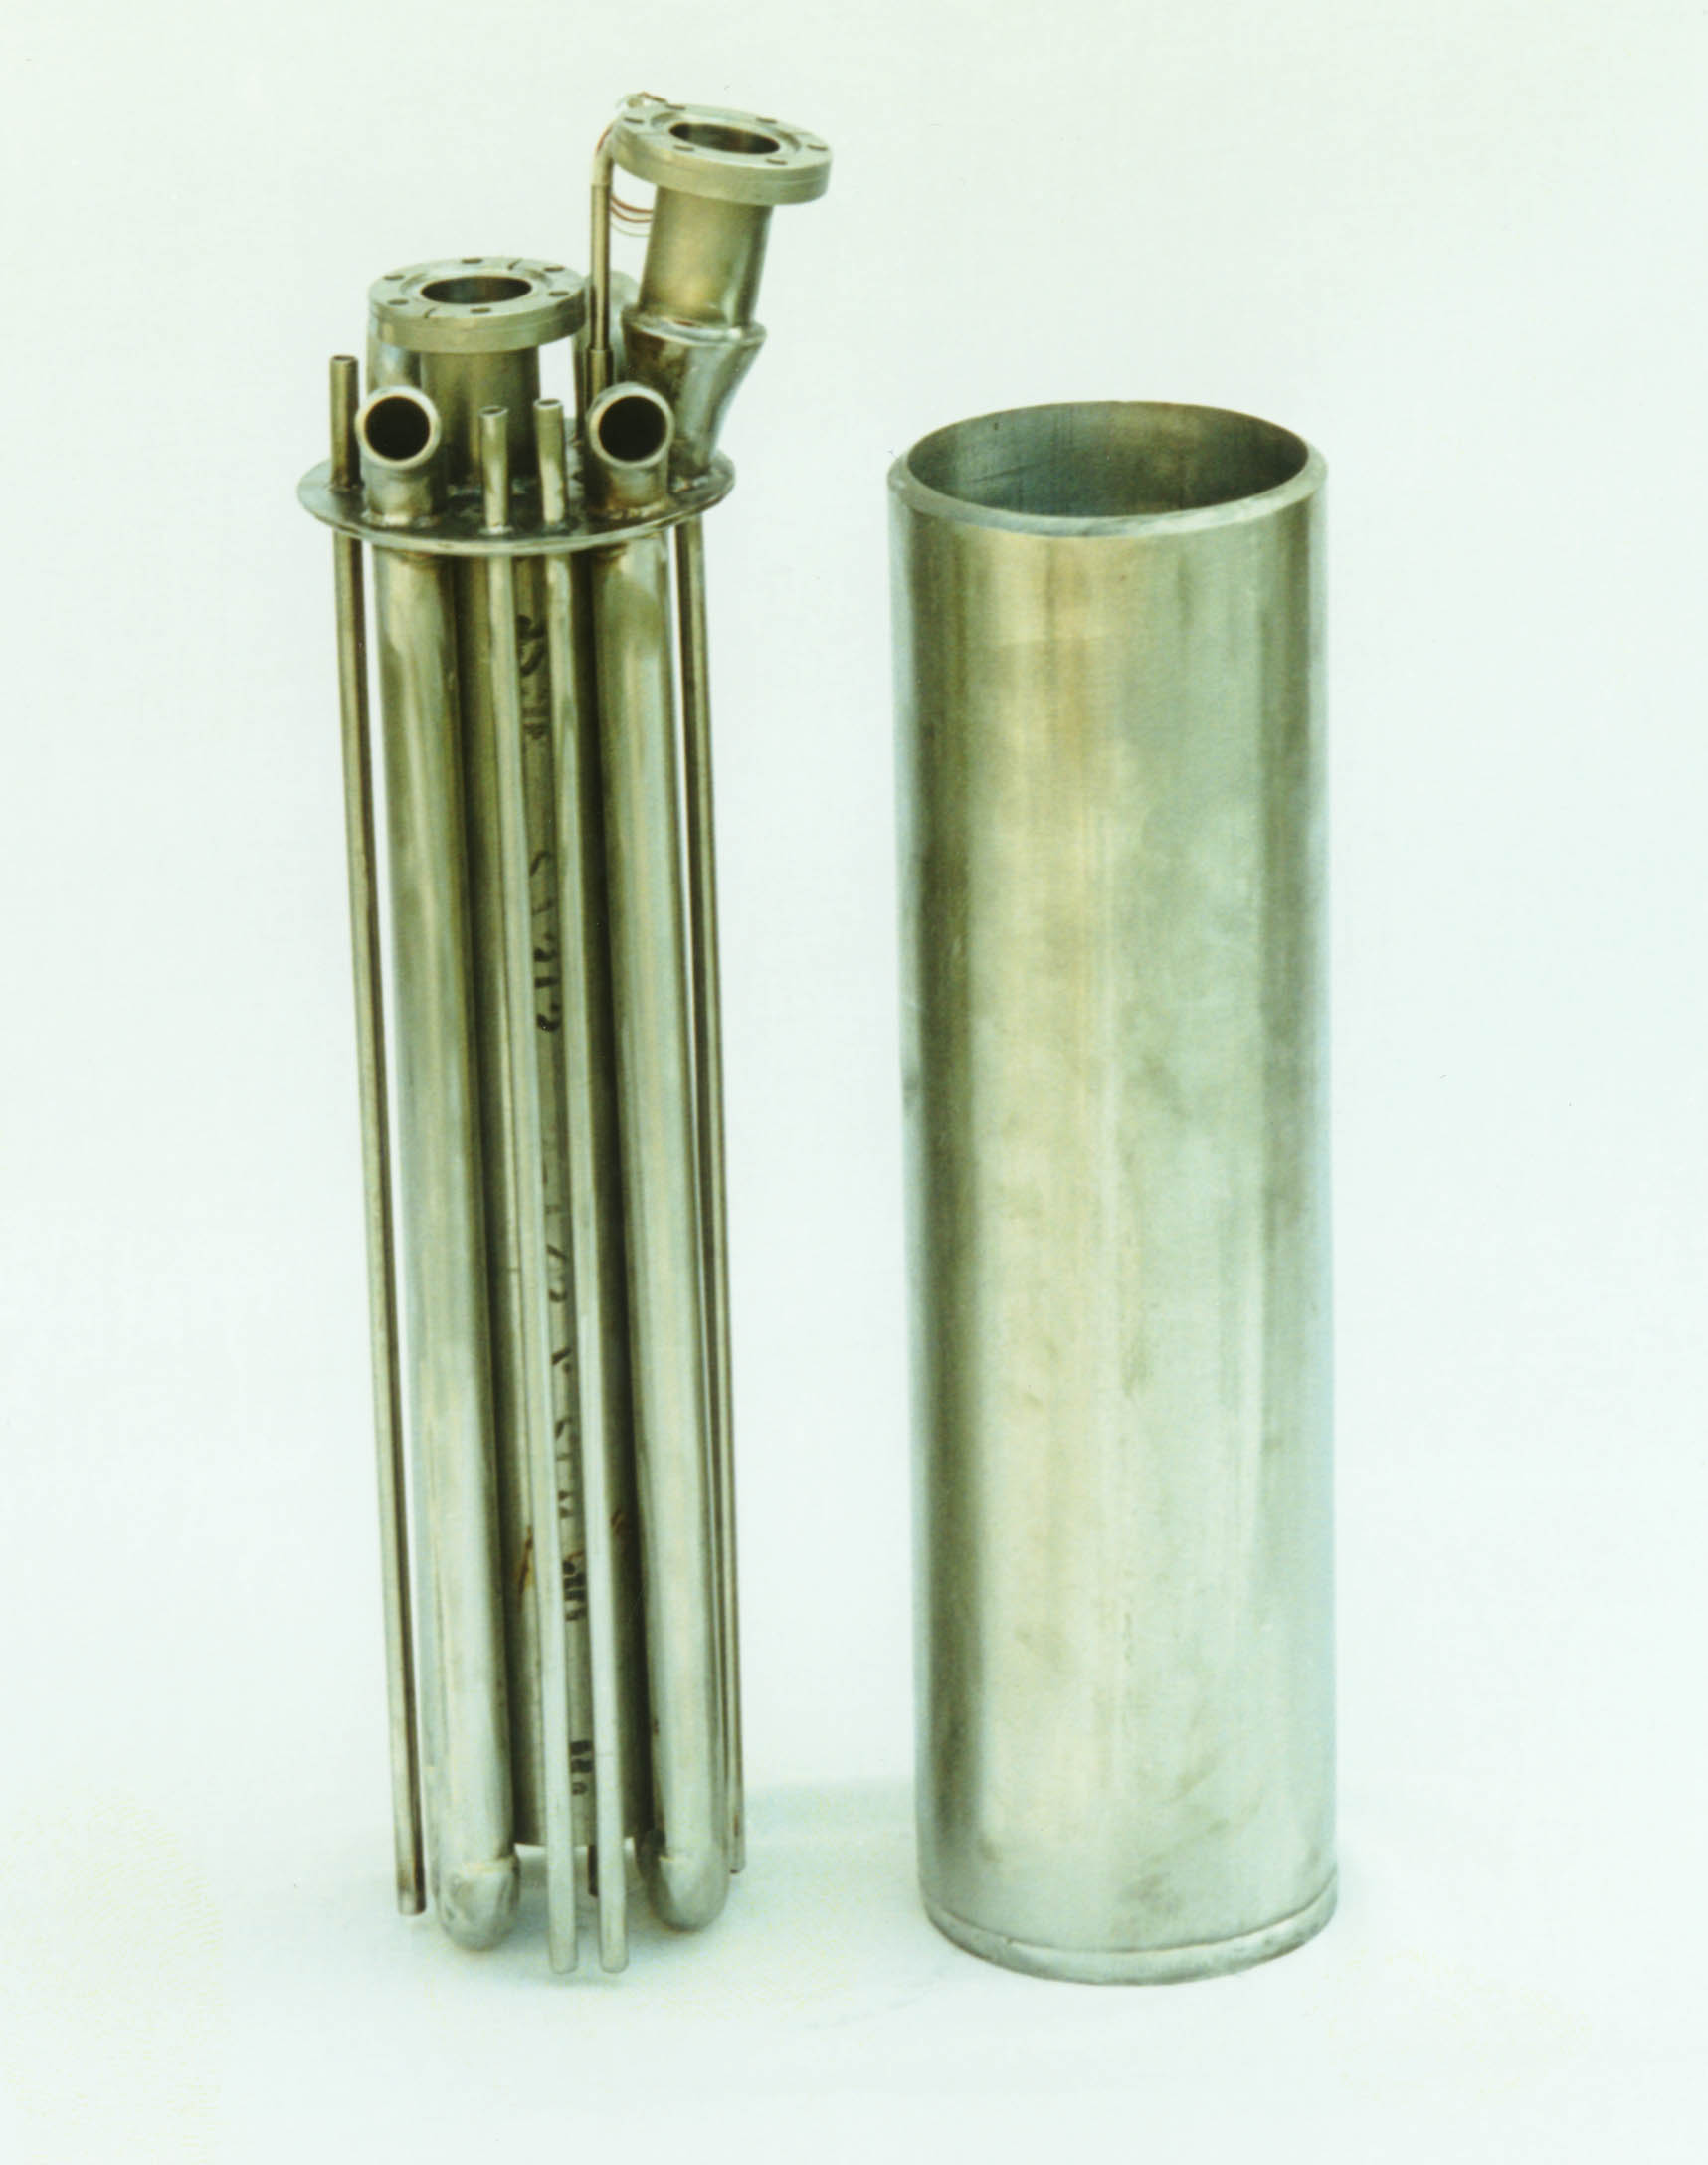
Figure 5. Photograph of the side view of the flow through bed
prior to filling with Pd/k material
and final assembly. After filling with Pd/k, the center pipe bundle is placed
in the can and
welded around the spacer. The taller flanged connection is the feed gas inlet
to the annulus; the
shorter flanged connection is exit gas outlet from the center pipe. Note flat
end caps.
Figure 6. Photograph of bottom view of the FTB center pipe
bundle prior to placement in can. The center
pipe is sandwiched by the two 1-inch U-shaped cooling tubes. Four heater wells
surround the center pipe.
One thermowell is inside the center pipe, the other in the annular space.
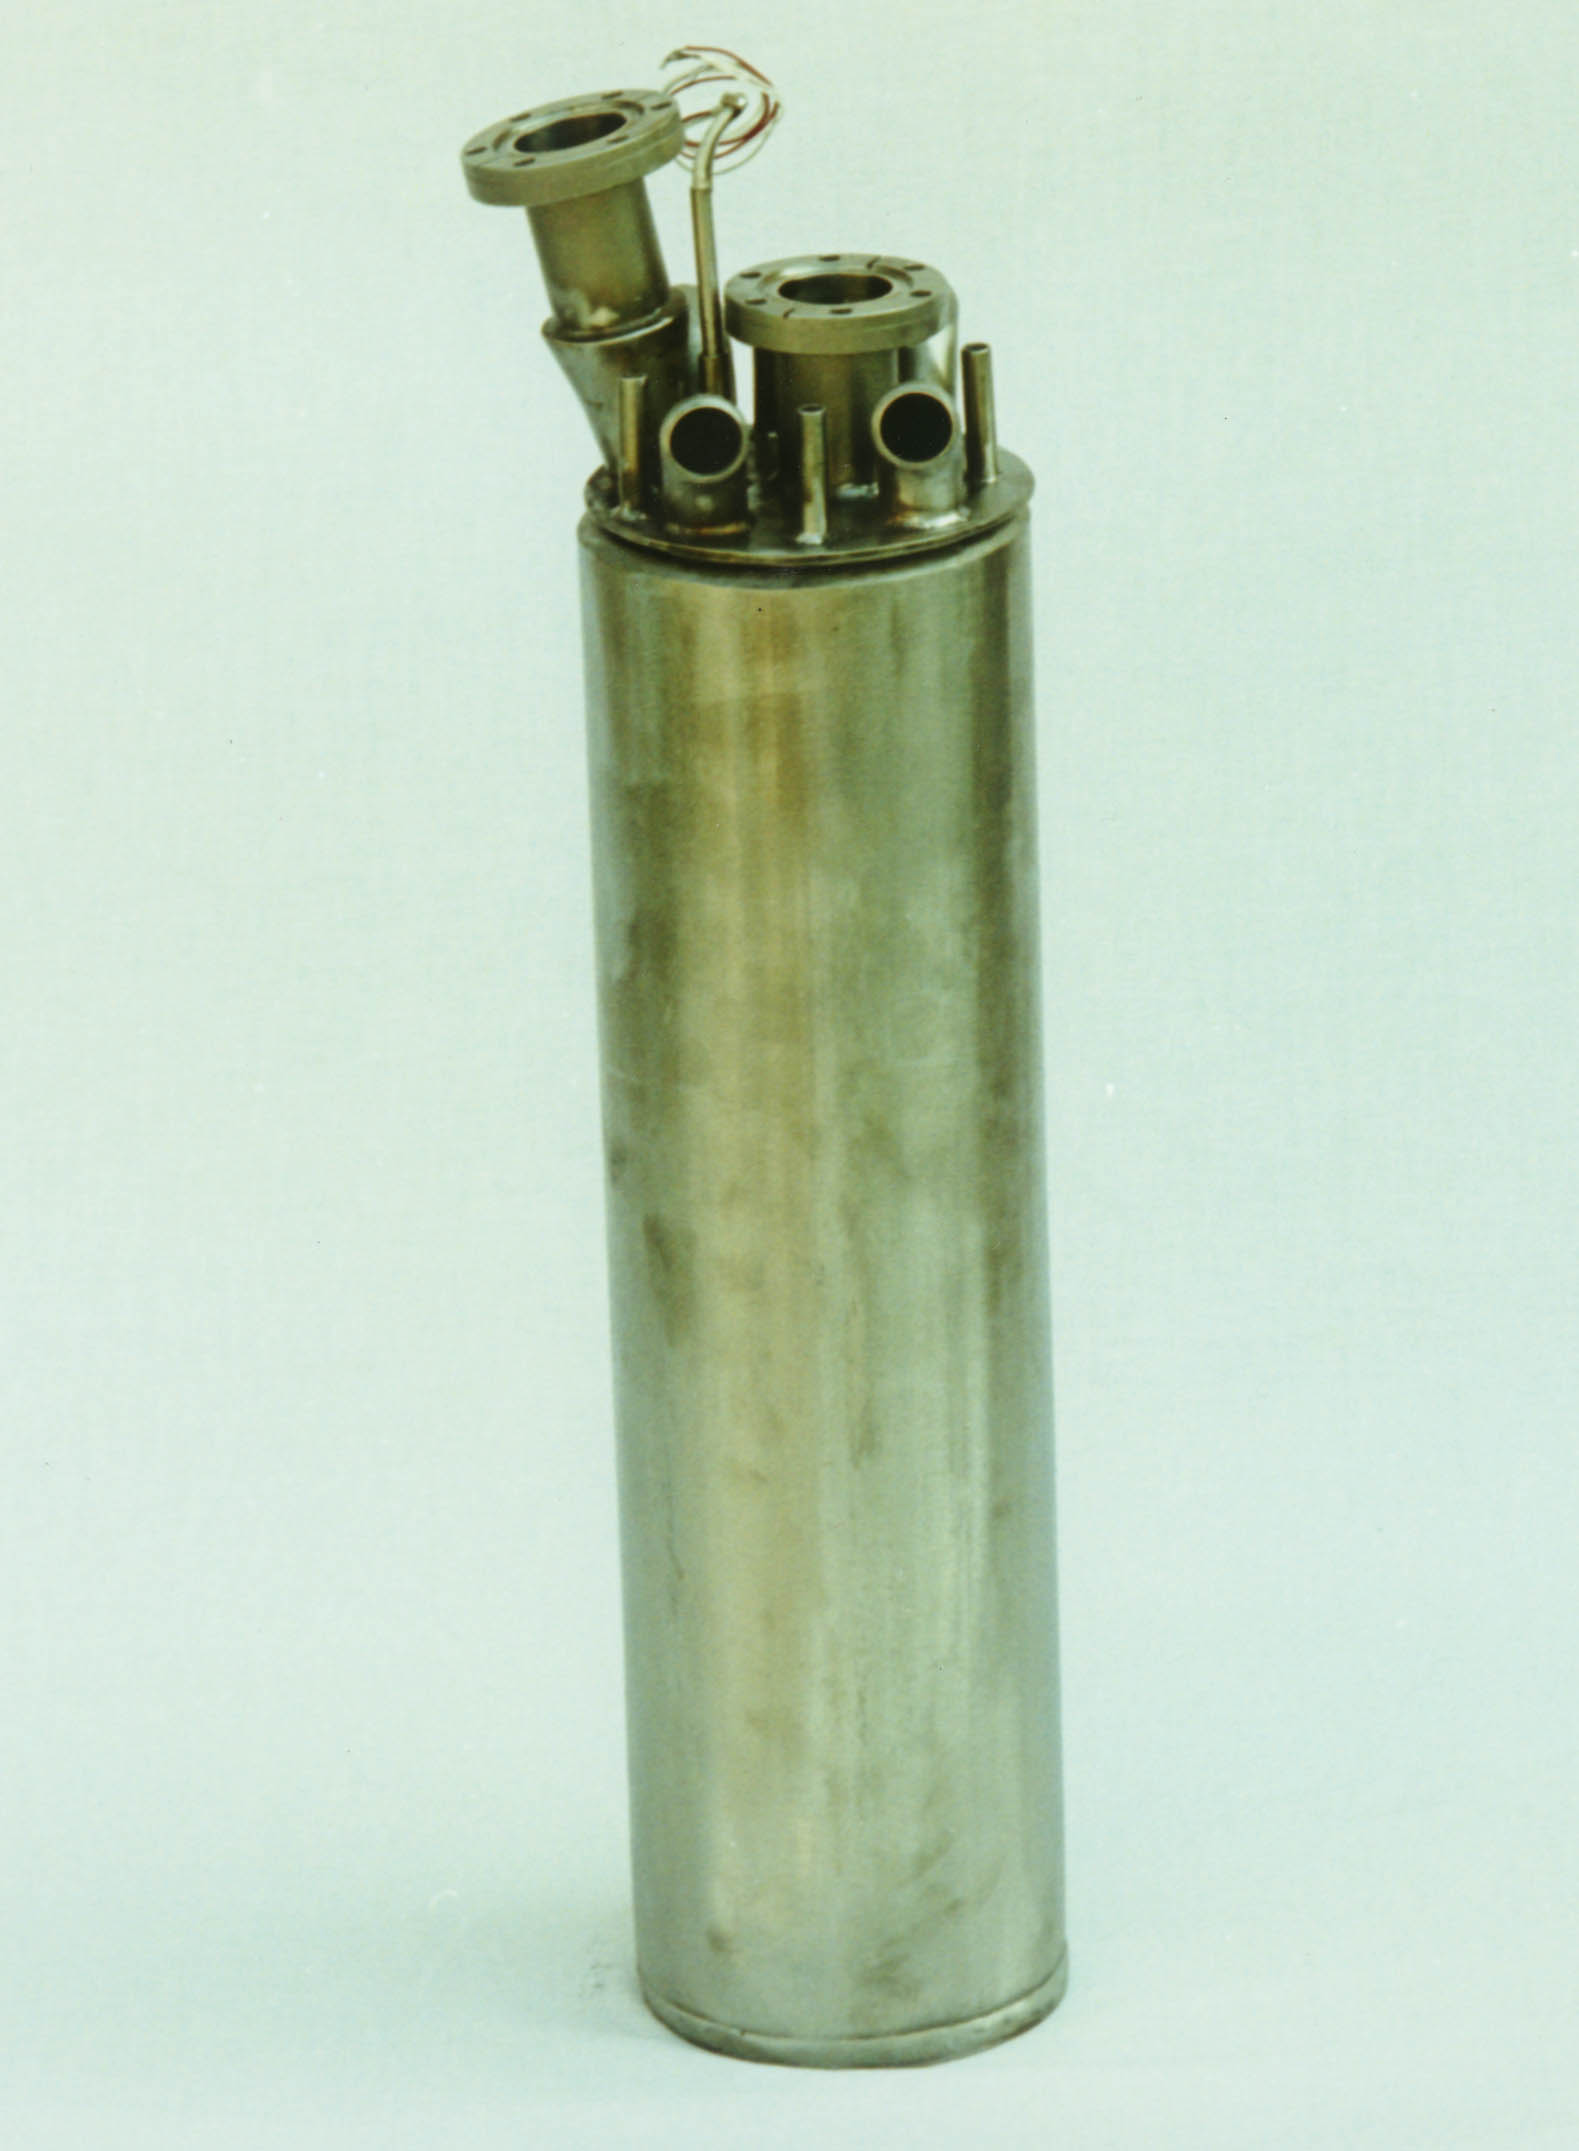
Figure 7. Photograph of the assembled flow through bed prior
to
welding, insulation and placement in gas manifold.
Gas Manifold and Instrumentation
A schematic of the experimental FTB gas manifold is shown in Fig. 9. A photograph of the equipment is shown in Fig. 8. The gas manifold lines are ¼" stainless steel or copper with Nupro or Whitey valves and Cajon fittings. Feed gas is prepared by mixing helium or argon with hydrogen flowing through respective mass flow controllers. The main FTB exhaust gas is discharged to the air hood. A slip stream of the exhaust gas is directed to a thermal conductivity detector for measuring hydrogen content. A Tescum Back Pressure Regulator (150 psig rating) controls the FTB operating pressure. The manifold is protected by a 50 psig rupture disk. Pressures are measured at FTB flow inlet and outlet using MKS 10,000 torr baratrons. Experimental data is collected using a LabVIEW® program.
To achieve good separation during hydrogen absorption, the FTB is pre-cooled to -40 oC before processing using single-pass cooling nitrogen from liquid nitrogen Dewar. Liquid nitrogen is discharged from the Dewar liquid valve by internal Dewar pressure past a cryogenic-rated electric solenoid valve into two FTB coiling coils. The cooling nitrogen exhaust temperature is used to control the on-off solenoid valve. A list and description of the gas manifold components and instrumentation follows:
Test Results and Discussion
A total of fourteen (14) hydrogen absorption and desorption cycles were performed using either argon or helium as the inert gas. All absorption tests were conducted at –40 oC and at either 1000 torr FTB pressure throughout or with FTB initially under vacuum and pressurizing to 1000 torr as the test progressed. The FTB hydrogen capacity is determined by multiplying hydrogen flow rate by time to breakthrough. In order to fully characterize the absorption temperature profiles, the tests did not stop hydrogen flow at breakthrough, but continued until the FTB was totally saturated with hydrogen.
Absorption Efficiency and Kinetics
The FTB test data show that hydrogen absorption/separation by the FTB prototype is very efficient and very fast for the flow rate and hydrogen concentration ranges tested. Essentially all hydrogen is absorbed for all feed gas flow rates tested of 0.6 to 3.0 liters/min and hydrogen concentration of 25% to 92%. Except for one case, there was no detectable hydrogen in the exit gas. In the detectable case, hydrogen removal efficiency was >99.9%. The test results strongly suggest that the FTB prototype can efficiently remove hydrogen at higher gas flow rates than the highest flow tested of 3 liters/min.
Figure 8. Schematic of Flow Through Bed.
Figure 9. Schematic of Gas Manifold System for Testing Flow
Through Bed.
Remove >95% H2 from Feed Gas
Since essentially all measurable hydrogen is absorbed for all feed gas flow rates tested of 0.6 to 3.0 liters/min and hydrogen concentration of 25% to 92%, hydrogen removed is >99.9%. Thus the FTB prototype easily met the design goal of recovering >95% of hydrogen from the feed gas.
Less Than 5% H2 in Discharge Gas
During normal operation of the FTB, there is negligible hydrogen in discharge gas, as essentially all hydrogen is absorbed for all feed gas flow rates tested of 0.6 to 3.0 liters/min and hydrogen concentration of 25% to 92%. At hydrogen breakthrough during normal plant operations, feed gas flow would be stopped and returned to the feed tank. Thus, only negligible hydrogen should pass in the discharge gas, depending on how quickly feed gas is stopped following breakthrough. With proper operating technique, the FTB should easily meet the design goal of leaving <5% hydrogen in the exhaust gas.
Desorbed Hydrogen Gas Purity
Desorption of the saturated FTB produces hydrogen gas of about 99.95% purity, slightly better than the goal of 99.9%. To obtain >99.9% hydrogen, the FTB must be pumped down completely following breakthrough, with the FTB still at –40 oC. Incomplete pump out of the FTB will leave residual inert gases that could contaminate and reduce the purity of the hydrogen gas.
Flow Through Bed Temperature - Cooling
A typical cooling curve with FTB initially filled with helium is shown in Fig. 10. The FTB cooling data show that a FTB temperature of -40 oC in the center pipe can be achieved in about 6 hours. Under vacuum, cooling of the FTB to temperature can take up to 3 times as long (not shown). Fig. 10 also shows that cooling nitrogen distribution between the two coils is quite uneven.
Flow Through Bed Temperature - Absorption
Typical FTB absorption temperature profiles for one of the 14 runs are shown in Fig. 11. Five groups of temperature profiles are labeled in each figure, with the number of profiles in each group shown in parenthesis: Cooling N2 In (2), Cooling N2 Out (2), Heater TCs (4), Annulus (5) and Center Pipe (7). The Annulus and Center Pipe thermowells each holds 10 thermocouples, thus not all temperatures are recorded.
The two sets of cooling nitrogen curves are dark blue (TE-1) in and orange (TE-16) out and red (TE-2) in and yellow (TE-3) out. TE-16 is used to control the solenoid valve that controlled the cooling nitrogen flow. Temperature cycling within a 5 oC band of the inlet flow due to the nature of solenoid operation is clearly indicated by TE-1. The large difference in the two inlet temperatures shows that cooling nitrogen flow was not evenly distributed, yet the FTB was able to cool down to –40 oC.
The four Heater TCs (TE-17, TE-18, TE-19 and TE-20) are thermocouples placed inside the heater wells. The temperature peaks are indicated from left to right, in order, of blue, orange, dark green and light green. The order seems to hold true for all runs, but the magnitude and shape of the peak varies with flow. The peaks are most distinctive and largest for the large hydrogen flows that release the most heat. In an ideal, perfectly symmetrical bed, if all four thermocouples are located the same distance form the top and flow is uniform down the annulus and thermocouples have identical response, then all four peaks would superimpose on each other. The order of appearance of the temperature peaks thus provides an indication of gas flow path.
There are five Annulus temperature profiles. They are indicated from left to right, in order of appearance, with colors of light blue, red, brown, dark green and dark blue. The annulus temperatures measure from the top of the FTB to the bottom. The first is step-like and usually quite flat, suggesting not much hydrogen absorption and heat release. The next three are step-like, with only the last exhibiting a recognizable "wave." Overall, the Annulus temperature profiles are more amorphous, less repeatable, and tend to "plateau." The plateau behavior suggests that packets of unreacted palladium may be continuing to undergo hydriding following passage of the initial feed gas.
The Center Pipe temperatures are most definitive and consistent. The seven temperatures, in order of appearance from left to right, are medium blue, light blue, light green, yellow, blue, pink and purple. They measure the temperature of the FTB Center Pipe from the bottom to the top. The first two temperature profiles tend to track closely together. The final four are very definitive and consistent in predicting hydrogen front movement and breakthrough. In general, the temperature profiles in the Center Pipe vary with hydrogen feed rate and inert gas flow rate. The hydrogen front is sharpened by slower inert gas flow. Hydrogen breakthrough always starts when the final monitored temperature in the Center Pipe, TE-15, reaches a peak. This is determined from the seven runs which also use the thermal conductivity detector (TCD) to measure hydrogen breakthrough. The TCD is reliable and sensitive to ppm levels of hydrogen. The peak temperature and timing at each TC position is hard to predict exactly ahead of time. In general, the use of a TCD in hydrogen processing, or an ion chamber in tritium gas processing, provides a more definitive gauge of breakthrough than temperature. However, they are both lagging indicators. The recommended instrumentation for detecting tritium/hydrogen breakthrough is to supplement composition measurement with two or three temperature readings in the top part of the FTB center pipe.
As expected, there is an axial temperature gradient in the FTB, with the temperature increasing by about 5 oC toward the uninsulated base of the FTB during hydrogen absorption, with FTB undergoing cooling.
Flow Through Bed Temperature - Desorption
Typical FTB hydrogen desorption heating temperature profiles are shown in Fig. 12. Heater temperatures may be read in the initial phase of heating and when power is turned off to heaters that were powered on for a while. Heater temperatures cannot be read accurately once heaters reach full power due to signal noise. Fig. 12 shows desorption for a run with FTB initially at –40 oC. Improved cable routing and shielding resulted in reduced signal noise in the later run. Fig. 12 shows that heating of the FTB prototype to desorption temperature may be achieved in about 45 minutes, starting at ambient temperature. Starting at –40 oC takes an extra 15-20 minutes, as extrapolated from Fig. 12 data. An additional 1-2 hours are needed for bed temperature to equilibrate and pump down.
Fig. 12 data also show that there is significant temperature variation between heaters of up to 80-110 oC. It is not clear whether this is due to actual heater performance or because of thermocouple placement, or most likely, a combination of the two. The maximum heater temperature recorded was about 510 oC in Fig. 12 versus the 700 oC spikes suggested by the noisy signals.
FTB Hydrogen Operating Capacity
The FTB hydrogen capacity is effectively determined by multiplying the hydrogen flow rate by the flow time interval to breakthrough, since hydrogen removal efficiency is about one.
Figure 10. FTB Temperature profiles during cooling. Bed was filled
with helium for heat transfer.
The cooling coils experienced liquid nitrogen
temperature for about 30 minutes near start of cooling.
Difference in inlet
nitrogen temperatures indicates cooling nitrogen was not evenly distributed.
Figure 11. Hydrogen Absorption Temperature Profiles in the FTB
annulus
and inner pipe. Time step = 10 sec.
Test results show that the working capacity of the FTB prototype varies inversely with the inert gas flow, and ranges between 105 and 130 liters of hydrogen gas. This is expected as a smaller inert gas flow is expected to produce a sharper absorption front, less hydrogen dispersion and fuller utilization of the Pd/k. The bed has a calculated capacity of 7.9 moles or 177 liters of hydrogen gas. This is based on a weight of 3.06 kg for Pd in the Pd/k and a H/M loading of 0.55. The difference between the calculated and observed capacities represents the "working heel" of hydrogen in the palladium. The initial hydrogen absorption run indicates that 180 liters of hydrogen were absorbed before breakthrough. This is quite reasonable and suggests that some hydrogen was used to reduce Pd oxides that might have been present.
Liquid Nitrogen Usage
The FTB cooling data show that a flow bed temperature of –40 oC in the center pipe can be achieved in about 6 hours if the bed were initially filled with an inert gas. Under vacuum, cooling of the FTB to temperature can take up to 3 times as long. Cooling nitrogen gas exhaust flow rate was measured in the first seven runs. The results show that about 60 cfm of gaseous nitrogen is used during cooling to –40 oC and 15 cfm to maintain FTB at –40 oC. In terms of liquid nitrogen, the usage is ~60 cc/min during cooling and ~15 cc/min to maintain FTB temperature at –40 oC. Thus cooling FTB to –40 oC requires 22-66 liters of liquid nitrogen, depending on whether the bed is initially filled with an inert gas heat transfer medium or not. The liquid nitrogen usage is a function of the ventilation airflow in the hood. Operation of the FTB in a glovebox is expected to use less liquid nitrogen, due to more stagnant gas flow and less heat pick-up in a glovebox.
The use of an open-close solenoid valve in our tests resulted in inlet cooling nitrogen temperature that cycled within about 5 oC. The cycling nature is a function of the data collection period and is most obvious with a collection time of 10 seconds. Exhaust nitrogen gas temperature exhibits much reduced cycling compared with the inlet cooling nitrogen.
Conclusions
The performance of 14 hydrogen absorption-desorption cycles on the FTB prototype show that it is a compact hydrogen-inert gas separator that efficiently separates and stores hydrogen from gas streams with high hydrogen content. The testing program also successfully demonstrated the operability of an automated single-pass liquid nitrogen cooling system.
Figure 12. FTB Temperature profiles in the heaters, bed annulus
and center pipe during hydrogen desorption.
Time step = 10 sec. Heating started with FTB at –40 oC. First desorption
heater temperatures range between
356 and 464 oC. Second desorption heater temperatures range between
410 and 511 oC.