WSRC-MS-2001-00678
R. L. Buckley, A. H. Weber and J. H. Weber
Westinghouse Savannah River Company
Aiken, South Carolina 29808
This report was prepared as an account of work sponsored by an agency of the United States Government. Neither the United States Government nor any agency thereof, nor any of their employees, makes any warranty, express or implied, or assumes any legal liability or responsibility for the accuracy, completeness, or usefulness of any information, apparatus, product or process disclosed, or represents that its use would not infringe privately owned rights. Reference herein to any specific commercial product, process or service by trade name, trademark, manufacturer, or otherwise does not necessarily constitute or imply its endorsement, recommendation, or favoring by the United States Government or any agency thereof. The views and opinions of authors expressed herein do not necessarily state or reflect those of the United States Government or any agency thereof.
This report has been reproduced directly from the best available copy.
Available for sale to the public, in paper, from: U.S. Department of Commerce, National Technical Information Service, 5285 Port Royal Road, Springfield, VA 22161, phone: (800) 553-6847, fax: (703) 605-6900, email: orders@ntis.fedworld.gov online ordering: http://www.ntis.gov/support/ordering.htm
Available electronically at http://www.osti.gov/bridge/
Available for a processing fee to U.S. Department of Energy and its contractors, in paper, from: U.S. Department of Energy, Office of Scientific and Technical Information, P.O. Box 62, Oak Ridge, TN 37831-0062, phone: (865 ) 576-8401, fax: (865) 576-5728, email: reports@adonis.osti.gov
The Savannah River Site (SRS) is a Department of Energy (DOE) complex covering roughly 800 km2 of southwest South Carolina. Traditionally, hazards posed by SRS operations have been associated with nuclear reactors, waste-vitrification facilities, chemical reprocessing plants, or fuel fabrication. Therefore, facilities such as the SRS rely on the predictive capabilities of dispersion models to assess possible emergency response actions. Accurate and timely wind field input to these models is crucial. For the initial and lateral boundary conditions, steady-state (diagnostic) winds are commonly used because they can be obtained with minimal computational effort; however, their use can cause serious prediction errors during changing weather conditions. Recent advances in computing speed enables mesoscale numerical models to generate three-dimensional prognostic fields in an attempt to describe these variations. It is important to assess the accuracy of the model simulations. There are numerous difficulties in making direct comparisons of model output with observations (Nappo et al., 1982), including the comparison of spatially averaged model results with observations representing point values, inadequate model formulation, inaccurate boundary conditions, and observational errors. Systematic differences (e.g., model physics errors) should affect predicted model output in a consistent way, while data errors are generally random.
These simulations were performed using the Regional Atmospheric Modeling System (RAMS, Pielke et al., 1992), a finite-difference, primitive equation, three-dimensional mesoscale model originally developed at Colorado State University. In this application, a domain with 20-km horizontal grid spacing was used to generate 24-hr forecasts of meteorological conditions over the two-state region covering Georgia and South Carolina. The variables examined are wind speed and direction, turbulence intensity, and temperature. The atmospheric turbulence intensity is determined from the standard deviation of azimuth and elevation angle (sA and sE). These are not typically measured at National Weather Service (NWS) stations; however, instrumented towers at the SRS routinely make such measurements. The RAMS code was modified to calculate sA and sE values at one-hour intervals from the resolved and subgrid-scale velocity components. (Horizontal wind components were used in the determination of sA, while horizontal wind speed and vertical velocity were used in calculating sE).
Some objective statistical measures for comparing model predictions and observations used in this study are taken largely from Cox et al. (1998), who compared a suite of mesoscale model predictions (including RAMS) for a variety of global locations. From Cox et al. (1998), the forecast accuracy criterion for wind direction was chosen to be 30°. The desired range for the azimuth angle deviation was assumed to be 5°. This value was chosen since these values do not typically exceed 30° during one-hour time periods, which is one-sixth of the horizontal wind direction range (180°), and 5° is one-sixth of the horizontal wind direction criterion. The elevation angle deviation is generally half the azimuth angle deviation, so the range for sE deviation was assumed to be 2.5°. A wind speed accuracy of 1 m s-1 for winds at the surface was selected, while at higher atmospheric levels, the range was relaxed to 2.5 m s-1. In addition, the preferred temperature accuracy was 2°C.
Wind direction is the most important variable in terms of reliable emergency response guidance. Horizontal wind speed determines plume dilution, while sA and sE are important for dispersion calculations. In general, reduction in wind direction and speed errors will be more important in an operational setting than small errors in the turbulence intensity.
This paper describes the statistical measures used to compare several observed and predicted meteorological variables for the southeastern United States spanning two full years (April 1998 to March 2000). Six different locations within the model domain were selected, with the majority of comparisons being made at the surface, since application to operational work performed at the SRS is at or near the ground level.
RAMS simulations are initialized using large-scale data available from NOAA and lateral boundary conditions are generated at 6-hr intervals thereafter, with simulations being updated twice daily (based on 00 and 12 GMT data). For this study, the actual simulation spans 30 hours, but the first 6 hours are ignored while the model is ‘spinning up’ a realistic boundary layer. Because the large-scale data typically take 3 to 4 hours to be processed, the 6-hr forecast from the NOAA data are used as initial conditions for the RAMS simulations (i.e., starting at 06 or 18 GMT). Therefore, a RAMS simulation using large-scale data analysis valid at 00 GMT provide a 24-hr forecast beginning at 12 GMT. Modifications to RAMS were also made to generate standard deviations of azimuth and elevation angle considering the sum of a resolved and subgrid-scale component. For the two-year period, a total of 1462 simulation periods could have been generated. However, due to a variety of problems including missing large-scale data, script errors, or computer outages, only 1337 simulations were created.
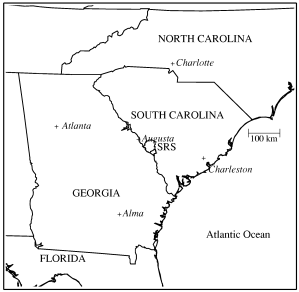
Figure 1. Modeling domain and observation locations
Observations were taken from NWS stations within the domain (Fig. 1), as well as at a tower centrally located within the SRS. Wind and temperature observations for the NWS sites are at 10 and 4 m AGL, respectively, while the SRS tower measurements are at 18 and 36 m AGL. The lowest model level in RAMS was 26 m AGL, so linear interpolation between the 18 and 36-m levels for the SRS values was used. (Note that for the SRS location, interpolated values are only available beginning in February 1999). The values at the NWS stations are compared at the differing heights, with the understanding that model biases will arise in the results due to varying heights.
For the NWS regional stations, observed and simulated wind speed, direction, and temperature were compared over the 24-hr forecast period using data gathered in 2-hour increments. For the SRS location, turbulence intensities (sA, sE) were also compared. Upper-air comparisons at 850, 700, 500, and 300 mbar were also made at Atlanta and Charleston, using NWS upper-air sounding data. Besides breaking down results as a function of forecast hour, the statistics were presented based by time of year. The former gives insight into possible model degradation over time, while the latter shows specific biases related to seasonal events. In this study, results were broken up into monthly averages and applied to comparisons both at the surface and aloft. A small portion of these results is discussed in this report.
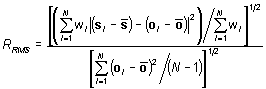
Define si and oi as the simulated and observed value of the ith point, respectively, of which there are a total of N points. The mean difference between simulation and observation is given by
![]() . (1)
. (1)
Similarly, the mean absolute bias is determined by taking the absolute difference between all simulated and observed values and determining an average
![]() , (2)
, (2)
while the standard deviation of the difference is estimated by:
![]() . (3)
. (3)
The percentage of data points falling within the desired criteria were also determined. Sampling distributions for the means are typically assumed to be normal if N is large.
The wind direction was handled differently due to the problems associated with overlap from 0 and 360°. (For example, the difference for qs = 350° and qo = 10° may be interpreted as 340° or as 20°). Thus, wind direction differences were constrained to be an absolute value between 0 and 180°.
The skill of the model may be determined using the ratio of the root-mean-square error to the standard deviation of the observations (Keyser and Anthes 1977). This may be written
 (4)
(4)
where the scalar weighting term, w, is set to unity, and vector quantities denote the possible use of wind vectors in the calculations. This ratio should be less than unity to show skill in making a prediction.
Although results are available for all 6 locations, for brevity, surface comparisons are shown in Table 1 for the SRS location only, since turbulence intensity comparisons are available. Statistical measures as defined by Eqs. (1)-(3) are given for forecast times at 6-hr increments, along with the objective criteria. It is evident that the absolute mean bias for wind direction increases with forecast time with biases on the order of 30 to 40°. Absolute wind direction errors less than 30° are registered 55-65% of the time which compares favorably with values obtained in Cox et al. (1998) when using RAMS. On the other hand, poorly forecasted wind directions (>75°, not shown) occur between 10 to 15%. For emergency response use, it is important that directional errors of this kind be reduced.
Table 1. Comparisons at the Savannah River Site over the 14-month period (801 £ N £ 816)
|
Wind Direction (°) |
Wind Speed (m s-1) |
Temperature (K) |
||||||||
|
f(hr) |
|
*P30 |
|
|
sDiff |
*P1 |
|
|
sDiff |
*P2 |
|
0 |
31.2 |
65.8 |
0.376 |
0.86 |
1.07 |
84.0 |
0.675 |
1.99 |
2.52 |
72.4 |
|
6 |
33.1 |
61.6 |
0.658 |
1.17 |
1.39 |
75.0 |
0.539 |
2.02 |
2.61 |
71.3 |
|
12 |
36.2 |
58.3 |
0.488 |
0.99 |
1.19 |
82.1 |
0.411 |
2.26 |
2.90 |
66.9 |
|
18 |
37.4 |
55.9 |
0.635 |
1.20 |
1.42 |
73.6 |
0.009 |
2.42 |
3.32 |
64.0 |
|
24 |
38.3 |
57.1 |
0.479 |
1.02 |
1.25 |
80.4 |
0.182 |
2.42 |
3.15 |
62.3 |
|
Azimuth angle, sA (°) |
Elevation angle, sE (°) |
|||||||||
|
f(hr) |
|
|
sDiff |
*P5 |
|
|
sDiff |
*P2.5 |
||
|
0 |
2.86 |
6.40 |
8.20 |
76.6 |
-1.06 |
2.86 |
3.77 |
75.5 |
||
|
6 |
-1.22 |
8.35 |
14.4 |
64.6 |
-0.92 |
4.09 |
7.75 |
69.7 |
||
|
12 |
3.43 |
6.83 |
9.83 |
73.4 |
-0.58 |
3.02 |
4.69 |
73.3 |
||
|
18 |
-1.22 |
8.32 |
14.2 |
64.3 |
-0.96 |
4.31 |
8.14 |
68.8 |
||
|
24 |
3.42 |
6.79 |
9.62 |
74.9 |
-0.65 |
3.06 |
4.45 |
72.0 |
||
*Px: Percentage of data points within ± x value of the observation for the given units
Horizontal wind speed values indicate a small positive mean difference. The absolute mean bias and standard deviation difference tends to increase with forecast times, but is worse at the 6 and 18-hr forecast times. This can be traced to the average observed wind speed during this period being higher (i.e. mid-afternoon). However, the objective criterion is met roughly 75% of the time or better.
For temperatures, there is a slight positive bias at all
times, with decreasing performance in time (![]() ,sDiff).
The percentage of data within the threshold exceeds Cox et al. (1998) values
of 40 to 60%. However, it should be noted that temperature comparisons within
± 2 K for other locations and forecast times
in this study ranged from 48% to 75%.
,sDiff).
The percentage of data within the threshold exceeds Cox et al. (1998) values
of 40 to 60%. However, it should be noted that temperature comparisons within
± 2 K for other locations and forecast times
in this study ranged from 48% to 75%.
Values for sA and sE indicate similar declines in performance at the 6 and 18-hr forecast periods. For both quantities, the criteria of ± 5 and ± 2.5° was met roughly 65 to 75% of the time for a given forecast hour. The underestimate in elevation angle is related to vertical velocity used to calculate the simulated value. Previous studies using RAMS (Lyons et al., 1995) have shown finer horizontal grid spacing results in larger vertical velocity terms. The variation in vertical velocity for 20-km grid spacing is not as great as the measured values, leading to an under-prediction.
Table 2 shows results for Charleston at both the surface and aloft (at 4 different pressure levels) for winds and temperature at 0, 12, and 24 hr forecast periods. Absolute bias in wind direction tends to increase with time at all levels, while directional errors are reduced with increasing height. Cox et al. (1998) obtained upper-air percentages between 80 and 95% for a range of 30° for all vertical levels (10 levels between 1000 and 100 mbar) considered. At the 30° interval for the 4 levels and cities chosen in this study, the range is from 70 to 90%. Improvement at the upper levels in direction is the result of less variability with decreasing pressure.
Table 2. Comparisons at Charleston, South Carolina over the two-year period (941 £ N £ 1288)
|
Wind Direction (°) |
Wind Speed (m s-1) |
Temperature (K) |
|||||||||
|
Level |
f(hr) |
|
*P30 |
|
|
sDiff |
*P1/2.5 |
|
|
sDiff |
*P2 |
|
0 |
29.9 |
67.5 |
0.039 |
0.98 |
1.27 |
76.6 |
1.59 |
2.09 |
2.27 |
74.1 |
|
|
Surface |
12 |
33.1 |
64.2 |
0.141 |
1.07 |
1.38 |
74.0 |
1.27 |
2.04 |
2.34 |
71.7 |
|
24 |
35.5 |
61.3 |
0.132 |
1.15 |
1.51 |
71.4 |
1.16 |
2.12 |
2.54 |
70.2 |
|
|
0 |
26.3 |
72.2 |
-0.431 |
2.14 |
2.77 |
77.6 |
-0.0818 |
0.957 |
1.34 |
94.1 |
|
|
850 mbar |
12 |
27.9 |
71.4 |
-0.199 |
2.35 |
3.17 |
76.6 |
-0.239 |
1.11 |
1.51 |
90.0 |
|
24 |
29.3 |
69.4 |
-0.0571 |
2.58 |
3.43 |
72.6 |
-0.241 |
1.20 |
1.63 |
88.2 |
|
|
0 |
21.0 |
80.4 |
-0.620 |
2.13 |
2.74 |
76.7 |
-0.256 |
0.882 |
1.17 |
93.8 |
|
|
700 mbar |
12 |
22.0 |
79.0 |
-0.733 |
2.45 |
3.18 |
72.2 |
-0.515 |
1.07 |
1.34 |
88.8 |
|
24 |
24.3 |
77.1 |
-0.592 |
2.72 |
3.56 |
68.1 |
-0.750 |
1.22 |
1.41 |
83.6 |
|
|
0 |
14.6 |
89.7 |
-0.544 |
2.30 |
3.18 |
76.4 |
0.0459 |
0.702 |
1.20 |
97.9 |
|
|
500 mbar |
12 |
16.5 |
87.2 |
-0.993 |
2.63 |
3.54 |
68.8 |
-0.0890 |
0.807 |
1.30 |
96.5 |
|
24 |
18.4 |
83.8 |
-1.10 |
2.88 |
3.93 |
66.7 |
-0.105 |
0.904 |
1.41 |
95.4 |
|
|
0 |
12.5 |
91.1 |
-0.0412 |
3.05 |
4.14 |
67.3 |
0.379 |
0.816 |
1.08 |
97.5 |
|
|
300 mbar |
12 |
14.0 |
89.8 |
-0.464 |
3.53 |
4.74 |
59.5 |
0.307 |
0.914 |
1.26 |
96.2 |
|
24 |
15.1 |
88.2 |
-0.628 |
4.04 |
5.35 |
54.0 |
0.338 |
1.01 |
1.30 |
95.3 |
|
*Px: Percentage
of data points within ± x value of the observation for the given units.
Note that
for speed, surface threshold is ± 1 m s-1 and for upper levels
it is ± 2.5 m s-1.
Wind speed is over-predicted at the surface, and under-predicted
aloft. A decline at upper levels in performance (![]() ,sDiff)
is also indicated. The latter occurs because the magnitude of the speed at lower
pressure levels is generally higher. The desired criteria are met between 50
and 80% of the time, which is somewhat lower than that obtained by Cox et al.
(1998). Prediction of temperature also degrades with forecast time (
,sDiff)
is also indicated. The latter occurs because the magnitude of the speed at lower
pressure levels is generally higher. The desired criteria are met between 50
and 80% of the time, which is somewhat lower than that obtained by Cox et al.
(1998). Prediction of temperature also degrades with forecast time (![]() ,
sDiff)
at all levels. However, the overall agreement is better at higher levels in
the atmosphere.
,
sDiff)
at all levels. However, the overall agreement is better at higher levels in
the atmosphere.
A plot of average bias (Eqs. 1 and 2) as a function of forecast time for Augusta is depicted in Fig. 2 for winds and temperature. This figure contains differences between observations and simulations at 2-hr intervals (from the 0-hr to the 24-hr time period) as averaged over an entire month for simulations using 00 GMT large-scale analysis times (with forecast times beginning at 12 GMT). Each line within the plot represents a different month (covering the 2-yr period of interest). Once again, the wind direction bias is forced to be between 0 and 180°. These figures are useful because conclusions may be determined regarding forecast accuracy as a function of the time of year, as well as the time of day.
The wind direction error as a function of time of day tends to be highest after the transition period from sunlight to darkness (~00 GMT to 06 GMT). However, this does not seem to be the case for wind speed. The temperature bias clearly shows underestimates in the late morning and overestimates overnight. Seasonally, the worst positive bias typically occurs during the warmer months, while negative bias tends to be higher in the cooler months. The large shift in bias from under- to over-prediction at ~00 GMT and from over- to under-prediction at ~12 GMT is likely related to radiative transfer calculations in RAMS, or to differences in measurement heights between model and observation. Although not shown, there is also a clear relationship with simulated moisture content during this transition (00 GMT). On those occasions when temperature is severely under-predicted, dew-point temperature is severely over-predicted. In this case, the soil moisture content may be too large initially, leading to wetter, cooler conditions than observed. Alternatively, when the temperatures are too high, dew-point temperature is often too low. The soil moisture content may be too low initially, resulting in dryer, hotter conditions than measured. In summary, the prognostic model has difficulty with the transition from daytime to nocturnal conditions, particularly in the prediction of temperature (and moisture) fields.
The RMS ratio (Eq. (4)) is illustrated in Fig. 3 for the 6 locations. In the top half of the figure, average values over all months at a given forecast time are shown for vector winds and temperature for the 00 GMT analysis file simulations. The bottom half of Fig. 3 shows the ratios for each observing location as a function of month, averaged over all forecast times. The dropouts for Alma correspond to the nocturnal period in which measurements are not taken.
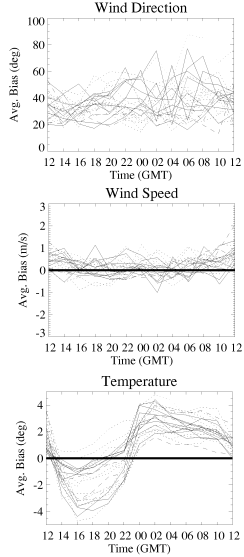
Figure 2: Plots of absolute bias (wind direction)
or mean difference (wind speed, temperature)
as a function of the time of day in the forecast for Augusta, Georgia. In this
case, simulations using the analysis valid for a time of 00 GMT are used
to generate a forecast. Note that 12 GMT is an early morning period for
this location. Each line represents an average over all simulations
within a given month (24 months in all) for the resulting difference
between simulation and observation.
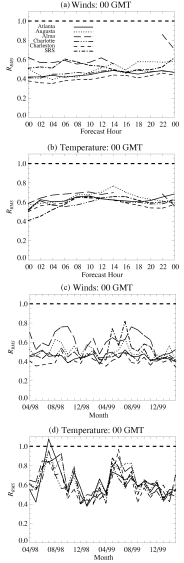
Figure 3: Plots of the ratio of root-mean-square
error to observed standard deviation. The top panels show RRMS
as a function of the forecast time for the six different locations for (a) vector
winds, and
(b) temperature. Each value at a given forecast time is averaged over all months
from April 1998 to March 2000. The bottom panels show RRMS as a function
of the
month for the six different locations. Each value for a given month is averaged
over all forecast times from 0 to 24 hours at 2-hr increments.
In most cases, RRMS<1, indicating that the RAMS model shows some skill in forecasting averaged trends in winds and temperature. For wind comparisons, all locations show RRMS~0.5, except for Alma. Although values for RRMS are only slightly higher for temperature than winds, it has been found (not shown) that a much more significant bias exists for the temperature, especially for 12 GMT simulations. A rise in RRMS for temperature (Fig. 3b) after 12 GMT is also seen in Fig. 2c. For both sets of simulations, ratios at Charleston appear to be lowest.
On a monthly basis (Fig. 3c), wind ratios do not generally indicate a trend as a function of the time of year, with the exception of Alma, which worsens during the warmer months. The maximum ratios for temperature are seen during the summer of 1998, and somewhat less during the warmer season of 1999.
There are numerous reasons for the model biases. In RAMS, temperature differences between the ground and the lowest atmospheric levels affect surface fluxes of sensible heat, momentum and moisture, leading to changes in surface speeds. Overestimates in temperature lead to higher heat and momentum fluxes, hence higher wind speeds. Overall temperature errors seem to be higher during the cooler months for the inland locations (Augusta and Atlanta), indicating possible problems with surface energy budgets in the model. Deficiencies within the radiation and soil parameterizations, as well as the initial soil moisture selected for the model simulations all contribute to this error. There are numerous studies that address this very problem (e.g. Wilson et al. 1987). Of special concern is the large error that occurs during the transition from day to night (and vice-versa). Another issue deals with precipitation. Although RAMS can be configured to generate precipitation, it is more time-consuming, which limits its use in an operational capacity. The operational version used at SRS generates precipitation through convective parameterization, but does not incorporate explicit microphysics, possibly leading to poorer results for those times in which rainfall occurs.
The RAMS simulations are valuable because they provide meteorological information in data-sparse regions and as a forecast. The statistical comparisons discussed here have shown that the model can generate realistic results with skill. A major weakness is seen to be reliance on accurate input conditions (i.e. large-scale synoptic models) which drive the mesoscale model initial and lateral boundary conditions. One way to alleviate biases introduced as a result of large-scale model errors, is to use four-dimensional data assimilation (e.g. Stauffer and Seaman 1990). This will typically provide improved accuracy several hours beyond the initial simulation time period with the bulk of the measurements being restricted to the surface. The initial state of the atmosphere for the current RAMS simulations could be improved by using the local SRS tower data, which are available in 15-minute averages. This has already been done on an experimental basis (Fast et al. 1995) and would be particularly important for local transport applications.