
WSRC-MS-2001-00056
Ground Truth Collections at the MTI Core Sites
A. J. Garrett, R. J. Kurzeja, M. J. Parker, B. L. O’steen,
M. M. Pendergast, and Eliel Villa-Aleman
Westinghouse Savannah River Company
Aiken, SC 29808
This report was prepared as an account of work sponsored by an agency of the United States Government. Neither the United States Government nor any agency thereof, nor any of their employees, makes any warranty, express or implied, or assumes any legal liability or responsibility for the accuracy, completeness, or usefulness of any information, apparatus, product or process disclosed, or represents that its use would not infringe privately owned rights. Reference herein to any specific commercial product, process or service by trade name, trademark, manufacturer, or otherwise does not necessarily constitute or imply its endorsement, recommendation, or favoring by the United States Government or any agency thereof. The views and opinions of authors expressed herein do not necessarily state or reflect those of the United States Government or any agency thereof.
This report has been reproduced directly from the best available copy.
Available for sale to the public, in paper, from: U.S. Department of Commerce, National Technical Information Service, 5285 Port Royal Road, Springfield, VA 22161, phone: (800) 553-6847, fax: (703) 605-6900, email: orders@ntis.fedworld.gov online ordering: http://www.ntis.gov/support/ordering.htm
Available electronically at http://www.osti.gov/bridge/
Available for a processing fee to U.S. Department of Energy and its contractors, in paper, from: U.S. Department of Energy, Office of Scientific and Technical Information, P.O. Box 62, Oak Ridge, TN 37831-0062, phone: (865 ) 576-8401, fax: (865) 576-5728, email: reports@adonis.osti.gov
Abstract
The Savannah River Technology Center (SRTC) selected 13 sites across the continental US and one site in the western Pacific to serve as the primary or core site for collection of ground truth data for validation of MTI science algorithms. Imagery and ground truth data from several of these sites are presented in this paper. These sites are the Comanche Peak, Pilgrim and Turkey Point power plants, Ivanpah playas, Crater Lake, Stennis Space Center and the Tropical Western Pacific ARM site on the island of Nauru. Ground truth data includes water temperatures (bulk and skin), radiometric data, meteorological data and plant operating data. The organizations that manage these sites assist SRTC with its ground truth data collections and also give the MTI project a variety of ground truth measurements that they make for their own purposes. Collectively, the ground truth data from the 14 core sites constitute a comprehensive database for science algorithm validation.
Keywords: Validation, Verification, Ground Truth, Multispectral Imaging
Introduction
The Multi-spectral Thermal Imager (MTI) satellite was designed and developed by the Department of Energy’s (DOE) Sandia National Laboratories (SNL), Los Alamos National Laboratory (LANL) and the Savannah River Technology Center (SRTC) to make highly accurate radiometric measurements in each of its 15 wavebands, which cover the visible, near-infrared, mid-wave infrared and thermal infrared. Los Alamos National Laboratory (LANL) led the effort to develop a set of science algorithms that are to be tested using MTI imagery and ground truth. Smith et al.1 described these 16 science algorithms. SRTC has primary responsibility for taking ground truth data for validation of the MTI science algorithms. Garrett et al.2 explained the rationale for ground truth site selection that led to the final set of 14 core sites listed in Table 1 and located on the map in Figure 1. Accurate surface temperature retrieval is a basic objective of the MTI project; so many of the sites were selected with this objective in mind.
Over a period of two years prior to the March 2000 launch of MTI, SRTC contacted the mangers of these sites and developed collaborative agreements in which MTI imagery is exchanged for site data. Most of the agreements are informal, although there is a formal Space Act Agreement (SAA) between NASA’s Stennis Space Center and the DOE. Site data includes ground truth measurements taken by SRTC, operating data such as cooling water discharge temperatures and flow rates and site meteorological data. Some sites also take extensive radiometric measurements, specifically DOE’s Atmospheric Radiation Measurements (ARM) sites in north-central Oklahoma and the island of Nauru in the western Pacific.
The following sections of this paper will present ground truth data and MTI imagery from a subset of the sites listed above.
Ground Truth Data from MTI Core Sites
Ivanpah Playa
Ivanpah playa is a dry desert lake bed located about 60 km southwest of Las Vegas. It is easily accessible from Interstate 40 and is a popular site for making surface reflectivity measurements for validation of remote sensing systems. SRTC measured surface reflectivities at Ivanpah with the support of the University of Arizona remote sensing group. SRTC made the measurements with Applied Spectral Devices (ASD) field spectrometers. Supporting data included atmospheric moisture and temperature profiles measured by radiosondes and aerosol loading measured by a sun photometer.
Figure 2 is a true color MTI image of Ivanpah playa that shows the part of the playa where SRTC made ground truth measurements. The surface reflectivities of that part of the playa were fairly uniform, ranging from about 0.43 to 0.47 over a region about 300 m on a side. Figure 3 is a sample spectrum from the September 15-16, 2000 ground truth collection at Ivanpah. The spectra from which this sample was selected were taken with an ASD field spectrometer. A corresponding spectrum calculated with the MODTRAN code using meteorological, aerosol and reflectivity from the ground truth data is included for comparison. Based on extensive laboratory calibrations by ASD and by SRTC, we believe that the reflectivities derived from these spectra have a maximum uncertainty of no more than 5 percent, with 3 to 4 percent the more likely level of uncertainty.
Stennis Space Center
Stennis Space Center (SSC) is located in southern Mississippi about 70 km northeast of New Orleans. As a part of its Commercial Remote Sensing Program (CRSP), SSC has constructed ground truth facilities such as several large surface targets of varying reflectivities and geometries. Specifically for MTI, SSC duplicated an instrumented buoy designed by SRTC to measure water "skin" temperatures, i.e., the temperature of the thin layer of water detected by thermal radiometers. In addition to the radiometers used to measure skin temperatures, the instrumented buoys measure bulk (subsurface) water temperatures, solar and downwelling thermal radiation, wind speed, temperature and dewpoint temperature. On August 10, 2000 SRTC and SSC deployed their respective skin temperature rigs in SSC’s HPIW reservoir at the time MTI imaged the site (Figure 4).
In this side-by-side data collection, both rigs measured skin and bulk water temperatures that were very close to each other (Figure 5), which implies that the absolute calibrations of both sets of instruments were highly accurate. Note in Figure 5 that the skin temperatures were roughly 0.5° C colder than the bulk water temperatures, which were measured at a depth of 10 cm. This depression of the skin temperature relative to the bulk water temperature is typical, because normally bodies of water are losing energy to the atmosphere via the combined mechanisms of evaporation, sensible heat loss and longwave flux divergence.
Skin temperature depressions are often large enough to constitute a significant source of error when water temperature measurements are compared to MTI temperature retrievals. Since it is not practical to measure skin temperatures at many of the MTI core sites on a long-term continuous basis, bulk water temperatures must be adjusted to equal as nearly as possible the skin temperature. SRTC has developed a model to predict skin temperature depression based on bulk water temperature and meteorological conditions. Garrett et al.3 describe the work being done on skin temperature measurements and modeling as a part of the MTI project.
Crater Lake
Crater Lake is managed by the National Park Service (NPS), which supports and collaborates on research in the lake conducted by universities and other government agencies. Oregon State University (OSU) maintains an instrumented buoy located over the deepest part of the lake, which takes water temperatures down to several hundred meters depth plus meteorological data. SRTC also has a water temperature sensor on the buoy, which agrees closely with the OSU instrumentation (Fig. 6).
The accuracy of the calibrations of the temperature sensors in Figure 6 can also be inferred by the behavior of the short-term temperature excursions (spikes). Water is most dense at 4°C. Note that at temperatures below 4°C, the spikes point downward and at temperatures above 4°C the spikes point upward. The upward-pointing spikes were formed on calm clear days that produced a heated layer of water near the surface. This is normal thermal stability (warmer, less dense water over colder, more dense water). The downward-pointing spikes were formed on calm, cold days when heat losses to the atmosphere were greater than the solar heating. These were cases of inverted thermal stability, when colder, less dense water lies over warmer, denser water. The fact that the upward and downward pointing spikes are separated by the 4°C isotherm indicates that the instrument calibrations are correct.
MTI imagery is helping the OSU and NPS researchers better understand the cycling of nutrients in Crater Lake, much of which occurs over periods of days in the winter when strong winds and nearly neutral thermal stability allow the lake to mix or "turn over" down to great depths. Fig. 7 shows visible (a) and thermal (b) images of Crater Lake on a day when strong southwest winds were forcing warmer surface waters over to the eastern side of the lake. Streaks of higher reflectivity can be seen on the water in the visible image in areas where stronger winds roughened the surface. The winds forced colder water to upwell on the western side of the lake, producing the horizontal gradient of temperature apparent in the thermal image.
When MTI imagery such as that shown in Fig. 7 is combined with the profile data from the buoy, it will help the OSU and NPS researchers understand the three-dimensional progression of the lake mixing events.
Pilgrim Power Plant
The Pilgrim nuclear power plant is located on the Atlantic Ocean about 20 km north of the neck of Cape Cod. This 660 MWe reactor discharges water containing waste heat to the ocean, where wind-driven currents, turbulence and heat losses to the atmosphere carry it away. The locations of the temperature sensors used for MTI ground truth measurements at Pilgrim are shown in Fig. 8. The cooling water intake is near sensor A and the discharge canal contains sensors F and Fa. It can be seen from Fig. 8 that there is potential for recirculation of the heated water back into the intake when the winds blow the discharge flow to the right (winds from the northwest).
Figure 9 contains two MTI images that show the thermal plume created by the waste heat from the Pilgrim power plant on two days with different wind directions. Although the tidal amplitude at the Pilgrim plant is typically 2.5 m, tidally forced currents at Pilgrim are weak due to the shape of the coastline in that area. Winds control the movement of Pilgrim’s thermal plumes, which on the two image days were from the northwest (9a) and southeast (9b). In the case of Figure 9b, the winds had recently shifted direction, leaving some warm water along the coast to the southeast. So in both cases there is evidence of recirculation of the thermal effluent back into the cooling water intake.
Nauru
Nauru is a small island located on the equator about 1500 km east of New Guinea in the western Pacific. It is the site of one of DOE’s Atmospheric Radiation Measurements (ARM) sites. (The other ARM sites are in north-central Oklahoma and Alaska.) The ARM sites take large amounts of atmospheric and radiometric data, which makes them ideal sites for validation of many of MTI’s science algorithms. Fig. 10 is an MTI image of Nauru that shows what appear to be clouds generated by the presence of the island, which acts as a local heat source during the day and is also a discontinuity in frictional drag. Images such as Fig.10 are of interest to the ARM researchers, because they give them insight into island effects on their data, which are supposed to be representative of the atmosphere above the tropical ocean, not land.
In collaboration with the ARM site personnel based at Los Alamos National Laboratory and at Nauru, SRTC is directing the collection of bulk water temperatures in the ocean just offshore from Nauru. There are two methods for taking the water temperatures: by boat (more expensive) and by casting rig (cheap). The second method would be the preferred method because it is inexpensive, but it is hampered by the inability of the ARM personnel to reliably cast far enough offshore to ensure that true open-ocean water temperatures are being taken that are unaffected by the nearby island. Fig. 11 is a sample of the casting rig data. It can be seen from the annotations in Fig. 11 that the analyst must have a clear idea of the method used to collect this data, or he could be led astray.
Comanche Peak
The Comanche Peak nuclear power plant southwest of Fort Worth, Texas has two 1124 MWe generating units which discharge approximately 4500 MW of waste heat to the Squaw Creek reservoir, 13 km2 cooling lake. The Comanche Peak intake and discharge pipes are both about 10 m below the water surface. As a result, the thermocline in Squaw Creek reservoir starts at a depth of about 15 m, which is very deep. The deep thermocline combined with the size of the lake and the large amount of heat being dissipated combine to give this lake unusually large thermal inertia. That is, the bulk water temperature responds sluggishly to changes in the weather and the heat load. This characteristic makes it well suited to serve as a primary site for testing MTI temperature retrieval algorithms because the absolute temperatures and temperature distributions vary little from one image to the next, particularly in the summer.
Fig. 12 shows water temperatures from two SRTC sensors located near the cooling water discharge and intake during several weeks late in the summer of 2000. The discharge temperature in particular is close to constant, hovering near 40°C for weeks. The inlet temperature exhibits greater variability, because it is near the surface at a depth of about 20 cm and experiences larger diurnal variations in temperature because surface currents and turbulent mixing are weak in that area of the lake.
As stated in the Introduction, SRTC established agreements with the core site managers to exchange MTI imagery for various types of site data. Fig. 13 is an example of MTI images that have been processed to the point that it is useful to the utility: calibrated, land masked out and warped to a nadir perspective. MTI’s resolution is sufficient to capture details of cooling lake performance of interest to the utility. For example, the two cool spots near the mouth of the discharge arm of the lake were caused by "bubble-up" systems which discharge air at the bottom of the lake to produce a forced convection current that brings cool water from below the thermocline up into the hot surface layer of the lake. The small reduction in cooling water inlet temperature that this produces allows slightly higher power levels during the summer months. The MTI imagery provided the first unambiguous proof that the bubble-ups are producing some identifiable cooling of the lake.
Summary
The ground truth program described in this paper is producing a diverse set of databases that are being used to validate the MTI science algorithms and determine the accuracy of MTI’s radiometric data. In addition, the MTI imagery along with the ground truth is helping some core site managers with their research, and helping others better understand and optimize the mechanisms by which waste heat from their facilities is dissipated in the environment. The ground truth collections at many of these sites will probably continue for another year or more, because accumulating statistically significant numbers of usable images at the core sites is a time-consuming process.
References
Figure 1. Locations of MTI core sites.
Figure 2. MTI visible image of Ivanpah playa with location of calibration site.

Figure 3. Sample ASD field spectrometer spectrum from Ivanpah
ground truth collection plus Modtran calculation.
Figure 4. SRTC and SSC skin temperature rigs deployed in HPIW reservoir
Figure 5. Comparison of skin and bulk water temperatures measured
by SRTC and SSC skin temperature rigs
Figure 6. Temperature data from Oregon State University buoy
moored over deepest part of Crater Lake.
Figure 7. These MTI visible (a) and thermal (b) images of Crater
Lake show a cold area of upwelling
(dark area on left side of 7b) caused by winds and a brighter area on the right
where the winds pushed the warm surface layer. Brighter streaks in visible
image are areas where stronger winds produced more sunglint.

Figure 8. Temperature sensor locations near Pilgrim power plant
cooling water discharge and intake canals.
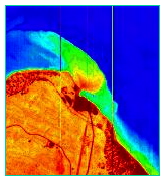
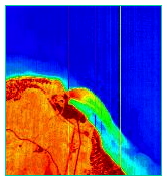
Figure 9. Thermal plumes from Pilgrim power plant blown toward
southeast by
northwest wind (a), and blown northwest by southeast wind (b).

Figure 10. MTI image of island of Nauru showing what appears
to be an island effect on cloud formation.
Figure 11. Time series of temperature measurements taken with
casting rig from jetty at Nauru harbor.
Figure 12. Summer 2000 cooling water inlet and discharge
temperatures at Squaw Creek reservoir.
Figure 13. Calibrated (°C),
masked and warped thermal images of Squaw Creek reservoir
showing heated effluent flowing from discharge arm into rest of reservoir.
"Bubble-ups" can be seen most clearly in image on right as two dark
spots near mouth of discharge arm.