WSRC-MS-2000-00282
J-Integral Fracture Toughness Testing and Correlation to the Microstructure
of A285 Steel For Fracture Analysis of Storage Tanks
A. J. Duncan, K. H. Subramanian, and R. L. Sindelar
Westinghouse Savannah River Company
Aiken, South Carolina
K. Miller, A. P. Reynolds, and Y. J. Chao
University of South Carolina,
Columbia, South Carolina
This report was prepared as an account of work sponsored by an agency of the United States Government. Neither the United States Government nor any agency thereof, nor any of their employees, makes any warranty, express or implied, or assumes any legal liability or responsibility for the accuracy, completeness, or usefulness of any information, apparatus, product or process disclosed, or represents that its use would not infringe privately owned rights. Reference herein to any specific commercial product, process or service by trade name, trademark, manufacturer, or otherwise does not necessarily constitute or imply its endorsement, recommendation, or favoring by the United States Government or any agency thereof. The views and opinions of authors expressed herein do not necessarily state or reflect those of the United States Government or any agency thereof.
This report has been reproduced directly from the best available copy.
Available for sale to the public, in paper, from: U.S. Department of Commerce, National Technical Information Service, 5285 Port Royal Road, Springfield, VA 22161, phone: (800) 553-6847, fax: (703) 605-6900, email: orders@ntis.fedworld.gov online ordering: http://www.ntis.gov/support/ordering.htm
Available electronically at http://www.osti.gov/bridge/
Available for a processing fee to U.S. Department of Energy and its contractors, in paper, from: U.S. Department of Energy, Office of Scientific and Technical Information, P.O. Box 62, Oak Ridge, TN 37831-0062, phone: (865 ) 576-8401, fax: (865) 576-5728, email: reports@adonis.osti.gov
Abstract
The fracture toughness properties of A285 steels are being measured at various material and test conditions for application to elastic-plastic fracture mechanics analysis of high level waste storage tanks at the Department of Energy Savannah River Site (SRS). Testing is being performed to determine the effect of composition, microstructure and orientation on the J-Integral resistance (J-R) behavior at minimum operating temperatures.
Materials for testing were selected over ranges based on available heats of new and 1950’s vintage material considering the compositions that span the tank plates. Specimens were oriented for crack growth parallel (T-L) and perpendicular (L-T) to the rolling direction of the plate. Temperature was varied between 60 and 80 oF. Specimens were tested at a stress intensity loading rate of 0.7 (ksi-£ in) /sec. Compact tension specimens were designed with thicknesses (0.5 < B < 0.875 inches) applicable to existing storage tank structures. Property measurements focus on J-R curve testing in order to fully understand ductile fracture behavior of these materials at operational temperatures.
The observed parameters are correlated to the microstructure of each respective plate of steel. J-R curve behavior of select heat E400 (benchmark due to compositional similarity to storage tank steel) is presented. The results show a strong orientational and compositional effect on elastic-plastic J-R curve behavior. In addition, the J-R curve behavior is relatively insensitive to temperature or thickness over the range of test temperatures.
Introduction
An experimental test program was developed to measure mechanical properties of A285 carbon steel for application to fracture analyses of storage tanks at SRS. Previously, limited data from J-Integral testing was performed on archival piping to provide property inputs for a flaw stability analysis, of the storage tanks. Recent mechanical testing for fracture toughness was performed on A285 steels that span storage tank plate compositions. The steel was tested at static loading rates. These materials are being tested in order to correlate composition, microstructure and loading conditions to structural reliability of storage tanks.
Mechanical properties are an essential input to accurate flaw stability analyses of the tanks, to development of tank fill limits, and to provide the basis for tank inspection (regions, extent, frequency, and methods).
Testing variables selected for fracture toughness testing include composition, microstructure, temperature and orientation of the plate. These variables were selected because of their expected influence on fracture toughness. The range of each variable in the test matrix was selected to closely match service conditions at or near the 70 oF operational limit of the tanks. Statistical analysis for fracture toughness will be generated from the data that allows construction of tolerance and confidence intervals at the specific conditions of interest.
Materials Tested
Composition
The carbon steel that made up the storage tanks of interest conformed to specification American Society for Testing Materials (ASTM) A285-50T, Grade B firebox quality (A285). The composition ranges of known waste tanks steels are shown in Table 1 along with the max composition allowed by the standard. At the time these tanks were constructed, these steels were produced from open-hearth furnace practices. They were semi-killed and then hot rolled into plates.
Available material of current vintage was selected to closely match the materials used in the storage tanks. The sensitivity of mechanical properties of composition is well known , . Based on the compositional information from Table 1, the materials selected for testing were chosen based on their representative levels of carbon, manganese, phosphorus and sulfur and are shown in Table 2.
Table 1. Known Chemical Composition Ranges for A285 Waste Tanks Steels along
with the ASTM Specification for A285-50T, Grade B from 1950.
|
A 285 Grade B |
Steels Present in Waste Tanks |
ASTM A285-50T |
|
|
Min |
Max |
Max |
|
|
Carbon |
0.08 |
0.2 |
0.2 |
|
Manganese |
0.37 |
0.6 |
0.8 |
|
Phosphorus |
0.006 |
0.015 |
0.035 |
|
Sulfur |
0.02 |
0.037 |
0.04 |
Table 2. Compositional Range of Selected Heats for Testing
|
A 285 Grade B and C |
Composition, wt. % |
|
|
Min |
Max |
|
|
Carbon |
0.05 |
0.29 |
|
Manganese |
0.35 |
0.9 |
|
Phosphorus |
0.005 |
0.035 |
|
Sulfur |
0.005 |
0.04 |
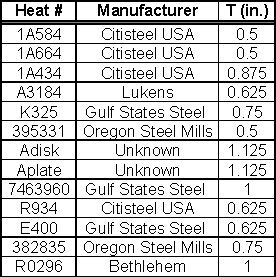
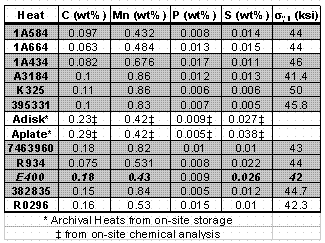
Several heats of commercially available material and some archival heats of A285 located on-site were analyzed. The selected heats, together with the plate thickness and manufacturer, are shown in Table 3. All of these heats were produced from semi-killed steel by hot rolling to the plate thickness shown below. Table 4 contains the compositions and yield strength (where available) of the selected heats. Of the thirteen heats in this matrix, nine were selected for the testing (denoted in Table 4 by shading). Heat E400 the primary heat selected for multiple tests due to its compositional similarity to the archival steel plates with highest carbon content and impurity levels.
Table 3: Heats of A285 Steel Selected for Examination

Table 4: Composition and Yield Strength of Selected Heats
from Supplier Certificates (unless otherwise noted)
Most of the steels in this matrix were produced in the 1980’s and 1990’s from modern steel making practices. In the future, comparison of these steels with the two archival heats (i.e., Aplate and Adisk) in the matrix will be conducted to determine the impact of processing technology on properties. But this impact may already be accounted for in composition variables (e.g., impurity content). However, if the matrix does not adequately explain variations observed between the "new" and "archive" steels, additional archival heats may be added to the test matrix, if available.
Microstructure
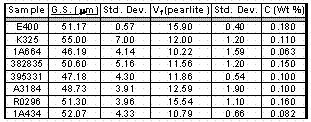
Quantitative metallography has been performed on several heats of steel. Grain size and pearlite volume fraction were computed using image analysis software, and are enumerated in Table 5. Grain size measurements were done using the line-intercept method as prescribed by ASTM E112 and show less than a 20% variation.
Table 5: Quantitative Metallography
In addition, 3-dimensional images were formulated for the microstructure of each of the heats as shown for heats E400 and 1A434 in Figures 1 and 2, respectively. These constructions show the distribution of the ferrite and pearlite with respect to orientation. The distribution of pearlite in heat E400 (Figure 1) appears to be relatively isotropic when compared to the pearlitic banding in heat 1A434 (Figure 2). However, Figure 3 shows indications of pearlite banding in a different region of Heat E400. This implies that the extent of banding can be location specific.
Pearlitic banding is usually attributed to microsegregation of manganese in these steels, but may also be caused by precipitation of non-metallic inclusions or hot rolling at low finishing temperatures and cooling rates. Pearlitic banding has been observed to be altered by heat treatment and changes to the thermomechanical process schedules of the steel. Banding has several effects on mechanical properties. The layered structure resembles a crack divider orientation, in the L-T as well as the T-L orientation. This has been found to increase toughness through a delamination induced toughening process. Delamination of pearlite from ferrite decreases the effective thickness inducing plane stress conditions, and thereby increasing toughness. In general, banding may increase toughness variation between orientations. However, one study on banded steels6 determined that the effect of inclusion content had a larger impact on the orientation dependence of upper-shelf fracture properties than banding. In any case, the test range thickness variation is far within bounds of plane stress conditions, minimizing the effects of delamination-induced toughening.

Figure 1: Heat E400 Microstructure

Figure 2: Heat 1A434 Microstructure
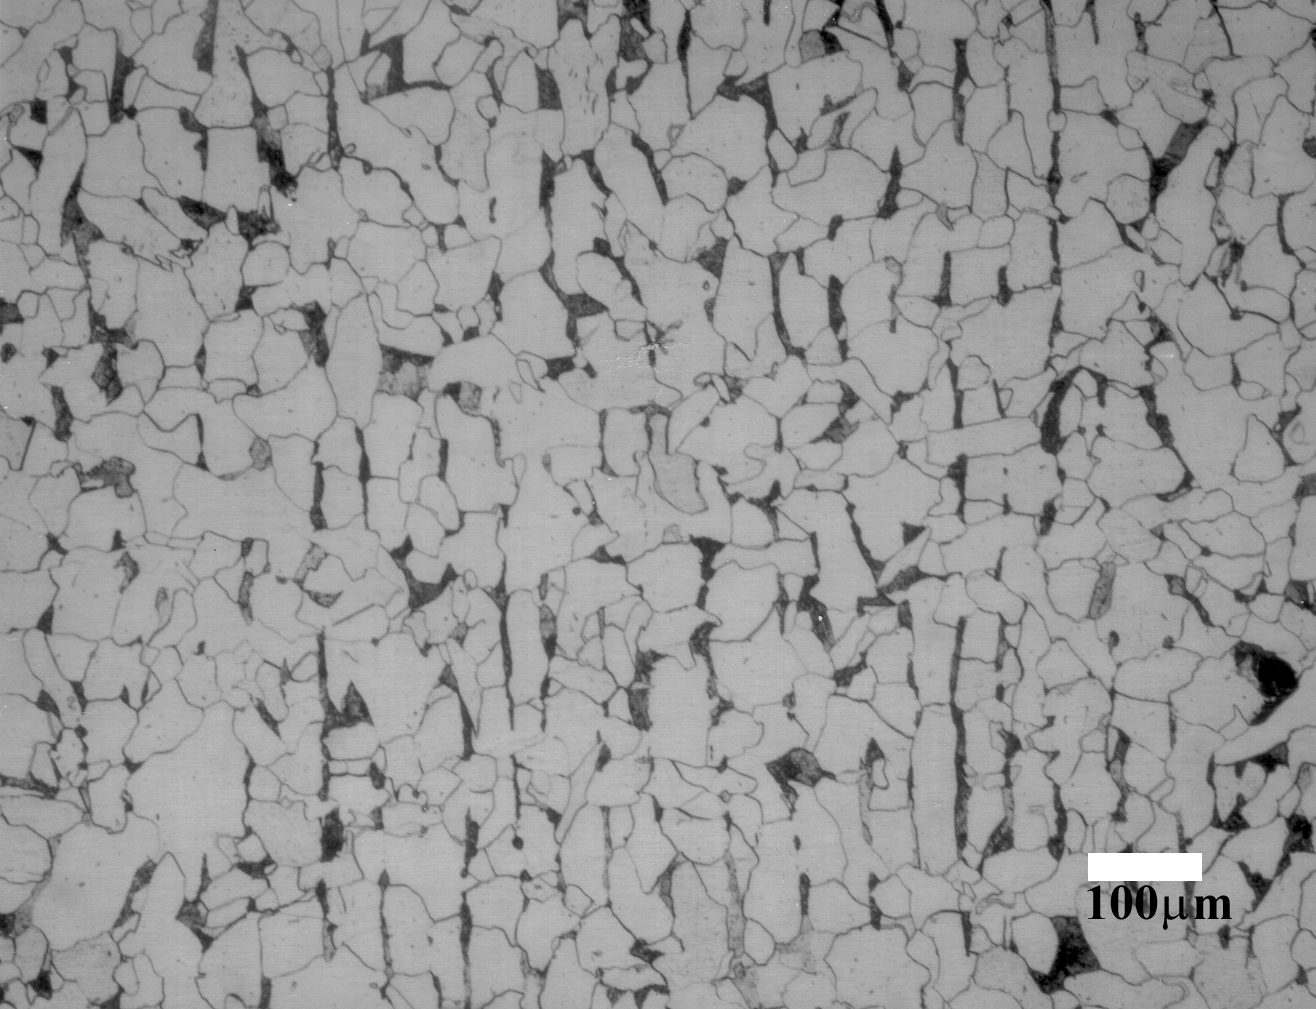
Figure 3: Heat E400 Microstructure Showing Pearlitic Banding
The microstructure of archival steel, shown in Figures 4 and 5, present evidence of location specific, pearlitic banding. The metallographic samples were taken from different locations of the same archival disk. The presence of location specific banding may limit the comparison of J-R curve behavior between different specimens. It is important to note, however, that the pearlitic banding in all samples is still not continuous. Hence, its impact on properties is not expected to be greater than other variables (i.e., composition and/or inclusion content).
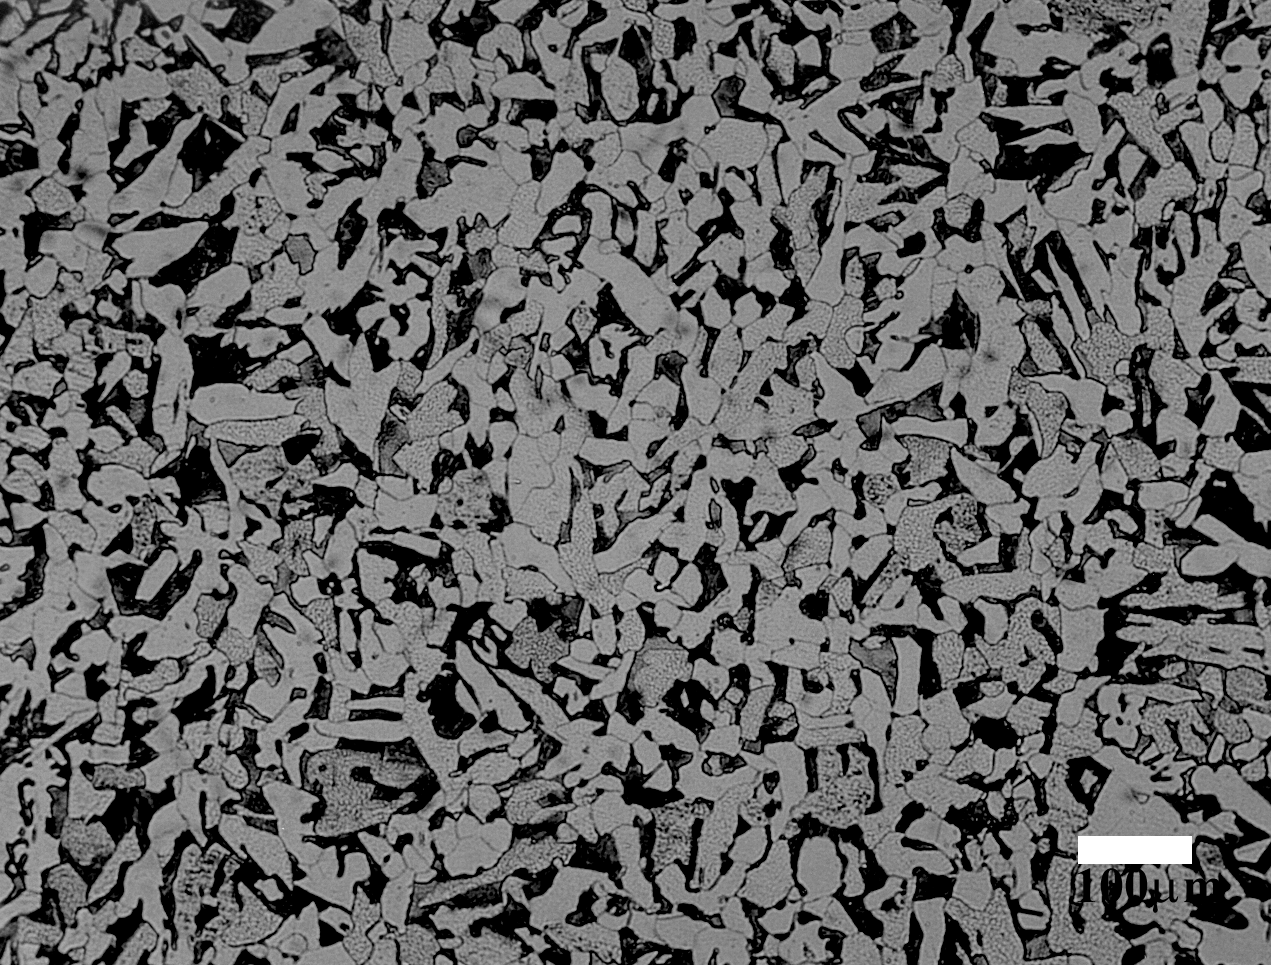
Figure 4: Archival Microstructure w/o Banding
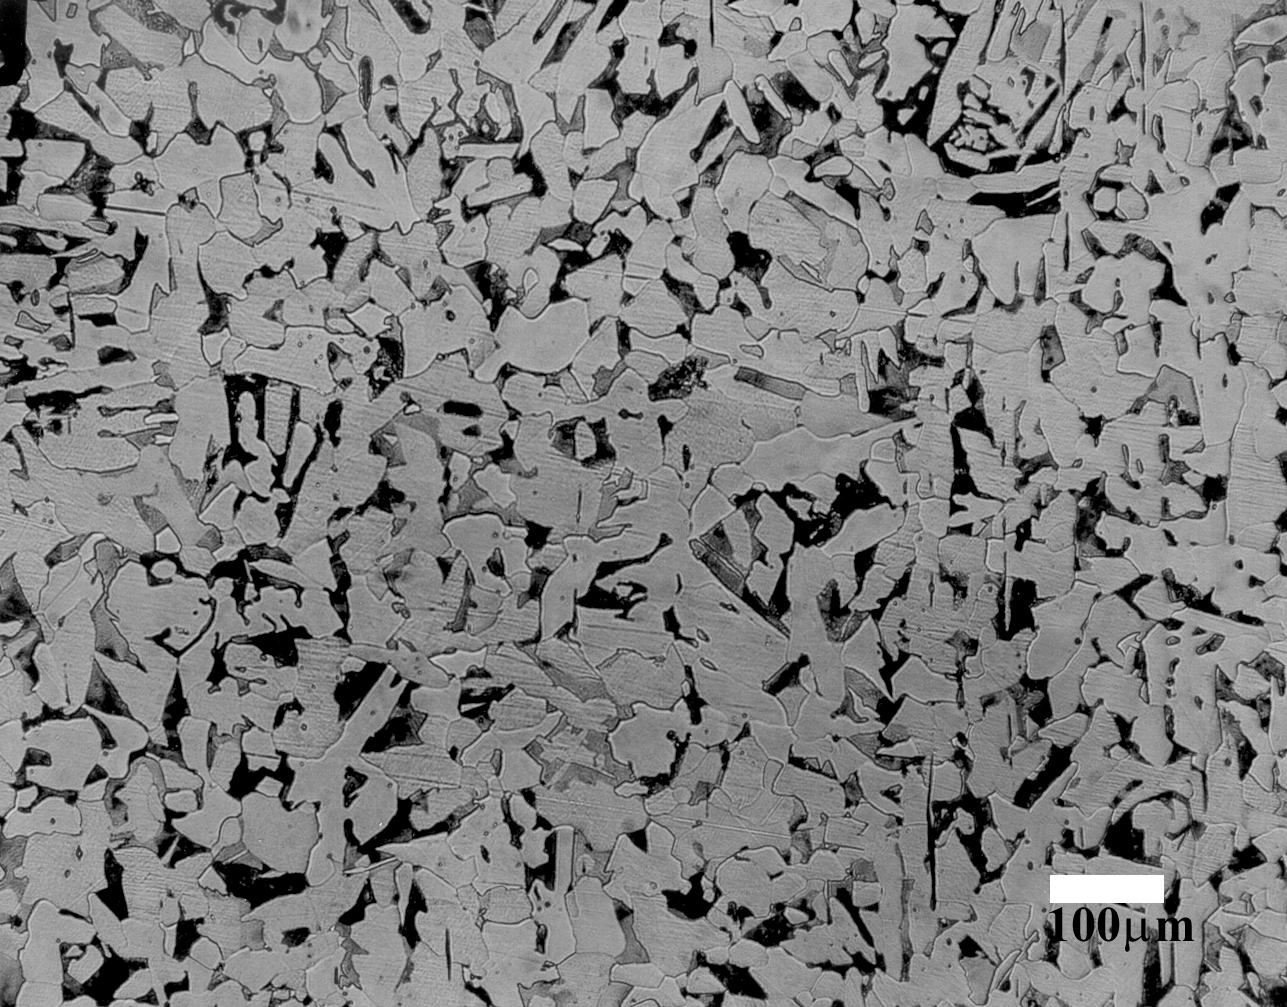
Figure 5: Archival Microstructure w/ Minor Banding
Testing Methods
Specimen Design
Fracture toughness testing was performed on compact tension specimens of ASTM standard geometry shown in Figure 6. During the performance of the test matrix, temperature, thickness and orientation were varied as shown in Table 6. In this table, the tests of interest are shaded. The nominal temperatures and thicknesses chosen reflect operating conditions and materials of construction for the waste tanks.

Figure 6: CT Specimen Design
The specimens were machined to the ASTM E 1820 configuration for a specimen of varying thickness (B) from 0.5" to 0.875". The nominal specimen width (W) of 2.5" was chosen in order to allow for measurement of valid J at large crack extensions, in accordance with ASTM E-1820. However, the thickness was not increased for 2 reasons: (1) thickness was limited to the maximum section thickness of the storage tanks, 0.875"; (2) thicker specimens would dramatically reduce the number of eligible heats for testing.
Table 6. Test Matrix
|
Heat |
Sample |
Thickness |
Side |
Temp (oF) |
Orient. |
|
1A434 |
-8 |
0.675 |
10% |
60 |
T-L |
|
1A434 |
-9 |
0.875 |
10% |
60 |
T-L |
|
1A434 |
-14 |
0.875 |
10% |
80 |
L-T |
|
1A5864 |
-6 |
0.5 |
10% |
60 |
T-L |
|
1A5864 |
-12 |
0.5 |
10% |
80 |
L-T |
|
1A5864 |
-13 |
0.5 |
10% |
80 |
L-T |
|
382835 |
-15 |
0.75 |
10% |
60 |
T-L |
|
395331 |
-8 |
0.5 |
10% |
80 |
L-T |
|
395331 |
-9 |
0.5 |
10% |
80 |
L-T |
|
A3184 |
-8 |
0.625 |
10% |
70 |
T-L |
|
R934 |
-11 |
0.5 |
10% |
60 |
L-T |
|
R934 |
-12 |
0.5 |
10% |
60 |
L-T |
|
R934 |
-13 |
0.625 |
10% |
70 |
L-T |
|
E400 |
T1 |
0.5 |
10% |
70 |
T-L |
|
E400 |
L1 |
0.5 |
10% |
70 |
L-T |
|
E400 |
L2 |
0.5 |
10% |
70 |
L-T |
|
E400 |
T2 |
0.5 |
10% |
80 |
T-L |
|
E400 |
L8 |
0.625 |
20% |
70 |
L-T |
|
E400 |
L6 |
0.625 |
0% |
80 |
L-T |
|
E400 |
L3 |
0.625 |
10% |
70 |
L-T |
|
E400 |
L4 |
0.625 |
10% |
70 |
L-T |
|
E400 |
T3 |
0.625 |
10% |
70 |
T-L |
|
E400 |
T4 |
0.625 |
10% |
70 |
T-L |
|
E400 |
T5 |
0.625 |
20% |
80 |
T-L |
|
E400 |
T6 |
0.625 |
0% |
70 |
T-L |
|
K325 |
L1 |
0.525 |
10% |
70 |
T-L |
|
K325 |
T1 |
0.525 |
10% |
70 |
L-T |
|
K325 |
T2 |
0.525 |
10% |
70 |
L-T |
|
K325 |
T4 |
0.725 |
10% |
70 |
L-T |
|
K325 |
T3 |
0.725 |
10% |
60 |
L-T |
|
K325 |
L3 |
0.725 |
10% |
60 |
T-L |
|
K325 |
L4 |
0.725 |
10% |
70 |
T-L |
Testing
Fracture toughness tests were conducted as prescribed by ASTM E1820 and J-R curves were derived for each of the specimens. Crack length measurements were made by Direct Current Potential Drop (DCPD) and unloading compliance depending upon sample. All tests were performed corresponding to a stress intensity loading rate of 0.7 (ksi-£ in) /sec. The load line crack opening displacement was measured with an inboard clip gage attached to front notches at the load line. After testing, optical crack length measurements were made and used to transcribe experimental crack length data as per ASTM E1820.
The load-deflection (load vs. load-line displacement) curves from the C (T) tests, along with the crack length measured, were then converted to J-R curves following the guidelines described in ASTM E1820.
Results
The J-R curves for the E400 heat tested in the T-L and L-T orientations are shown in Figure 7 and 8, respectively. Figure 9 shows the effect of orientation on the J-R curves. The test conditions (actual temperature and thickness) are shown in the legend.
Testing in the low toughness T-L orientation showed remarkable reproducibility. In the high toughness L-T orientation, however, the J-R curves have greater scatter. The E400L6 specimen was not sidegrooved, and hence, is expected have a higher J-R curve due to lower constraint. Additional scatter could be a result of location specific banding, inclusion distribution, or the effects of the added plasticity on the measurement of crack length. A pronounced orientation effect can be seen in Figure 9. Specifically, the J-R curves from L-T oriented specimens are shown to exhibit a higher resistance to fracture than T-L oriented specimens. Test temperature had a negligible effect on J-R curve behavior in the range chosen, as can be seen in Figures 7 and 8. Thickness variation also had minimal effect on the J-R curves in the tested range. This is not surprising considering the narrow range of both thickness and temperature tested.
Figure 10 shows the effect of carbon content on J-based behavior. These data include preliminary data from heats 382835 and 1A434 in the T-L (low toughness) orientation. It can be seen that a higher carbon content results in lower J-R curve behavior. Further tests will be done to specify carbon effects on J-R curve behavior and fracture toughness and their implications on waste tank integrity.

Figure 7: Heat E400, T-L Orientation J-R Curves
(Sample #: Thickness and Temperature in the Legend)

Figure 8: Heat E400, L-T Orientation J-R Curves
(Sample #: Thickness and Temperature in the Legend)

Figure 9: J-R Curves for E400 Heat Showing Orientation Effect
(Sample #: Thickness and Temperature in the Legend)

Figure 10. Carbon Content Effect on J-R Behavior
(Sample #: Carbon Content in the Legend)
Discussion
Fractography
The fracture samples of tested E400 heat samples are shown in Figure 11. Visual inspection of fracture surfaces of the specimens tested to date have shown ductile tearing with no evidence of cleavage for crack extension up to the limit of the test. On a macroscopic scale, all specimens that exhibited any substantial crack growth showed lateral contraction and crack tunneling indicative of substantial ductility and toughness for specimen thickness up to 0.875". Crack tunneling will be avoided in future testing with increased side grooving.
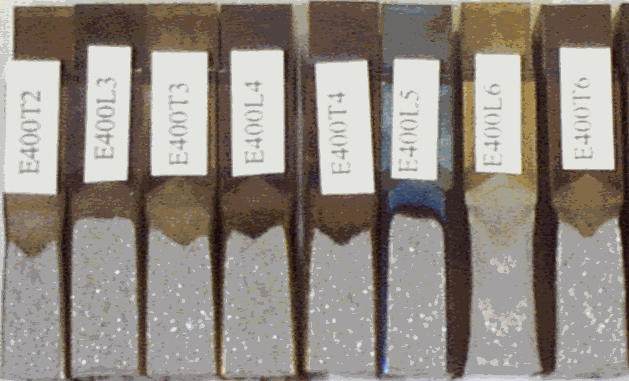
Figure 11: E400 Heat Fracture Surfaces
Fractographs that are representative of the specimens have been completed on some specimens of interest. Two specimens from heat E400 are shown in Figures 12 and 13. Each figure is divided into three regions: fatigue pre-crack; J-R test region (between construction lines); and post test fracture. Higher magnification images of selected features are displayed on the right with the common feature denoted by arrows. The fracture surfaces for specimens of heat E400 were either oriented transverse (Figure 12) or parallel (Figure 13) to the rolling direction of the plate. The portion of the fracture surface corresponding to the J-R curve in Figure 12 shows equiaxed dimples of varying size. The portion of the fracture surface corresponding to the J-R curve in Figure 13 shows delaminating regions interspersed with fine equiaxed dimples. Delamination (or elongated cracking) on the fracture surface of the T-L orientation may be indicative of pearlite bands. A micrograph taken from this specimen shows evidence of this banding in Figure 3. On the L-T oriented fracture surface, the pearlite bands would be seen dotted and perpendicular to the plane, therefore invisible in the thickness of the fracture surface. The presence of equiaxed dimples in either orientation is consistent with ductile fracture by void growth and coalescence around inclusions which is a failure mechanism common in steels. These dimples do appear to be more pronounced in the Figure 12 which is expected considering the higher toughness (i.e., greater deformation) of this specimen.
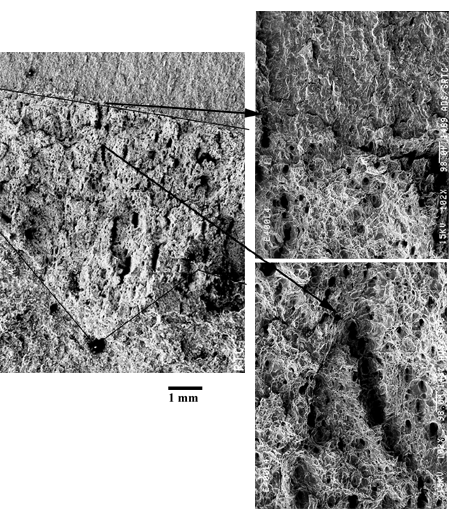
Figure 12: E400 L2 SEM Fractograph, 73oF, L-T orientation
Statistical Analysis
A figure-of-merit of J at 3 mm of crack extension has been selected to provide a point of comparison of results from the J-R curves and is an initial recommendation for allowable crack extension to ensure stable, ductile crack growth in flaw stability analysis of the tanks.
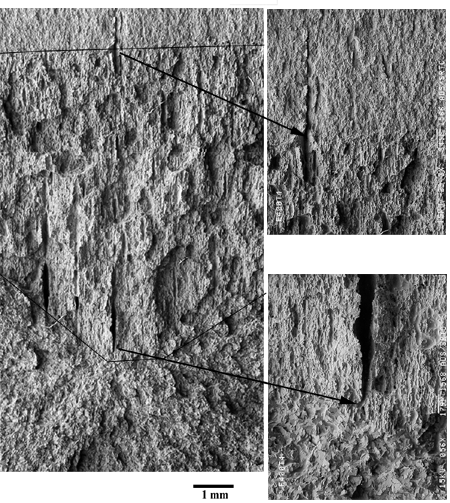
Figure 13: E400 T4 SEM Fractograph, 75oF, T-L orientation
The value of J at 3 mm was extracted from a power law fit to data within ASTM E1820 validity. The results of which are shown in Tables 7 and 8 for the T-L and L-T orientation respectively. A "lower bound toughness estimate" was determined statistically. A one-sided tolerance interval was constructed using the following equation: x-g'•s, where x is the mean, g' is a constant specific to tolerance/confidence intervals, and s is the standard deviation. It is seen that 90% of the population of tests in the T-L orientation will be have a J value of greater than 1763 in-lb/in2 within a 90% tolerance bound. In addition, 90% of the population of tests in the L-T orientation will be have a J value of greater than 2415 in-lb/in2 within a 90% tolerance bound. As a greater population within a tighter tolerance bound is calculated, the scatter increasingly varies as a result of the small population size
Table 7: Toughness (J at 3mm) for Heat E400, T-L

Table 8: Toughness (J at 3mm) for Heat E400, L-T
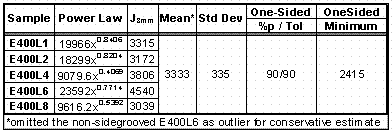
It is necessary to obtain additional data to provide a tighter tolerance bound. Even though the majority of data values of the T-L, low toughness orientation are within one standard deviation, the small sample size induces a greater variance than is experimentally shown.
Conclusions
J-Integral testing was performed on A285 semi-killed, hot rolled plates to determine the effect of composition, microstructure and orientation on the fracture behavior of carbon steel for storage tanks at the DOE Savannah River Site. The preliminary findings in comparing the toughness results from the initial tests are the following:
These conclusions are drawn based solely on comparison of the heat E400 J-R curves. Toughness behavior as a function of each variable will be further tested to ensure results.
Additional fracture toughness tests will be performed and also tensile tests to determine JIC values. When data acquisition from the entire test matrix is complete, the data will be used to compile a predictive model for flaw behavior in storage tanks.
Acknowledgments
Our colleague, Dr. Bruce J. Wiersma, is the lead investigator for service effects to the storage tanks and has provided much of the background work for this study. This work was funded by the U. S. Department of Energy under contract No. DE-AC09-96SR18500.
References
1. Sindelar, R. L., Lam, P. S., Caskey, Jr., G. R. and Woo, L. Y., "Flaw Stability in Mild Steel Tanks in the Upper Shelf Ductile Range-Part I: Mechanical Properties," ASME J. Pressure Vessel Technol., 122, May (2000) to be published.
2. Lam, P-S., and Sindelar, R. L., "Flaw Stability in Mild Steel Tanks in the Upper Shelf Ductile Range-Part II: J-Integral Based Fracture Analysis" ASME J. Pressure Vessel Technol., 122, May (2000) to be published.
3. Burns, K. W., and Pickering, F. B., "Deformation and Fracture of Ferrite-Pearlite Structures," J. Iron and Steel Inst., Nov. (1964), pp. 899-906.
4. Boulger, F. W., and Frazier, R. H., "The Influence of Carbon and Manganese on the Properties of Semikilled Hot Rolled Steel," J. Metals, Trans. AIME, May (1954), pp. 645-652.
5. "Test Methods for Determining Average Grain Size," ASTM Standard E112, Annual Book of ASTM Standards, 3.01 (1999).
6. Grange, R. A., "Effects of Microstructural Banding in Steel," Metallurgical Trans. 2, Feb. (1971), pp. 417-426.
7. Shanmugam, P., Pathak, S. D., "Some Studies on the Impact Behavior of Banded Microalloyed Steel," Engineering Fracture Mechanics, 53 [6] (1996), pp 991-1005.
8. "Standard Test Method for Measurement of Fracture Toughness," ASTM Standard E1820, Annual Book of ASTM Standards, 3.01 (1999).