WSRC-MS-2000-00114
Plutonium Disposition and Storage Model
J. F. Krupa, R. A Dimenna, and B. J. Hardy
Westinghouse Savannah River Company
Aiken, South Carolina, 29808
This report was prepared as an account of work sponsored by an agency of the United States Government. Neither the United States Government nor any agency thereof, nor any of their employees, makes any warranty, express or implied, or assumes any legal liability or responsibility for the accuracy, completeness, or usefulness of any information, apparatus, product or process disclosed, or represents that its use would not infringe privately owned rights. Reference herein to any specific commercial product, process or service by trade name, trademark, manufacturer, or otherwise does not necessarily constitute or imply its endorsement, recommendation, or favoring by the United States Government or any agency thereof. The views and opinions of authors expressed herein do not necessarily state or reflect those of the United States Government or any agency thereof.
This report has been reproduced directly from the best available copy.
Available for sale to the public, in paper, from: U.S. Department of Commerce, National Technical Information Service, 5285 Port Royal Road, Springfield, VA 22161, phone: (800) 553-6847, fax: (703) 605-6900, email: orders@ntis.fedworld.gov online ordering: http://www.ntis.gov/support/ordering.htm
Available electronically at http://www.osti.gov/bridge/
Available for a processing fee to U.S. Department of Energy and its contractors, in paper, from: U.S. Department of Energy, Office of Scientific and Technical Information, P.O. Box 62, Oak Ridge, TN 37831-0062, phone: (865 ) 576-8401, fax: (865) 576-5728, email: reports@adonis.osti.gov
Introduction
An EXTEND/SDI-Industry model of DOE plutonium disposition and storage has been created which can easily accommodate changes in scenarios by changing input parameters. It matches well with hand-crafted spreadsheet analyses, and has the advantage that it shows system logic and can be documented easily.
Extensions to the model to perform costing or resource availability analysis can be easily incorporated as needed.
Discussion
Spreadsheet analysis has been used extensively to support DOE nuclear materials management. However analysis with spreadsheets has a number of shortcomings:
Discrete-event system simulation avoids all of these pitfalls. Initially implemented in programming languages, current generation simulation languages provide graphic interfaces, links for external input and output processors, and statistical support.
The Savannah River Site (SRS) will deal with dispositioning a substantial quantity of the nationís plutonium. An effort was initiated in December of 1998 to model plutonium processing and storage to support the disposition mission. An element of urgency was added in February of 1999 when the Department of Energy indicated that it wanted to present to Congress and the Defense Nuclear Facility Safety Board an optimum option for plutonium management in the Nuclear Weapons Complex.
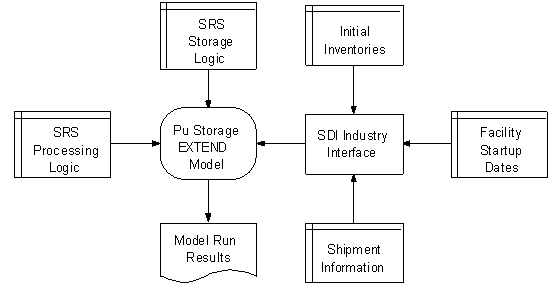
Along with efforts to develop information using spreadsheets, a plutonium disposition and storage model was developed using EXTEND™. EXTEND was chosen for this task because its hierarchical nature allowed development of a modular model which was easy to explain and understand. The SDI Industry™ add-on database interface was used to input key scenario parameters. The overall logic flow is shown in Figure 1 below.
The principal focus of the model was an assessment of storage capacity (or projected storage capacity) at the Savannah River Site. This assessment was influenced by three key variables:
Information that varied with scenarios was incorporated into the SDI Industry
EXCEL database, including such key parameters as initial inventories, shipment
dates and rates, and facility startup dates and processing rates. SDI Industry
passes this information to the EXTEND model using an ASCII file to store database
information. This file is incorporated into the EXTEND database using the SDI
Industry executive block. The database information can then be accessed within
the model through database lookup blocks.

Figure 1. Plutonium Storage Simulation Logic Flow
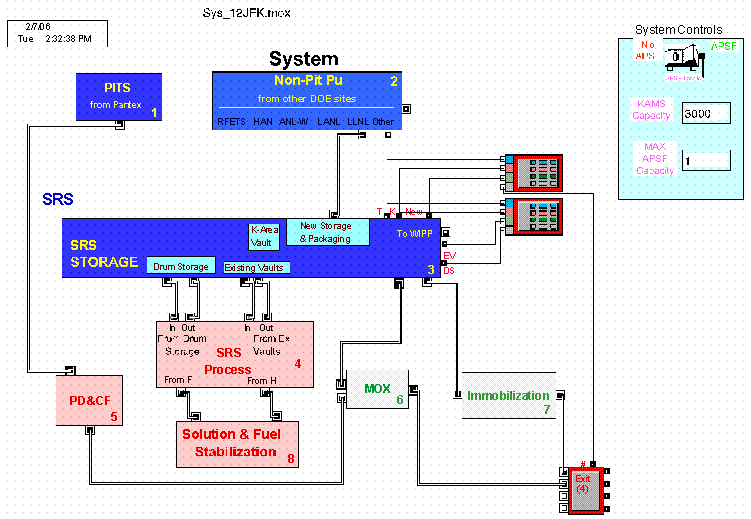
Figure 2. Plutonium Disposition and Storage Model
The EXTEND model itself incorporates the main structures of the system, including material and information flows. The high level model is shown below. Two of the three key variables are apparent even at this high level. The two icons at the top of the figure represent the offsite inventories that must eventually be transferred to SRS. The "Pits from Pantex" box represents plutonium in the form of pits which are designated for disassembly and conversion in the Pit Dissassembly and Conversion Facility (PDCF) and eventual conversion into MOX reactor fuel. Since the material flow logic for these pits is different from that for non-pit material, a material flow path is shown separate from the main "SRS Storage" block in the center of the figure.
The assessment performed with the current model dealt with facilities contained in the "SRS Storage" block. The principal driver for the assessment was the inventories contained in the "Non-Pit Pu" block. This included the material described in tables containing container information, inventory amounts, and target shipping dates and rates. The key variable in assessing the amount of SRS storage needed to accommodate the Pu inventories and shipping schedules is the processing capability at SRS. Processing capability may take the form of existing or proposed facilities to be used for final disposition of plutonium. Proposed facilities include proposed MOX and immobobilization facilities.
Existing facilities were modeled as shown in the SRS Process figure. The hierarchical nature of EXTEND was particularly advantageous in that the SRS Process lines could be modeled in a block diagram form with representative process rates input to give a "first approximation" estimate of capacity based on experience with the facility. If more detail is needed later to refine the storage assessments, it can be added with no rework of the current model. The approximate rates can simply be replaced with more accurate data or with a more detailed model for that portion of the process.
New facilities were equally important. These were modeled with anticipated production rates and a proposed startup date. Both of these inputs were considered to be sensitivity parameters, and they were manipulated to determine their impact on the required SRS storage capacity. Indeed, even the availability of new SRS storage capacity was treated as a sensitivity parameter to determine the impact on deinventorying the plutonium from the existing sites included in the model.
Pits from demilitarized weapons will be treated in PDCF. The resulting plutonium oxide (along with possibly some clean oxide from non-pit sources) will be converted to mixed oxide fuel in the MOX facility and shipped to commercial nuclear reactors to generate power. Most non-pit plutonium from Nuclear Weapons Complex sites including SRS will be treated as necessary to create acceptable immobilization feed. The feed will be combined with ceramic formers to make an immobilized plutonium waste form, loaded into canisters, the canisters loaded into a DWPF canister, and the DWPF canister filled with HLW glass containing Cs-137.
In the model, thick lines show material flow. Thin lines show information flow, for the most part input to plotters. The hierarchical nature (there is no limit to the levels of nesting that can be incorporated into the model) gives a clear indication of the logic used. Figure 3 below shows the section for SRS processing, which was implemented in a simplified way in the model.
The router is a logical unit that determines the type of material entering the SRS Process stream. At the time the model was developed, a number of materials, including Sand Slag and Crucible, and Plutonium Fluorides were slated for dissolution in F Canyon followed by conversion to metal in FB Line. Some classified plutonium parts were to be melted down in FB Line. Some materials with some uncertainty would undergo characterization. Basically clean oxide would be repackaged in bagless cans in FB Line. Material with significant amounts of HEU would join other EU/Pu materials for H Canyon processing and conversion to oxide.
The SRS Storage Block is shown at the next level of detail below in Figure 4. Critical model parameters were derived from the drum storage block, KAMS, and movement through new storage and packaging.
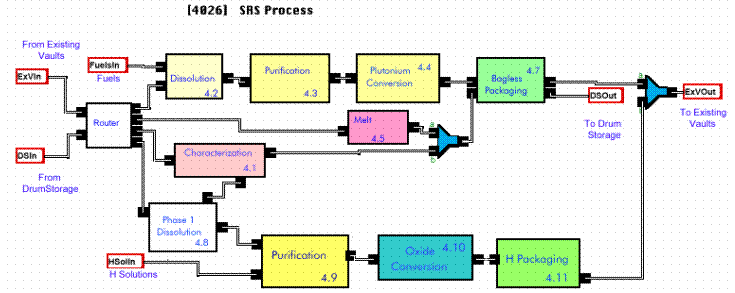
Figure 3. SRS Process Block
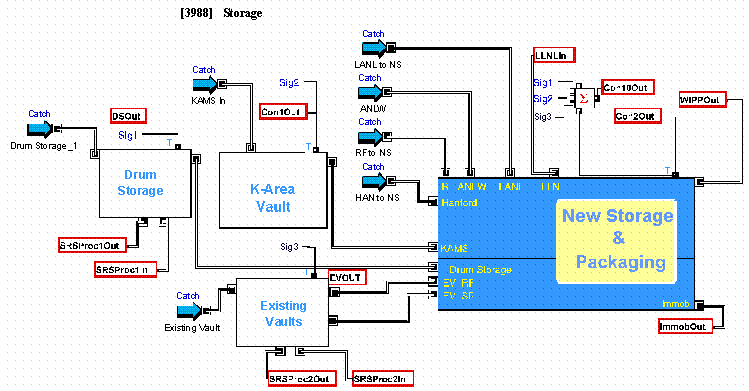
Figure 4. SRS Storage Block
Results
The simulation model gave comparable results to those provided by spreadsheet analysis. It had significant advantages in that it allowed for rapid assessment of additional cases without reformulating the model. A comparison of the model runs vs. spreadsheet analyses shows similar behavior for KAMS and new storage (APSF). The full capability of the model to look at the impact of system shutdowns (which have a significant impact on potential throughput) was not used. Very simple structures could have been used to implement these kinds of effects.
The results shown in Figure 5 compare spreadsheet analyses to the results from the EXTEND model. Since the calculations are basically counting items in and items out, one would expect that if both models were representing exactly the same process, the results would have to be identical. Previous work showed that in fact, both Excel (which was used for the spreadsheet analysis) and EXTEND did give identical results for a simple model which could be validated to be the same in both packages. Therefore, we are confident that both packages are performing arithmetic correctly, and any differences shown in Figure 5 are related to model differences.
As mentioned above, EXTEND is fairly easy to review to ensure that a model has been implemented as intended. A spreadsheet, on the other hand, is very hard to verify after it has been implemented. Equations and assumptions are generally buried in individual cells, and there is no structured order to the progression of a calculation. Any cell can point to any other cell in the spreadsheet subject to some limitations on circular references. In addition, the spreadsheet was developed based on a proposed shipping schedule and process schedule, and the monthly additions or subtractions from facility inventories were prescribed in the cell definitions. EXTEND also required the proposed shipping and process schedules to be input, but its ability to detect bottlenecks and delay further shipments until they were cleared meant that the schedules might not be adhered to throughout the calculation.
An example of this difference is seen in Figure 5 in the difference in the KAMS inventory. Both models calculate the KAMS filling at the same rate and at the same time. Both models required KAMS to be empty of all inventory ten years after the first Pu was introduced. Figure 5 shows that both models satisfied this requirement. Note, however, that the EXTEND calculation shows the discharge of KAMS delayed by nine months longer than in the spreadsheet. This delay was due to a requirement that SRS inventories have a nine-month preferential introduction to a new storage facility when it came on line. This delay was easy to implement in the EXTEND model, but it was not included in the spreadsheet calculation shown here. Nonetheless, the anticipated process rate at which KAMS could be discharged was still adequate to empty the facility within the 10-year requirement. Had that process rate been insufficient, the model would not have increased the rate to meet the required schedule. Instead, it would have shown a delay in emptying KAMS, and this delay would have been noted as a problem with the particular scenario being evaluated.
The differences in the APSF filling rate are associated with the same types of differences as described with the KAMS curves. Shipping rates are prescribed in the spreadsheet model and enforced through the cell definitions. The EXTEND model includes the logic associated with the shipping rates, including the ability of the sending facilities to package and ship their materials at a rate consistent with the prescribed rates, and the ability of SRS to receive those shipments consistent with simultaneous receipt of shipments from other sites on schedules that seem to be independent, but really are coupled because of SRS capacity. The APSF fills faster filling in the spreadsheet model partly because it started nine months sooner than for the EXTEND model, and partly because the facility is allowed to receive materials faster than in the EXTEND model. It can also be seen that the APSF begins to empty sooner in the spreadsheet model.
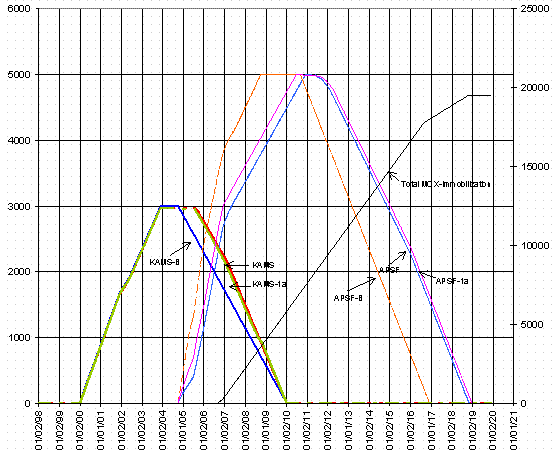
Figure 5. Model and Spreadsheet Comparisons
Additionally, the model itself documented the logic used in the analysis. Although the detail in the model was modest, it was developed rapidly, and with little modification could be used to analyze resource requirements, operating costs and shipping availability.
Impact of Stochastic Events on Model Results
Although the model was set up with deterministic logic, addition of stochastic elements is a very simple process that may have significant impact on the results. Many of the blocks in the process section, for instance were modeled as a simple 1 day delay. The figure below shows how these kinds of blocks might be modeled for a system that took into account variability in process times, and downtime.
Figure 6 shows a random block with a random arrival time (exponential; c = 1), random operating time (exponential; c =1, location = 1), random time between failures (Weibull; b = 60; a = 2) and random time to repair (Weibull; b = 60, a = 1.3). For a deterministic system, with a constant input rate of 1 unit a day, and a processing time of 2 days, the system could process 200 units in 401 days (the extra day is to get the unit out of the system). For the stochastic model, the mean throughput for fifty model runs was 122.74 with a variance of 1344.2. This is only 61% of the throughput of a deterministic system. If every process block was to have stochastic elements, especially related to times to failure and times to repair, the cumulative effect would have a significant impact on the system throughput.
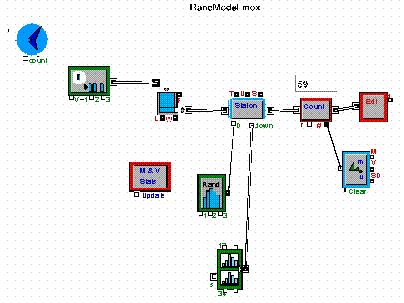
Figure 6. Random Block
Conclusions
Similar calculations were performed with traditional spreadsheet methods and with discrete event simulation software. Where identical conditions between the two methods and models were forced, results were essentially identical. The power of the discrete event modeling approach was observed when adding shipping and process schedule logic, determining bottlenecks in the process, and making rapid changes to the model to assess the impact of different decisions.
Stochastic processes potentially have a large impact on model results. Addition of these random elements, especially unscheduled shutdowns, would make a much more robust model.